| Southeastern Plains |
| December-January-February Precipitation |
|
(Return to Main Feature) or go to CD1 | CD2 | CD3 | CD4 | CD5 | CD6 | CD8 |
|
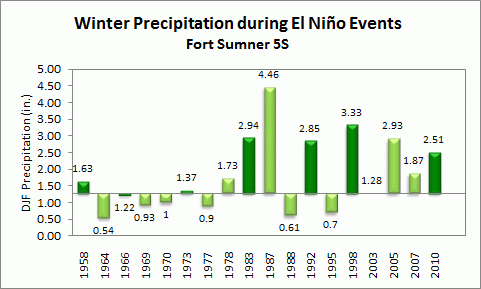
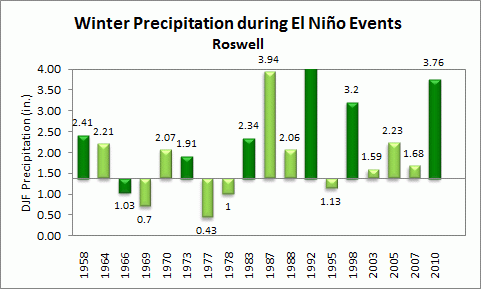
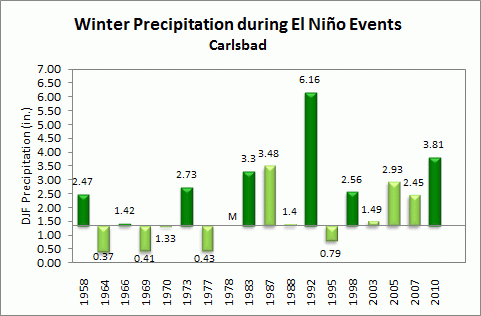
El Niño events impact the winter precipitation across southern New Mexico to a greater degree than other areas in the state. All three stations examined in this area reported DJF precipitation of 142% to 165% of the long term normal DJF. The increase in precipitation is even more dramatic in strong El Niño events, especially in Carlsbad with 239% of average precipitation. |
|
A description of the graphs is located at the bottom of the page. |
 |
| Percent of Longterm Average for all El Niño Events = 142% , for strong El Niño Events = 177% |
 |
| Percent of Longterm Average for all El Niño Events = 154% , for strong El Niño Events = 199% |
 |
| Percent of Longterm Average for all El Niño Events = 165% , for strong El Niño Events = 239% |
|
Precipitation values for 3-month periods during 18 El Niño Events since 1949-50 are plotted with respect to the long term precipitation average, listed to the right of the graph. The precipitation totals for each 3-month period are plotted above or below each bar. Years for which the El Niño Event was considered to be strong are colored in pdark green. "M" represents a 3-month period with missing data. Finally, the percents of long term normal for all El Niño events and for the strong El Niño events are listed below each graph. |