| Central Highlands |
| March-April-May Precipitation |
|
(Return to Main Feature) or go to CD1 | CD2 | CD3 | CD4 | CD5 | CD7 | CD8 |
|
Precipitation is generally reduced more in Spring than in winter during La Niña events across the central highlands. Ruidoso shows the most variability. For five of the six strong events, precipitation was below normal at all three sites, with 1976 reporting above normal precipitation in part due to a week of unsettled weather in late April and early May. |
|
A description of the graphs is located at the bottom of the page. |
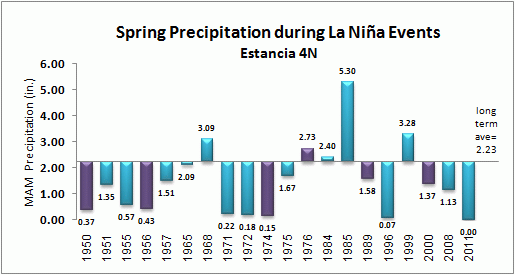 |
| Percent of Longterm Average for all La Niña Events = 66% , for strong La Niña Events = 50% |
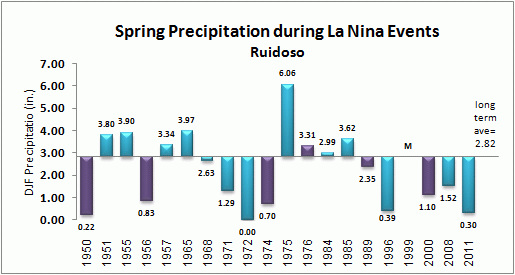 |
| Percent of Longterm Average for all La Niña Events = 79% , for strong La Niña Events = 50% |
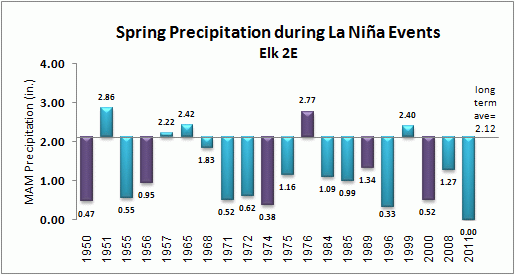 |
| Percent of Longterm Average for all La Niña Events = 58% , for strong La Niña Events = 51% |
|
Precipitation values for 3-month periods during 19 La Niña Events since 1949-50 are plotted with respect to the long term precipitation average, listed to the right of the graph. The precipitation totals for each 3-month period are plotted above or below each bar. Years for which the La Niña Event was considered to be strong are colored in purple. "M" represents a 3-month period with missing data. Finally, the percents of longterm normal for all La Niña events and for the strong La Niña events are listed below each graph. |


 Follow us on YouTube