100° Facts for Albuquerque and Other New Mexico Locations
(updated August 13, 2023)
|
|||||||||||||||||||||||||||||||||||||||||||||||||||||||||||||||||||||||||||||||||||||||||||||||||||||||||||||||||||||||||||||||||||||||||||||||||||||||||||||||||||||||||||||||||||||||||||||||||||||||||||||||||||
|
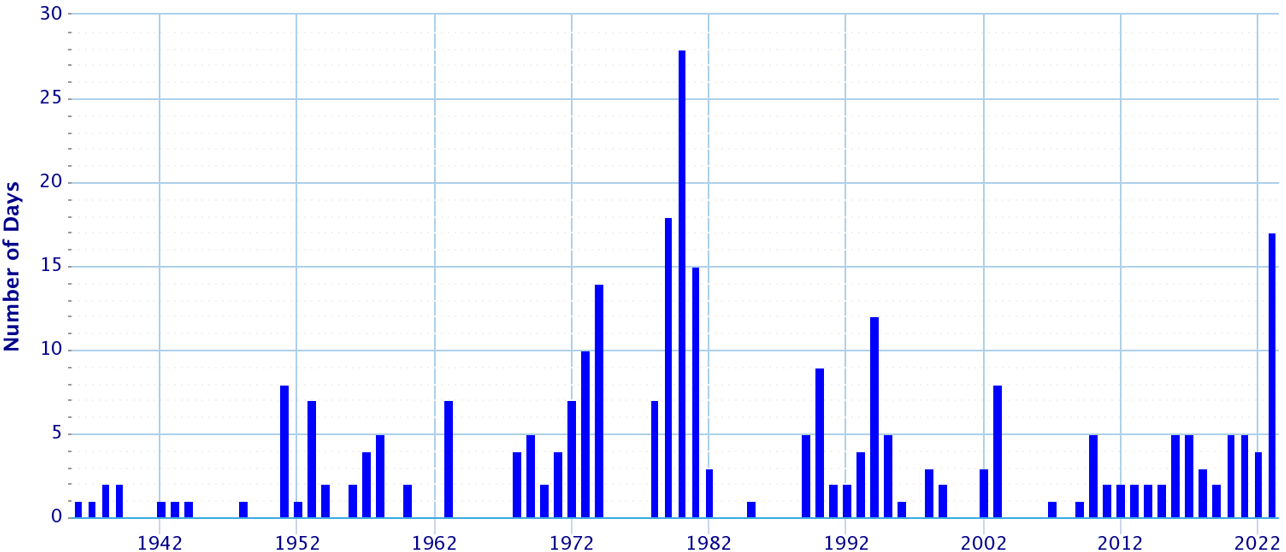
Most summers see heat waves in one or more parts of the United States, including New Mexico. Heat is one of the leading weather-related killers in the United States, resulting in hundreds of fatalities each year and even more heat-related illnesses. While hot temperatures can occur anytime from spring to fall in New Mexico, the months of June and July can be particularly brutal when it comes to heat. For heat-related resources and safety tips visit the National Weather Service Weather-Ready Nation heat safety website. Temperatures easily climb to 100°F or higher over the east central and southeast plains during the summer months, however, maximum temperatures reach the 100° degree or more threshold less often in Albuquerque. For other sites across central and southern New Mexico, maximum summer temperatures exceed 100° every year. Across portions of northern New Mexico, and the high terrain statewide, temperatures remain below 100°. One hundred degree data for sites around New Mexico are listed in the table at the end of this feature. The graph below depicts the number of days with a maximum temperature of 100° or more for the period 1936 through 2022. Temperatures remained below 100° degrees in 30 years during this period. In 1980, the temperature reached at least 100° on 28 days! |
|||||||||||||||||||||||||||||||||||||||||||||||||||||||||||||||||||||||||||||||||||||||||||||||||||||||||||||||||||||||||||||||||||||||||||||||||||||||||||||||||||||||||||||||||||||||||||||||||||||||||||||||||||
| Number of Days Max Temperature >= 100° Albuquerque Sunport 1936-2023 |
|||||||||||||||||||||||||||||||||||||||||||||||||||||||||||||||||||||||||||||||||||||||||||||||||||||||||||||||||||||||||||||||||||||||||||||||||||||||||||||||||||||||||||||||||||||||||||||||||||||||||||||||||||
 |
|||||||||||||||||||||||||||||||||||||||||||||||||||||||||||||||||||||||||||||||||||||||||||||||||||||||||||||||||||||||||||||||||||||||||||||||||||||||||||||||||||||||||||||||||||||||||||||||||||||||||||||||||||
|
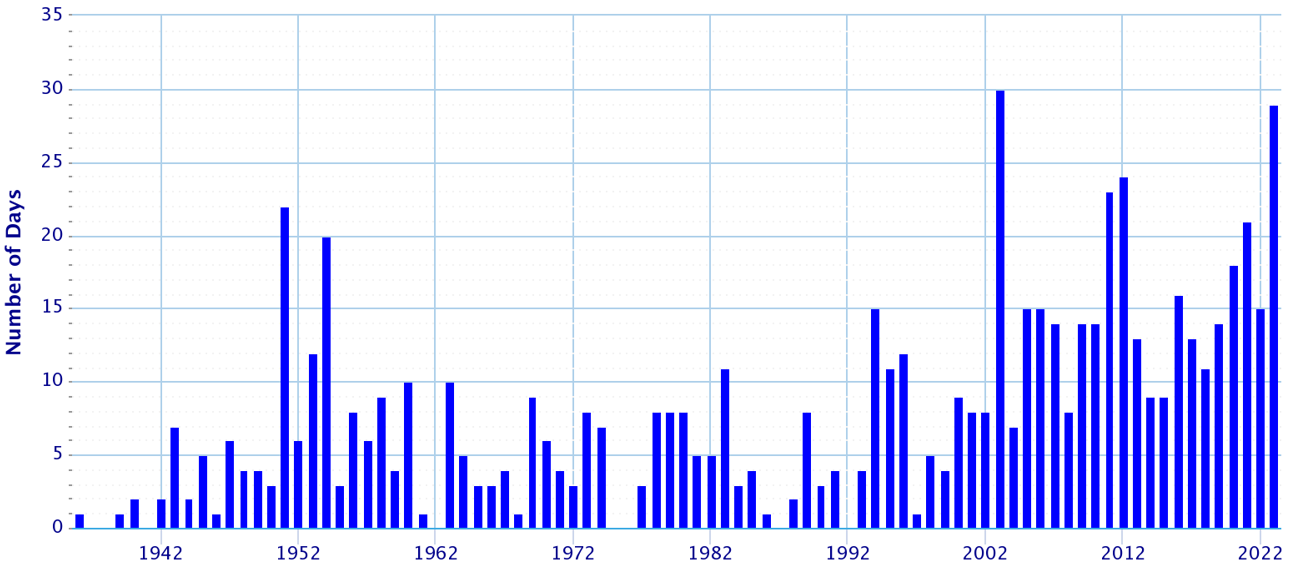
It is interesting to note that while we have documented an increase in temperatures in recent years, there had not been a corresponding increase in days over 100°. Minimum temperatures have increased more than maximum temperatures, and when we look at the frequency of minimum temperatures greater than 70°, an increase in recent years is strongly evident, and reflects conditions documented in the drought years of the 1950s. |
|||||||||||||||||||||||||||||||||||||||||||||||||||||||||||||||||||||||||||||||||||||||||||||||||||||||||||||||||||||||||||||||||||||||||||||||||||||||||||||||||||||||||||||||||||||||||||||||||||||||||||||||||||
| Number of Days Min Temperature >= 70° Albuquerque Sunport 1936-2023 |
|||||||||||||||||||||||||||||||||||||||||||||||||||||||||||||||||||||||||||||||||||||||||||||||||||||||||||||||||||||||||||||||||||||||||||||||||||||||||||||||||||||||||||||||||||||||||||||||||||||||||||||||||||
|
|
|||||||||||||||||||||||||||||||||||||||||||||||||||||||||||||||||||||||||||||||||||||||||||||||||||||||||||||||||||||||||||||||||||||||||||||||||||||||||||||||||||||||||||||||||||||||||||||||||||||||||||||||||||
100° Days at the Albuquerque Sunport Since 1990
|
|||||||||||||||||||||||||||||||||||||||||||||||||||||||||||||||||||||||||||||||||||||||||||||||||||||||||||||||||||||||||||||||||||||||||||||||||||||||||||||||||||||||||||||||||||||||||||||||||||||||||||||||||||
|
The number of days with a maximum temperature of at least 100° at the Albuquerque Sunport since 1990 are listed in the table below, along with the highest summer temperature recorded at the Sunport. For those interested in 100° facts for other cities across the state, annual average statistics for 14 additional sites are listed at the end of this feature.
|
|||||||||||||||||||||||||||||||||||||||||||||||||||||||||||||||||||||||||||||||||||||||||||||||||||||||||||||||||||||||||||||||||||||||||||||||||||||||||||||||||||||||||||||||||||||||||||||||||||||||||||||||||||
|
|||||||||||||||||||||||||||||||||||||||||||||||||||||||||||||||||||||||||||||||||||||||||||||||||||||||||||||||||||||||||||||||||||||||||||||||||||||||||||||||||||||||||||||||||||||||||||||||||||||||||||||||||||
Variability Across Albuquerque
|
|||||||||||||||||||||||||||||||||||||||||||||||||||||||||||||||||||||||||||||||||||||||||||||||||||||||||||||||||||||||||||||||||||||||||||||||||||||||||||||||||||||||||||||||||||||||||||||||||||||||||||||||||||
|
Depending on the location across the Albuquerque Metro Area, the number of days for which the temperature reaches at least 100° varies. In the table below, 100° statistics for two cooperative stations around Albuquerque (Corrales and Foothills) are compared to those for the Albuquerque Sunport for the period 1992 - 2020. 100 degree days occur much less frequently in the higher elevations of the Foothills, and more often in the Valley (*brief periods of missing data have been noted during this time at Corrales and the Foothills). |
|||||||||||||||||||||||||||||||||||||||||||||||||||||||||||||||||||||||||||||||||||||||||||||||||||||||||||||||||||||||||||||||||||||||||||||||||||||||||||||||||||||||||||||||||||||||||||||||||||||||||||||||||||
|
|||||||||||||||||||||||||||||||||||||||||||||||||||||||||||||||||||||||||||||||||||||||||||||||||||||||||||||||||||||||||||||||||||||||||||||||||||||||||||||||||||||||||||||||||||||||||||||||||||||||||||||||||||
100° Facts for the Albuquerque Area
|
|||||||||||||||||||||||||||||||||||||||||||||||||||||||||||||||||||||||||||||||||||||||||||||||||||||||||||||||||||||||||||||||||||||||||||||||||||||||||||||||||||||||||||||||||||||||||||||||||||||||||||||||||||
|
|||||||||||||||||||||||||||||||||||||||||||||||||||||||||||||||||||||||||||||||||||||||||||||||||||||||||||||||||||||||||||||||||||||||||||||||||||||||||||||||||||||||||||||||||||||||||||||||||||||||||||||||||||
|
*Note that historical weather records for Albuquerque are based on data collected from a number of sites. The official weather station has been on the grounds of what is now the Albuquerque International Airport (elev. 5313') since 1939. Prior to that, in 1892, the official station was at the intersection of 4th and Gold streets (elev. 4950'), the University of New Mexico from 1893-1910, and again from 1918-1931 (elev. 5150'). Records were kept at the Kimo Theatre (elev. 4960') from 1931-33, and at the TWA Airport from 1933-1938. A map of reporting stations illustrates various historical reporting locations across the Albuquerque metro area.
|
|||||||||||||||||||||||||||||||||||||||||||||||||||||||||||||||||||||||||||||||||||||||||||||||||||||||||||||||||||||||||||||||||||||||||||||||||||||||||||||||||||||||||||||||||||||||||||||||||||||||||||||||||||
Average Number of Days Reaching 100° and Maximum Number of Occurrences |
|||||||||||||||||||||||||||||||||||||||||||||||||||||||||||||||||||||||||||||||||||||||||||||||||||||||||||||||||||||||||||||||||||||||||||||||||||||||||||||||||||||||||||||||||||||||||||||||||||||||||||||||||||
|
|||||||||||||||||||||||||||||||||||||||||||||||||||||||||||||||||||||||||||||||||||||||||||||||||||||||||||||||||||||||||||||||||||||||||||||||||||||||||||||||||||||||||||||||||||||||||||||||||||||||||||||||||||


 Follow us on YouTube