National Weather Service United States Department of Commerce


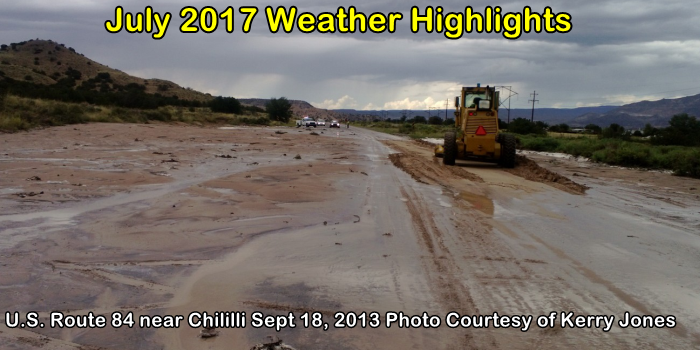
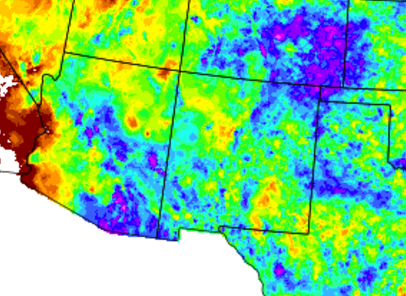
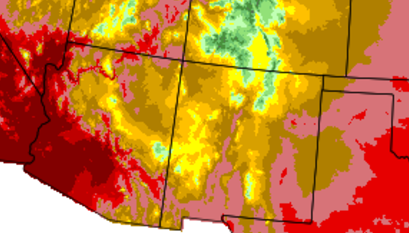
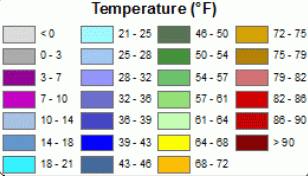
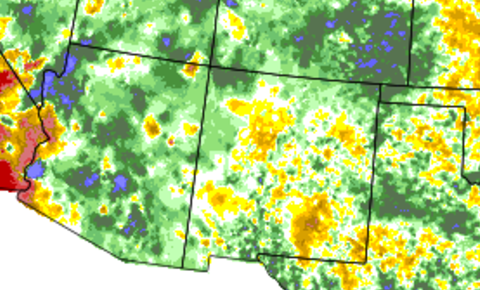
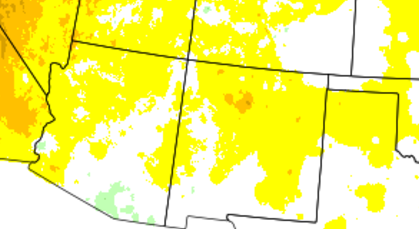
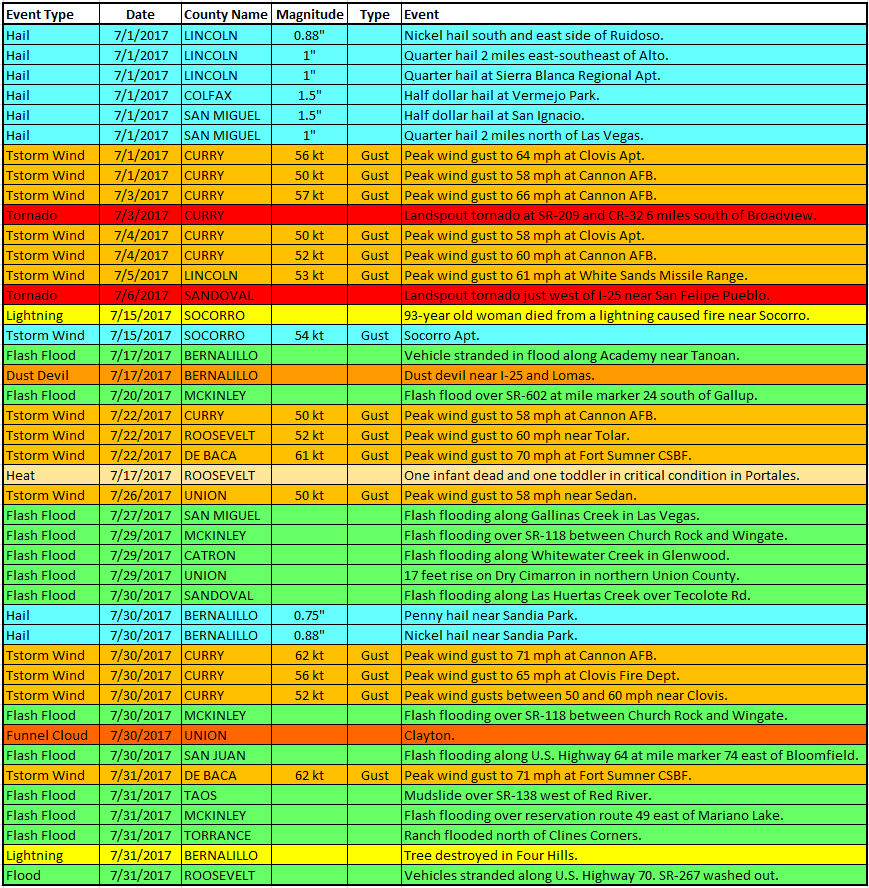
July 2017 was warmer than normal across most of New Mexico. Precipitation was varied throughout the state which is typical during the monsoon season.  The statewide average was near normal (0.08 inches above normal).

Severe weather on June 30th spilled over into July 1st. Isolated reports of severe weather also occurred on the 2nd through 5th. Mostly dry and very warm conditions followed on the 6th through 8th. Spotty showers and thunderstorms began on the 9th and continued for the most part through the rest of the month, but the typical monsoon pattern of direct southerly flow bringing moisture into the state did not materialize. Torrential rains were pretty much non-existent until the end of the month, when flash floods were reported on the 27th, and 29th through 31st. 

Statewide Precipitation and Temperatures

   
Statewide Precipitation - Actual Statewide Temperatures - Actual


Statewide Precipitation - % Departure From Normal Statewide Temperatures - Departure From Normal


   Climate Cities Temperatures and Precipitation

 
Albuquerque
 

There was 0.85 inches of precipitation measured at the Sunport in July 2017, which was 0.65 inches below the average of 1.50 inches.

The average temperature for Albuquerque in July 2017 was 79.8°, which was 1.5 degrees above the normal of 78.3°.

The average maximum temperature for the month was 92.1°. This was 2.0 degrees above the normal average maximum temperature of 90.1°.

The average minimum temperature for the month was 67.5°. This was 1.1 degrees above the normal average minimum temperature of 66.4 degrees.

Records: 

July 7: 72 record high minimum tied for the date

 
 Clayton
 

There was 3.88 inches of precipitation measured at Clayton in July 2017, which was 1.22 inches above the average of 2.66 inches. This was the 21st wettest July on record.

The average temperature for Clayton in July 2017 was 75.9°, which was 1.2 degrees above the normal of 74.7°.

The average maximum temperature for the month was 90.7°. This was 2.1 degrees above the normal average maximum temperature of 88.6 degrees.

The average minimum temperature for the month was 61.1°. This was 0.3 degrees above the normal average minimum temperature of 60.8°.

Records:

July 27: 1.58 inches of rain, daily record high                                                                                                       July 30: 1.52 inches of rain, daily record high

 
 Roswell
 

There was 1.68 inches of precipitation reported at Roswell during July of 2017, which was 0.38 inches below the normal of 2.06 inches.

The average temperature in Roswell for July 2017 was 82.9°, which was 2.6 degrees above the normal of 80.3 degrees.

The average maximum temperature for the month was 97.0°. This was 3.3 degrees above the average maximum temperature of 93.7 degrees.

The average minimum temperature for the month was 68.9°. This was 1.9 degrees above the normal average minimum temperature of 67.0°

Records: none


Severe Weather

Storm reports are considered preliminary until a final review is certified in the NWS Storm Data publication.
Certified data is available three to four months post-event at: https://www.ncdc.noaa.gov/stormevents/