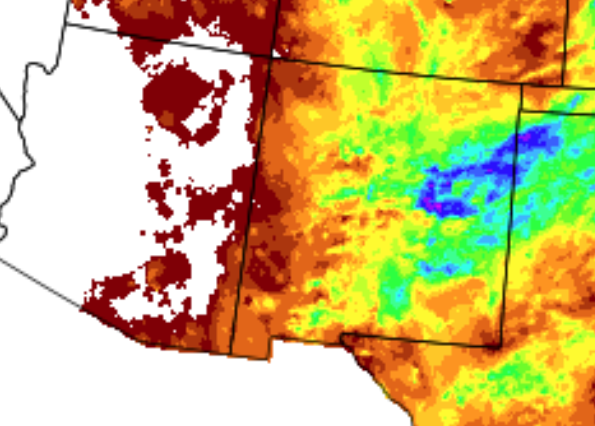
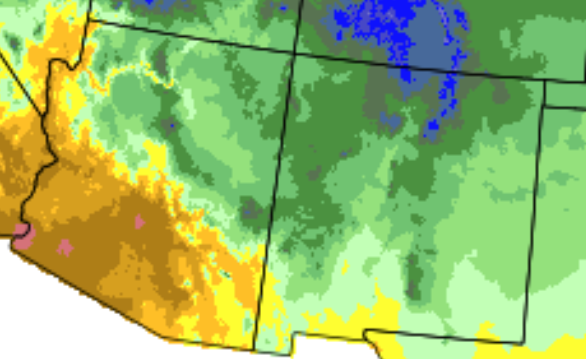
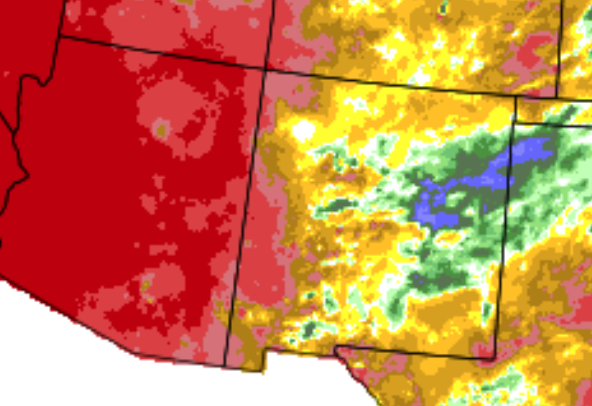
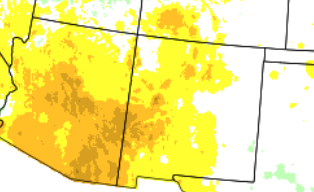
October 2017 produced near to above normal temperatures. Precipitation was below normal in the west, varied in central areas and above normal in the east.
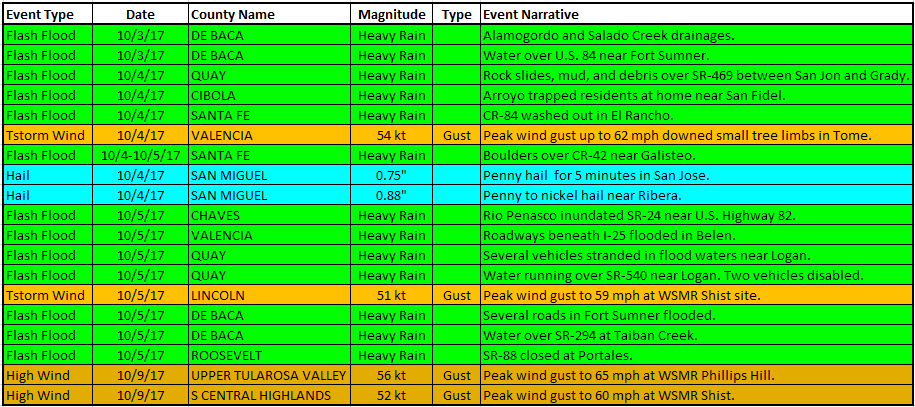
The start of October continued the way late September ended - wet! More heavy rain and flooding occurred on the 4th into the 6th (see table below for sample rain amounts). Dry and seasonable weather ensued on the 7th and 8th. A cool down on the 9th and 10th allowed for the first snowfall of the season over the northern mountains. Amounts were light though, including around 3 inches in Angel Fire. Another warm-up followed for the 11th through 14th with mostly dry conditions. A sharp change to cooler on the 15th was quickly followed by another warming trend with dry conditions on the 16th to 18th. A welcome rain event unfolded on the 19th with widespread showers and thunderstorms. Dry and mostly mild weather embraced New Mexico from the 20th through 25th, with one brief cool down on the 24th. A powerful cold front blasted into the state on the 26th, sending cold air south and west. A little snow fell on the Sangre de Cristo Mountains and northeast highlands. The end of the month was quiet aside from a weak disturbance on Halloween. But only spotty light rain and mountain snow fell.
| Location |
Total Rainfall 4th - 6th (inches) |
| |
|
| Roswell area |
1.76 - 3.16 |
| Logan area |
2.21 - 2.92 |
| Magdalena 7SSW |
2.55 |
| Texico 6S |
2.20 |
| Clovis area |
1.00 - 1.88 |
| Truchas 3ENE |
1.83 |
| Portales |
1.77 |
| Pleasant Hill |
1.74 |
| Alto area |
1.55 - 1.71 |
| Ruidoso area |
0.58 - 1.55 |
| Santa Fe area |
0.24 - 1.50 |
| Abo |
1.28 - 1.40 |
| El Rito 2NW |
1.24 |
| House |
1.06 |
| San Ignacio 2NNE |
1.05 |
| Tucumcari Airport |
1.02 |
| Rio Communities |
1.00 |
Statewide Precipitation and Temperatures
Climate Cities Temperatures and Precipitation
| Albuquerque |
| |
|
There was only 0.04 inches of precipitation measured at the Sunport in October 2017, compared to the normal of 1.02 inches, or 0.98 inches below normal.
The average temperature for Albuquerque in October 2017 was 59.4°, which was 1.9 degrees above the normal of 57.5°.
The average maximum temperature for the month was 72.1°. This was 3.1 degrees above the normal average maximum temperature of 69.0°.
The average minimum temperature for the month was 46.8°. This was 0.7 degrees above the normal average minimum temperature of 46.1 degrees.
Records:
|
| |
| Clayton |
| |
|
There was 1.02 inches of precipitation measured at Clayton in October 2017, or 0.09 inches below the average of 1.11 inches. There was a trace of snow.
The average temperature for Clayton in October 2017 was 54.2°, which was 0.6 below the normal of 54.8°.
The average maximum temperature for the month was 69.1°. This was 0.6 degrees above the normal average maximum temperature of 68.5 degrees.
The average minimum temperature for the month was 39.2°. This was 1.9 degrees below the normal average minimum temperature of 41.1°.
Records: Oct 5 maximum daily rainfall 0.90"
|
| |
| Roswell |
| |
|
There was 1.64 inches of precipitation reported at Roswell during October of 2017, which is 0.41 inches above the normal of 1.23 inches.
The average temperature in Roswell for October 2017 was 62.3°, which is 1.2 degrees above the normal of 61.1 degrees.
The average maximum temperature for the month was 77.1°. This was 1.4 degrees above the average maximum temperature of 75.7 degrees.
The average minimum temperature for the month was 47.6°. This was 1.1 degrees above the normal average minimum temperature of 46.5°
Records: Oct 5 maximum daily rainfall 1.15"
|


.png)
.png)
 Follow us on YouTube