National Weather Service United States Department of Commerce


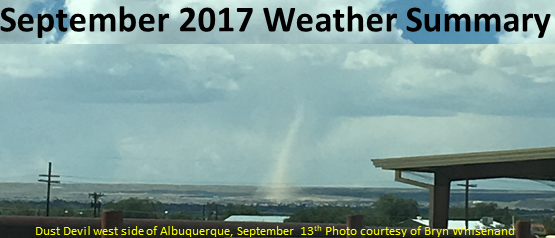
September 2017 Weather Review

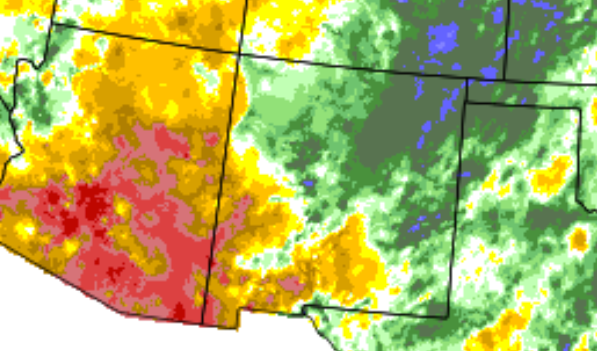
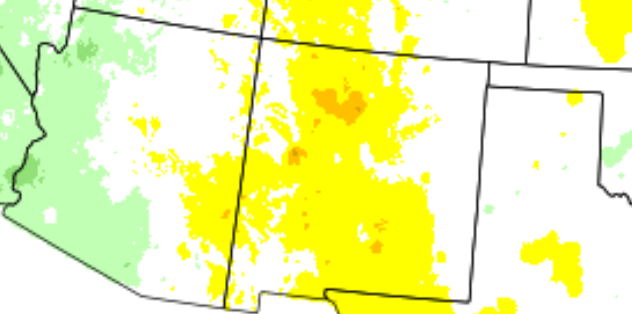
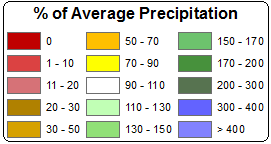
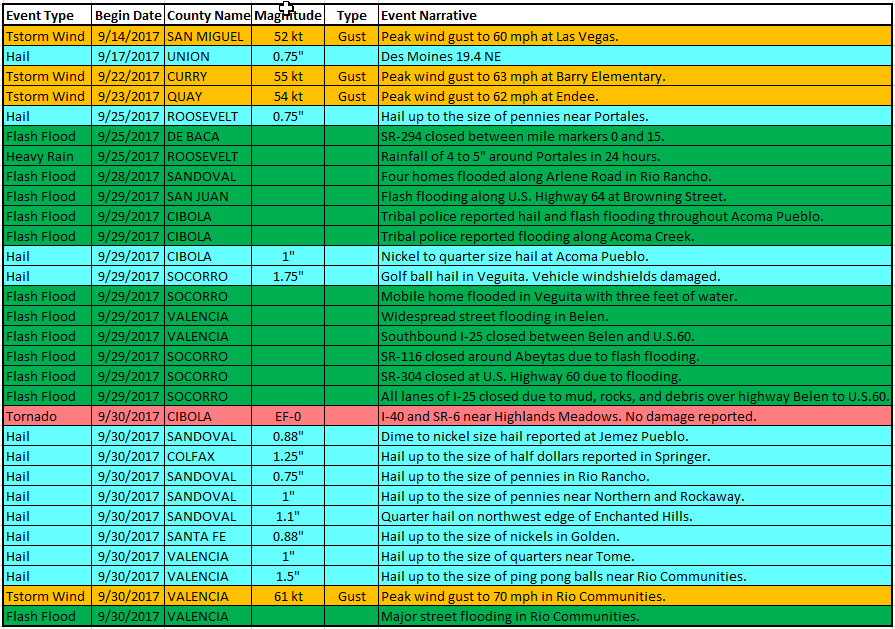
September 2017 was near or warmer than normal, while it was wetter than normal over much of New Mexico, with the exception of the southwest and south central areas. 

September was relatively quiet through the 22nd, with the only reports of severe weather on the 14th, from thunderstorm wind gusts. A deep trough and closed low northwest of New Mexico on the 22nd pulled moisture north from Mexico, producing heavy rain and isolated flash flooding from the 23rd to the 25th. More heavy rain fell from the 27th through the end of the month. Below is a list of the more impressive rainfall totals during the last week of the month. 

Location - Type of Station Rainfall Total Sep 21-30
   
Truchas - RAWS 3.86"
Bandelier NM -Climate Resource Network 3.37
Cimarron - RAWS 3.37
Chama - HADS 3.01
Capulin - Climate Resource Network 3.51
Ribera - Citizen Weather Observer Program 3.57
Las Vegas - ASOS 4.14
Clayton - ASOS 3.61
Sedan - Citizen Weather Observer Program 4.32
Mills Canyon - RAWS 4.91
Campana - Citizen Weather Observer Program 3.47
Los Alamos - Citizen Weather Observer Program 4.02
Cannon AIr Force Base - ASOS 4.35
Clines Corners - ASOS 4.10
Clovis - NM Climate Center 3.67
Clovis - Citizen Weather Observer Program 4.22
Ned Houk State Park - Climate Resource Network 4.17
Dora - West TX Mesonet 3.54
Portales - Citizen Weather Observer Program 4.17
Melrose Gunnery Range - ASOS 3.33
Santa Fe - Citizen Weather Observer Program 4.53
Roswell - Citizen Weather Observer Program 4.19
Tesuque - Citizen Weather Observer Program 3.86
Red River - Citizen Weather Observer Program 3.32


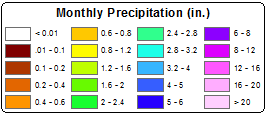
Statewide Precipitation and Temperatures

Statewide Precipitation - Actual Statewide Temperatures - Actual


Statewide Precipitation - Percent Of Normal Statewide Temperatures - Departure From Normal


   Climate Cities Temperatures and Precipitation

Albuquerque
 

There was 2.20 inches of precipitation measured at the Sunport in September 2017, compared to the normal of 1.08 inches, or 1.12 inches above normal.

The average temperature for Albuquerque in September 2017 was 71.4°, which was 2.1 degrees above the normal of 69.3°.

The average maximum temperature for the month was 83.6°. This was 2.9 degrees above the normal average maximum temperature of 80.7°.

The average minimum temperature for the month was 59.3°. This was 1.4 degrees above the normal average minimum temperature of 57.9 degrees.

Records: 27th: Record daily rainfall 0.80"   30th: Record daily rainfall 0.44"

 
 Clayton
 

There was 4.39 inches of precipitation measured at Clayton in September 2017, or 2.72 inches above the average of 1.67 inches. This was the 6th wettest September on record. 8.69 inches of rain fell in September 1941, an incredibly wet month and year across all of New Mexico. 

The average temperature for Clayton in September 2017 was 65.9°, which was 0.1 degrees above the normal of 65.8°.

The average maximum temperature for the month was 78.4°. This was 0.9 degrees below the normal average maximum temperature of 79.3 degrees.

The average minimum temperature for the month was 53.3°. This was 1.0 degrees above the normal average minimum temperature of 52.3°.

Records: 25th: Record daily rainfall 0.75"   26th: Record daily rainfall 0.27"   29th: Record daily rainfall 0.93"

 
 Roswell
 

There was 2.18 inches of precipitation reported at Roswell during September of 2017, which is 0.65 inches above the normal of 1.53 inches.

The average temperature in Roswell for September 2017 was 74.4, which is 2.4 degrees above the normal of 72.0 degrees. 

The average maximum temperature for the month was 88.1°. This was 2.5 degrees above the average maximum temperature of 85.6 degrees.

The average minimum temperature for the month was 60.7°. This was 2.2 degrees above the normal average minimum temperature of 58.5°

Records: 13th: Record daily high 99 deg   21st: Record daily high 98 deg   22nd: Record daily high 97 deg   23rd: Record daily rainfall 1.57"

Severe Weather
Storm reports are considered preliminary until a final review is certified in the NWS Storm Data publication.
Certified data is available three to four months post-event at: https://www.ncdc.noaa.gov/stormevents/