El Niño and the Panhandlesby Chris A. Kimble |
|
El Niño has become an intensely studied and widely publicized phenomenon which has been linked to changes in weather patterns across the United States. Often falsely blamed for crazy weather ranging from flooding and mudslides to snowstorms and tornadoes, in reality its effects are much broader and generalized and can never fully take credit for any one weather event. Its effects on one region may be drastically different than its effects on another region. In this report El Niño will be explained and related to specific trends in weather during the cool season in Amarillo, Texas. |
What is El Niño?The term "El Niño" was originally used to refer to the warming of the Pacific Ocean waters near the east coast of South America near the beginning of each year. The term is Spanish for "The Child" which references the baby Jesus, whose birth is celebrated on Christmas Day which is near the time when the warming of the waters is often noticed. Every few years this annual warming is much more intense and lasts much longer than usual. Gradually the term began to refer to this occasional dramatic warming which impacts a large part of the tropical Eastern Pacific Ocean. Sometimes the opposite situation occurs and the ocean becomes much cooler than normal. When this occurs it is referred to as "La Niña." Meteorologists and climatologists know that the Earth's oceans have a very large impact on the overall atmospheric circulation of the planet. The temperature variations within the oceans and the currents which drive warm water northward and cold water southward have drastic effects on the weather and climate around the globe. Over the past several decades, scientists have linked the warming and cooling of the Eastern Pacific waters during El Niño with changes in the atmospheric circulation particularly in the tropics. These changes are much more dramatic in the winter and spring than other times of year. There are many different ways to measure whether the ocean is in a state of El Niño or La Niña, but the most common is to look at one specific region of the tropical Eastern Pacific Ocean called the Niño 3.4 region. When the average sea surface temperature in this region is at least 0.5 C above normal, El Niño conditions are occurring. Sea surface temperatures at least 0.5 C below normal indicate La Niña conditions are occurring. The further the sea surface temperatures are away from normal, the stronger the El Niño/La Niña event is said to be. |
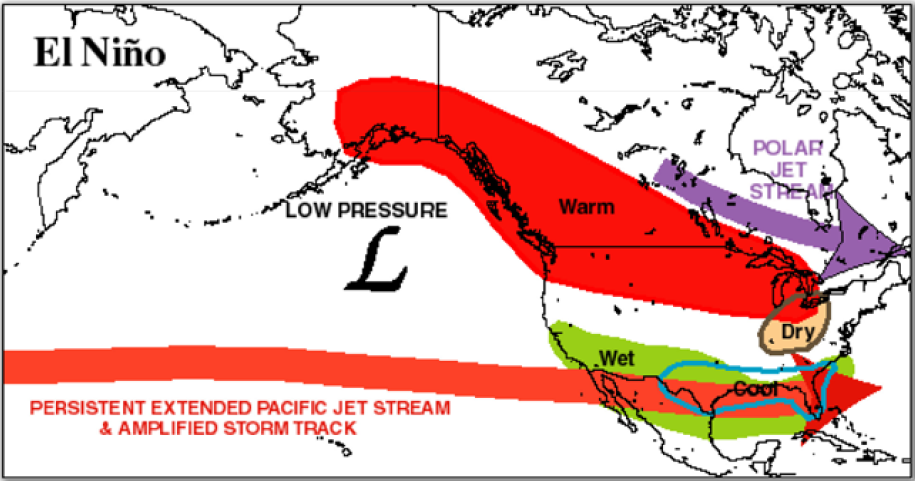
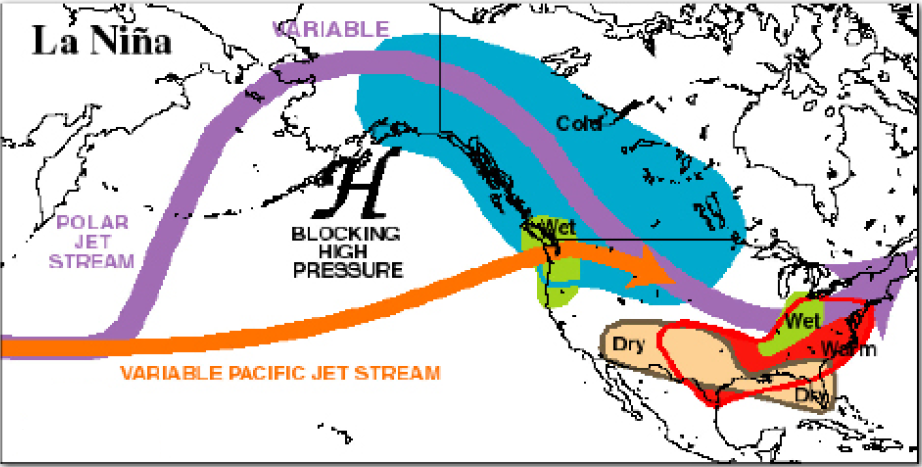
Atmospheric ResponseDuring El Niño the southern jet stream strengthens especially across the eastern Pacific Ocean. This allows more moisture to be transported onshore in the Southwestern United States and generally more storminess across the southern part of the country in general. The northern polar jet stream is shifted northward across the United States, reducing the number of cold outbreaks across the central United States. During La Niña conditions, the jet streams are much more variable and amplified. Generally this means drier and warmer conditions across the southwestern United States. But because the jet stream is amplified, there can be much more frequent cold air outbreaks than what is seen during El Niño. |
|
|
|
|
What about Amarillo?Although it is unwise to contribute any one weather event to El Niño or La Niña, the generalized effects can be seen over an entire season. A detailed analysis of the weather over the past 60 years at Amarillo has been conducted. A comparison was made between temperature and precipitation observations and the status of El Niño/La Niña based on the Niño 3.4 Index. In general, El Niño conditions lead to wetter, snowier conditions in Amarillo and cooler maximum temperatures during the winter. La Niña conditions lead to drier and warmer temperatures overall, with notable extreme cold spells. In stronger El Niño or La Niña episodes, these trends are even greater. For the months of October through April during the 60-year period from 1950 through 2009, observations of temperature and precipitation were grouped according to the state and strength of El Niño or La Niña. To determine how the observations compare to "normal" and to remove any bias associated with decadal or long-term climate change, the observations were subtracted from the average of the ten years surrounding that year. This allows for a more realistic determination of how the temperature and precipitation departed from what would have been expected by locals at that time.
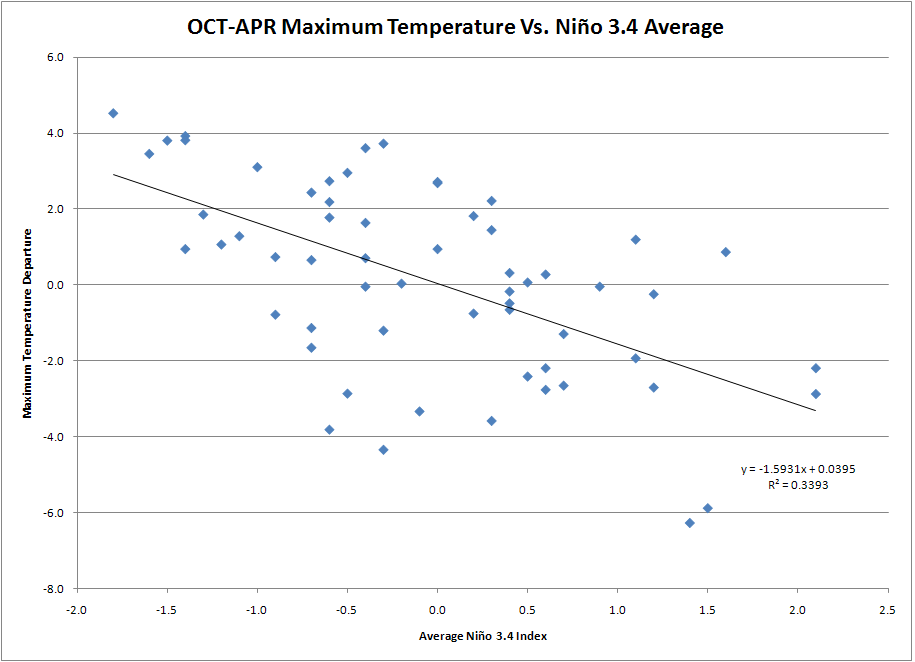
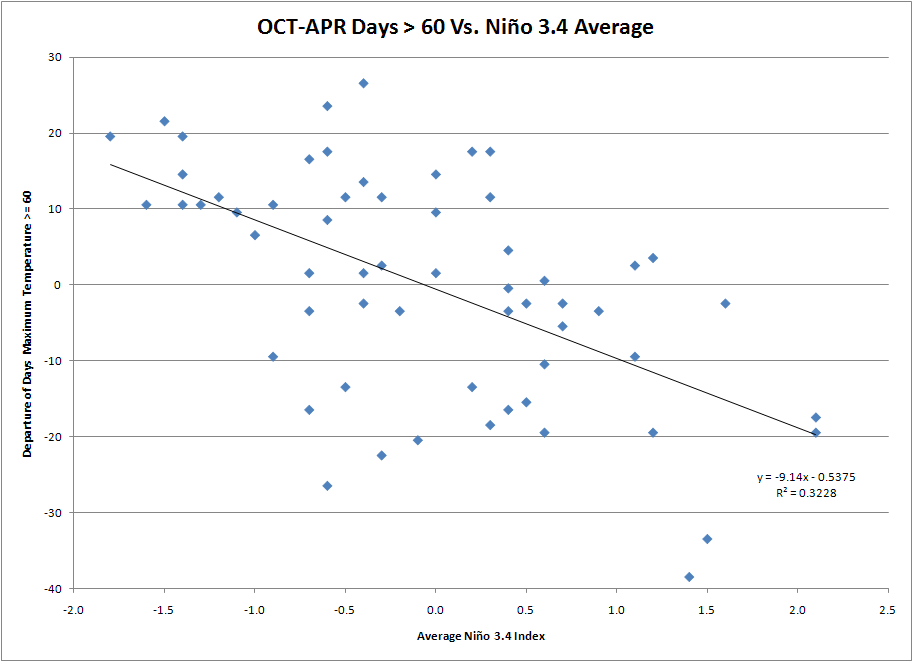
Maximum temperatures show a large negative correlation with the average Niño 3.4 Index in the cool season. When La Niña exists, maximum temperatures are warmer. When El Niño exists, maximum temperatures are cooler. A graph of the data has a best fit trend with a slope of -1.6 indicating that with every 1.0 Celsius increase in Pacific waters there is a decrease in maximum temperatures of about 1.6 degrees. The trend is also visible when comparing the number of days with maximum temperatures of 60 degrees or more. During El Niño, there are much fewer of these warm winter days. During La Niña, there are many more of these warm days. A similar graph of the total 60 degree days indicates a decrease of about 9.1 days per 1.0 Celsius increase in Pacific waters. When conditions in the Pacific are more extreme, the resulting trend in Amarillo is also to see a more extreme departure from normal. The table below displays some statistics on temperatures during various stages of El Niño and La Niña.
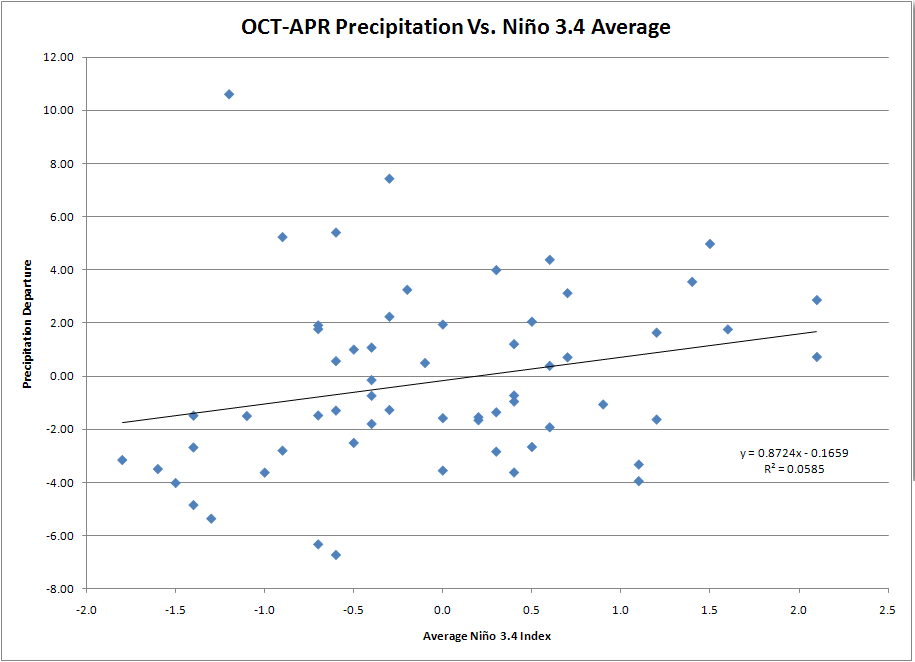
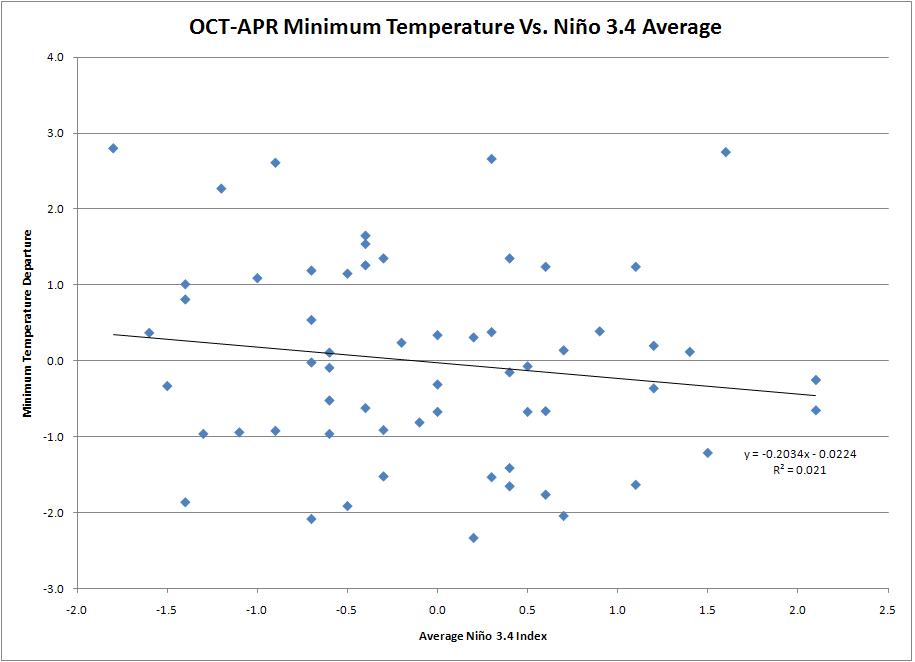
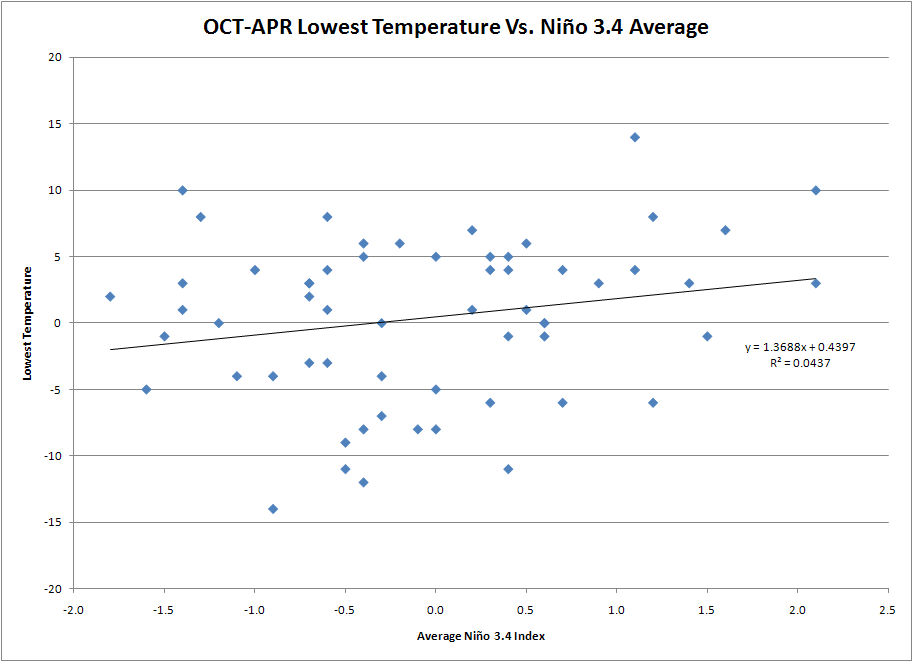
* Departure from normal Minimum temperatures (graph) do not show a significant correlation to El Niño, as the median is within one degree in all categories. There is a noticeable trend, however, when looking at the number of days that the minimum temperature drops into the single digits or below zero. During La Niña it is much more likely to see these extreme cold temperatures despite the generally higher maximum temperatures which also accompany La Niña conditions. A graph of the lowest temperature of the season shows a slight positive trend of about 1.3 Fahrenheit per 1.0 Celsius increase in the Pacific waters. This is a result of the more amplified jet stream which allows for occasional arctic outbreaks and very cold temperatures. Precipitation shows a large positive correlation with the average Niño 3.4 Index in the cool season. When La Niña exists (cold Pacific waters), precipitation drops significantly. During El Niño (warm Pacific waters), precipitation increases significantly. A graph of total precipitation verses Niño 3.4 Index shows the positive correlation. A best fit trend line of the data gives a slope of 0.87 which indicates that with every 1.0 Celsius increase in the Pacific waters there is an increase of about 0.87 inches of precipitation.
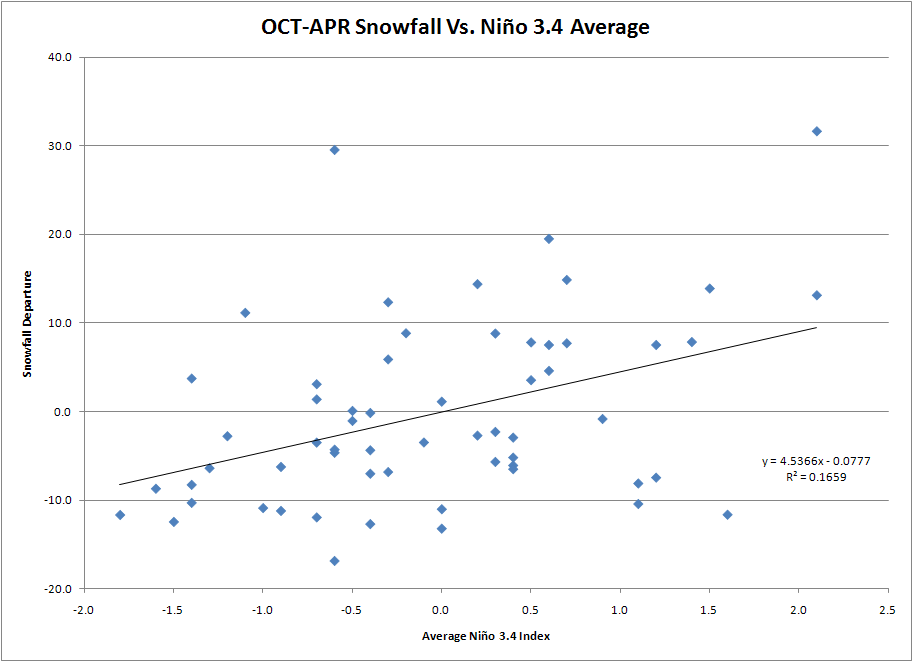
Because most of the winter precipitation in Amarillo falls in the form of snow, the same trends of increased snowfall during El Niño and decreased snowfall during La Niña are also observed. A similar graph of total snowfall verses Niño 3.4 Index also shows the positive correlation. A best fit trend line of the data gives a slope of 4.5, indicating that with every 1.0 Celsius increase in Pacific waters there is an increase of about 4.5 inches of snowfall. Days with measurable snowfall (graph) also increases with the Niño 3.4 Index at a rate of about 2.6 days per 1.0 Celsius increase in Pacific waters. In fact, the total number of days with measurable snowfall is roughly triple during a strong El Niño as compared to a strong La Niña. The table below displays some statistics on precipitation and snowfall during various stages of El Niño and La Niña.
* Departure from normal In the 10 total moderate to strong La Niña events (Niño 3.4 Index of -1.0 or lower), only 1 year recorded above normal precipitation (1998-1999 was 10.60 inches above normal). Only 2 years recorded above normal snowfall (1955-1956 was 3.7 inches above normal and 1970-1971 was 11.1 inches above normal). However, both of these seasons recorded above normal snowfall in large part due to one storm which dropped most of the season's snowfall all at once (14.7 inches in February 1956 and 14.1 inches in February 1971). In all 10 years there were 11 or fewer days with measurable snowfall (average of 7.4 days). Average maximum temperatures were at least 1.0 degrees Fahrenheit above normal in all 10 years. In the 17 total El Niño events (Niño Index of 0.5 or higher), 11 years recorded above normal precipitation and 12 years recorded above normal snowfall. All 17 years had at least 8 days of measurable snowfall (average of 14.6 days). Maximum temperatures were below normal in all but 4 years. |
||||||||||||||||||||||||||||||||||||||||||||||||||||||||||||||||||||||||||||||||||||||||||||||||||||||||||||||||||||||||||||||||||||||||||||||||||||||||||||||||

