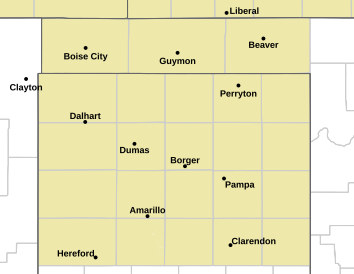
| Current Weather Obs |
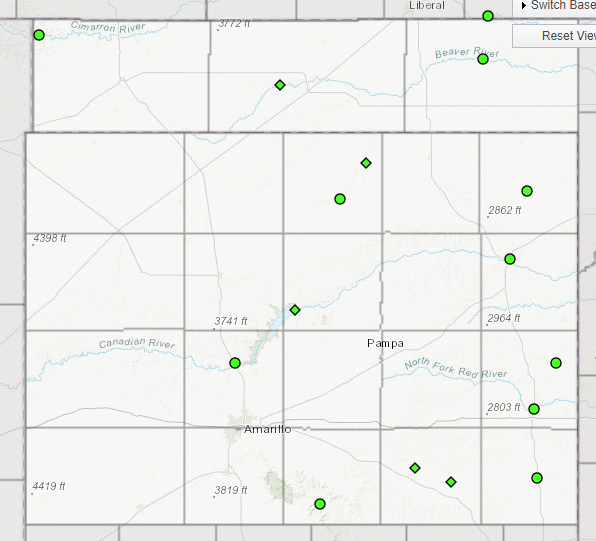
River Observations
|
||||
|
|
|
|||
|
West Texas Mesonet Obs |
Oklahoma Mesonet Obs
Kansas Mesonet Obs |
|||
|
||||
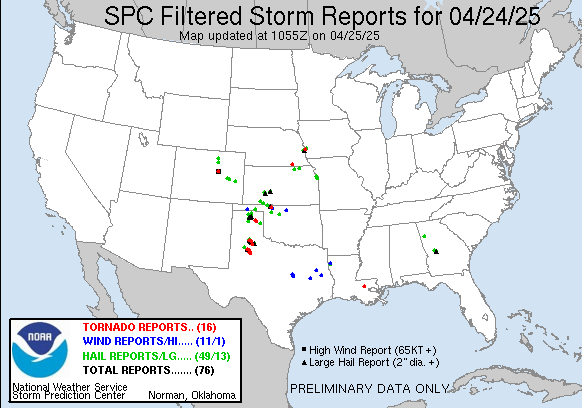
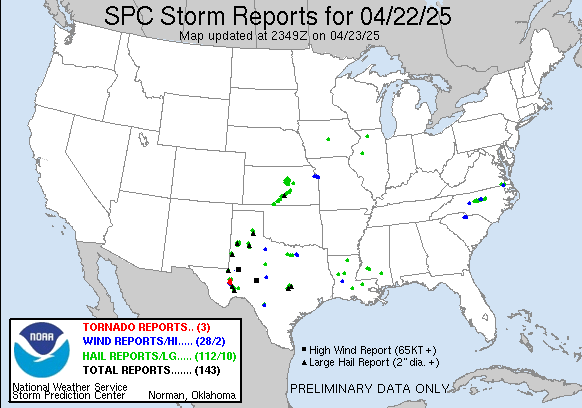
SPC Convective Outlooks |
|
|
Day 1
Watches Mesoscale Discussions
|
Day 2
Day 3
Days 4-8 |
| Heavy Rainfall |
|
|||||
| Climatology | ||||||||||||||||||||||||||
|
||||||||||||||||||||||||||
| Safety | |
|
|