With the recent invasion of arctic air and a few days of dangerously low wind chills, one may wonder how often it gets this cold. The NWS in La Crosse conducted a climatological study of the wind chill frequency to find out.
The study looked at how often dangerous wind chills occurred at 125 locations, from the Rockies to the western Great Lakes, focusing on the winter months (December-February) from 1971-2000. Dangerous wind chills are considered to be -20F or colder, which is when frostbite can occur to exposed skin in less than 30 minutes. Hourly temperatures and winds were used in the study. Further, the data was refined to use hours with winds of 10 mph or greater. Previously, winds of 10 mph or greater were required for most National Weather Service offices to issue Wind Chill Advisories or Warnings. Now, any wind speed which produces a wind chill (4 mph or greater) is required.
In the table below, wind chill frequencies are listed for various thresholds and for many regional sites. The percentages represent the amount of time from December through February that the listed wind chill is observed. For instance, in La Crosse, -20 F or colder wind chills were observed approximately 3% of the time from December to February on average (or about 3% of approximately 2160 hours in the winter season, or 65 hours).
| Location |
Time with wind chills |
Time with wind chills |
Time with wind chills |
| Aberdeen |
7.1% |
2.7% |
0.6% |
| Des Moines |
3.3% |
0.8% |
0.2% |
| Duluth |
9.3% |
4.4% |
1.4% |
| Eau Claire |
3.2% |
1.2% |
0.3% |
| Green Bay |
3.6% |
1.2% |
0.3% |
| International Falls |
7.2% |
3.2% |
1.1% |
| La Crosse |
2.8% |
0.9% |
0.3% |
| Mason City |
7.7% |
3.3% |
0.8% |
| Milwaukee |
2.6% |
0.7% |
0.2% |
| Minneapolis |
4.6% |
1.4% |
0.5% |
| Rochester |
9.5% |
4.2% |
1.3% |
| Sioux Falls |
5.4% |
2.3% |
0.6% |
In the case of -40 F or colder wind chills (again, using a 10 mph or greater wind speed), values across the region are generally about 1/2 percent, or 11 hours per winter.
Below are maps showing graphically the percentage of time with wind chills at a particular threshold (or colder). Note the cold region across North Dakota into northwest Minnesota. That area not only experiences cold temperatures throughout the winter months, but its geography lends itself to higher winds. Both of these factors equate to a higher percentage of time with dangerous wind chills compared to locations farther south or east. Meanwhile, a local maximum is located over southeast Minnesota (specifically, the Rochester Airport). The Rochester Airport is a windy place compared to other locations across southeast Minnesota, resulting in a higher percentage of time with cold wind chills. For this reason, while the data is valid at the airport, it is likely too cold and not representative of the surrounding area.

Image 1 (above): Percentage of observations with wind chills -20 F or colder.

Image 2 (above): Percentage of observations with wind chills -30 F or colder.
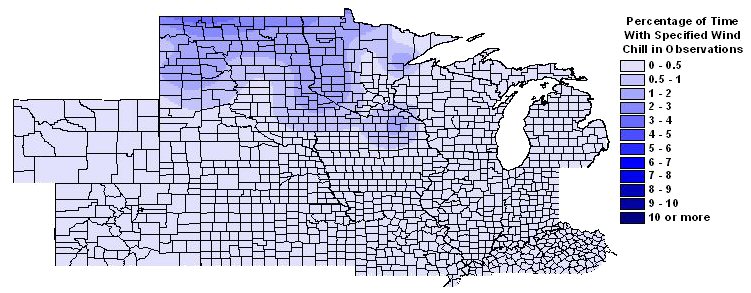
Image 3 (above): Percentage of observations with wind chills -40 F or colder.


 Follow us on YouTube