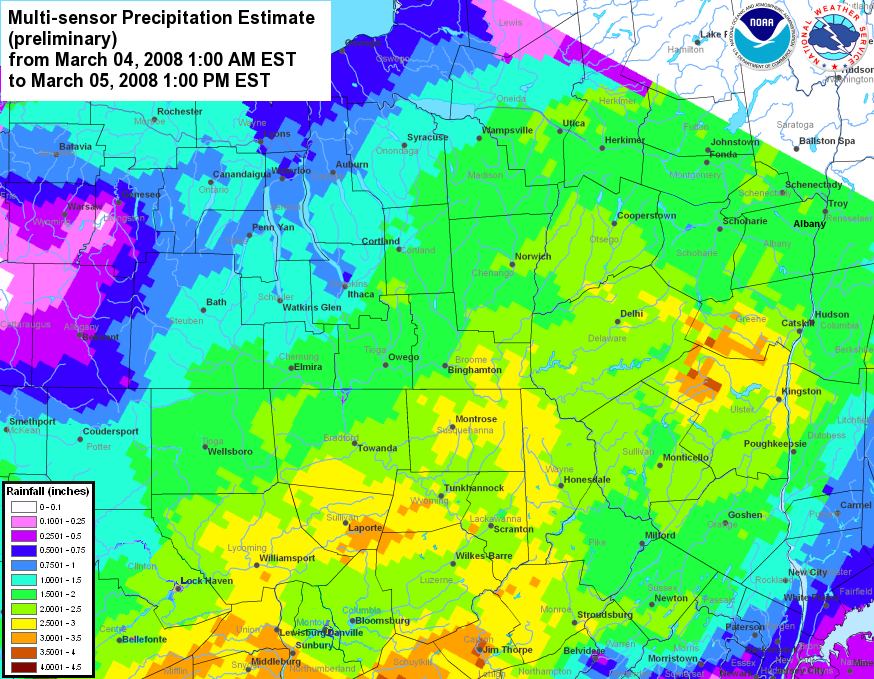
The MPE graphic shown in this section are Multisensor Precipitation Estimates, otherwise known as MPE data. The data used to produce this graphic is a combination of radar and precipitation gages. Source: Middle Atlantic River Forecast Center.
When using MPE data, it is important to remember it is vulnerable to the same inaccuracies that can be caused by either radar or precipitation gages. For radar, problems would be: freezing or frozen precipitation, low topped convection, bright banding, the reflectivity/rainfall relationship in use, calibration of the radar, radar location and elevation, range degradation, and the radar's effective coverage. For precipitation gages, problems come from freezing precipitation, windy conditions, gage siting, undermeasurement by tipping bucket gages in high intensity rainfall, and gage maintenance.
The following table contains some observed amounts from 8 AM EST March 4th, 2008 to March 6th, 2008.
New York
Location
Amount
Addison
1.17
Adrian
0.58
Altamont 2.7 SSW
2.6
Apalachin 3.0 ESE
1.64
Arnot Forest
1.3
Auburn
0.84
Aurora 2.8 ESE
0.8
Averill Park 0.9 WNW
2.25
Avoca 3.5 N
0.7
Avoca 5.0 SSW
0.81
Bath Observer
0.92
Bethpage 0.9 NNW
0.38
Big Flats 2.0 W
1.5
Big Shiney Mtn
1.84
Binghamton
1.69
Binghamton 1.8 SW
1.79
Bisby Gatehouse at ALC
1.23
Bloomingburg
2.3
Boonville
1.63
Brewerton Blo Lock 23
1.1
Buffalo 1.5 S
0.99
Candor 3.3 NE
1.97
Canisteo 0.4 SSW
0.5
Canisteo 7.0 ENE
0.84
Carmel Hamlet 5.8 N
1.41
Catlin
1.12
Caton 2.8 SSW
1.6
Cayuga 3.2 ESE
0.73
Chemung
1.97
Chestnut Ridge 0.3 SSW
1
Cincinnatus
1.52
Cobleskill 5.7 W
1.91
Cooperstown
1.99
Cooperstown Golf Course Rain Gage
1.71
Corning Observer
1.62
De Witt 1.4 WSW
1.03
Delanson 2.5 NNE
2.13
Delhi
2.28
Delhi 1.5 NNE
2.01
Delhi 5.0 ESE
1.82
Deposit
2.07
Elma 3.5 NE
0.45
Elmira 1.3 ESE
1.64
Elmira 3.2 E
1.79
Elmira Airport
1.21
Elmira Observer
1.58
Endicott 5.2 SSE
1.63
Erin
2.16
Freeville 1.5 NE
1.39
Greene 1.2 ESE
1.58
Griffiss Afb
1.3
Groton 0.5 NW
1.31
Hammondsport 2.9 ENE
0.8
Hancock 10.5 SE
1.86
Hartsville
0.8
Holland Patent 1.5 WSW
1.15
Hornell Almond Dam
0.77
Horseheads 1.5 SSE
1.49
Hudson 8.2 S
2.38
Kattelville 1.0 ESE
1.63
Kenmore 2.7 E
1.71
Kingston 1.1 W
2.97
Lacona 3.6 SSE
1.31
Lansing 8.9 N
1.19
Locke
1.12
Margaretville 1.7 ENE
1.78
Middle Island 0.8 ESE
0.25
Monticello
1.86
Morris
2.03
Morrisville
1.59
Newark Valley
2.1
North Brookfield
1.29
North Tonawanda 1.0 NNE
0.91
Norwich
1.98
Oakfield 6.5 WNW
0.92
Oneida 0.7 NNE
1.25
Oneonta
2.76
Oswego 5.0 ESE
0.95
Otisville 0.6 WNW
2.2
Penn Yan
0.6
Phoenix 2.9 SE
1.11
Point Rock 0.6 SE
1.45
Richfield Springs 0.5 ESE
1.79
Riverhead 1.3 SSE
0.31
Rosendale Village 2.4 NNE
2.81
Saratoga Springs 2.0 WSW
2.36
Sherburne
1.69
Sidney 2.1 NE
1.9
Smith Valley 1.9 SE
1.39
Southport 3.8 SSW
1.82
Stamford 0.7 NNW
1.51
Syracuse
0.91
Tonawanda 0.5 ENE
0.94
Troy
2
Troy
1.83
Tuscarora
1
Unadilla 7.2 N
2.28
Van Etten 0.3 ENE
1.62
Vernon 0.4 NNW
1.07
Vestal 2.8 SSE
1.89
Walton
2.21
Whitesboro 3.9 NE
0.95
Whitney Point 1.7 SSE
1.94
Whitney Point Dam
2.03
Willet 1.8 E
1.91
Woodridge 5.5 S
2.37
Woodstock 1.4 SSE
2.91
Pennsylvania
Location
Amount
Abbottstown 2.4 N
2.22
Adamstown 2.5 SSE
0.88
Aldenville
2.7
Allentown 4.2 W
2.21
Aylesworth
1.86
Bala Cynwyd 1.15 NNW
0.79
Bellefonte 4.3 E
2.78
Bernville 1.3 SW
2.14
Blue Bell 2.3 NW
0.97
Boalsburg 1.0 NNW
2.7
Bowmanstown 3.0 WSW
3.21
Bridgeville 1.4 SW
1.46
Buckhorn Ridge
2.04
Burnham 1.1 N
3.09
Canton
2.17
Canton
2.08
Chapman 6.6 NW
2.87
Collegeville 2.2 N
0.59
Collegeville 3.0 NE
0.81
Columbia Crossroads
2.12
Conyngham 3.9 NE
2.76
Dauphin 3.3 W
3.4
Dingmans Ferry 3.9 WSW
2.57
Dover 4.2 WSW
2.13
Dreher
2.04
East Smithfield
1.76
Edella
1.6
Edgemere
1.96
Eldred 5.1 W
0.26
Equinunk
2.05
Erie 5.6 SW
1.11
Everett 3.8 SW
2.16
Everett 4.1 S
2.47
Franklindale
2.64
Friendsville 6.8 NE
1.98
Germantown
1.68
Gilbertsville 0.9 S
1.12
Greencastle 0.3 SSE
2.56
Greentown
2.6
Harleysville 2.1 SW
0.75
Harveys Lake 7.7 SW
1.35
Hatfield 0.1 SSW
1.06
Hawley 3.8 NE
2.16
High Knob
1.72
Honesdale
2.38
Honesdale 2.4 NW
2.37
Hop Bottom
2.2
Hugo Corners
2.76
Hummelstown 0.6 ESE
3
Jim Thorpe 1.1 NNE
3.03
Jim Thorpe 1.1 NNW
3.08
Kulpsville 2.6 SSW
0.86
Lansdale 1.9 SW
1.08
Latrobe 0.6 NW
0.19
Lawton
2.1
Le Raysville
2.4
Lebanon 1.1 S
2.79
Lehighton 3.3 WSW
2.61
Litchfield
1.72
Marysville 5.1 WSW
3.45
Merli-Sarnowski
1.76
Mifflinburg 1.4 WNW
2.81
Milanville 1.5 SE
2.09
Monroeton
2.15
Montrose
2.1
Montrose 4.5 S
2.3
Moscow
2.43
Moscow
1.84
Moscow 2.6 N
2.25
Moscow 5.7 SE
2
Muncy 0.5 SSE
3.07
Nazareth 2.2 N
2.1
Nescopeck Pass
1.76
Newburg 0.5 WSW
3.4
Newry 1.9 SSE
1.54
North Wales 1.3 WSW
1.12
Noxen
2.65
Oreland 0.3 WNW
0.85
Orwell
1.73
Orwigsburg 1.9 W
3.43
Palmerton 3.9 NE
2.57
Palmerton 5.8 ENE
2.95
Paxtonia 1.7 E
3.57
Penn Hills 1.5 E
1.01
Pennsburg 3.0 ENE
1.3
Philadelphia 4.7 NE
1.05
Pleasant Mount
2.1
Port Matilda 5.8 E
2.14
Port Matilda 6.4 ENE
2.14
Pottstown 0.6 SE
0.73
Pottstown 2.0 NNE
0.9
Pottsville 1.3 WSW
3.5
Prompton
2.52
Prompton Dam
2.45
Rainsburg 9.0 S
2.12
Rainsburg 9.0 SSE
3.09
Ramblewood 3.7 WNW
2.5
Reading 1.2 SW
1.22
Reining Pond
2.44
Rileyville
1.8
Rockledge 1.3 SE
0.94
Roseville 6.0 ENE
1.88
Schellsburg 2.6 WNW
1.32
Schnecksville 2.7 SW
1.82
Shehawken Lake
1.88
Shickshinny
2.47
Shiloh 1.2 W
2.29
Shrewsbury 1.3 SSE
1.1
Souderton 0.6 NNW
1.06
Souderton 1.6 SSW
0.97
Spring Mount 1.3 N
1
St. Marys 1.7 SE
1.25
Stanfordville 0.4 SE
1.99
Starrucca 0.9 WSW
2.01
State College 0.4 SE
2.51
State College 2.4 ENE
2.43
State College 2.6 NW
2.24
Stillwater Dam
1.64
Stoddartsville
3.05
Stroudsburg 4.0 W
3.25
Thompson 3.9 WNW
2.06
Tobyhanna 11.1 NE
3.11
Towanda
2.12
Towanda 4.6 NNE
1.96
Tunkhannock
2.65
Upper St. Clair 1.7 W
1.37
Valley Green 0.8 ENE
3.09
Wcdl Radio Tower
2.16
Weatherly 1.1 W
3.33
Wellsboro 6.5 W
2.23
West Hazelton
1.08
West Hazleton 3.2 NNE
2.99
West Lawn 0.8 S
1.48
Westfield 3.7 S
1.39
Westmont 1.1 W
1.33
Wolfdale 3.3 WNW
1.3
Wyalusing 2.8 SSW
1.27
A cold front moved across the region during the day Tuesday, March 4th. The cold front stalled over parts of southern Pennsylvania late Tuesday night due to an upper level storm approaching the region from the west. Warm, moist air lifted up and northward across parts of northeast Pennsylvania and central New York through out this time. This produced a mixture of precipitation types, rain, freezing rain, sleet and snow across the area. Some locations received 2 to 3 inches of rainfall. The combination of snow melt and the heavy rainfall lead to flooding on some of the rivers across parts of central New York and northeast Pennsylvania.
As the upper level system moved across the area during morning of March 5th it's surface reflection, an area of low pressure, moved across parts of Pennsylvania and New York ending the significant precipitation across the area.
Surface Charts March 05, 2008
Below is a video containing a mosaic of National Weather Service radars across parts of the northeast. The loop start on March 04, 2008 at 1258 AM EST and ends on March 05, 2015 at 108 PM EST. Note how the precipitation stays across most parts of Central New York and Northeast Pennsylvania.


 Follow us on YouTube