 |
|
Overview
An extremely cold arctic airmass made its effects felt across Central Alabama beginning on the night of January 5th with the passage of an arctic cold front. Temperatures fell by almost 30 degrees in a span of 4-6 hours behind the cold front, changing the light rain to a wintry mix of precipitation for a short duration. There were many reports of sleet and light snow reported across the northern half of Central Alabama on the evening of Jan 5th. Howling northwesterly winds also accompanied the arctic airmass with sustained winds of 20-25 mph and gusts upwards to 40 mph at times. Temperatures struggled to reach the upper teens across the northern counties to the upper 20s across the southern counties on the afternoon of January 6th, with wind chills below zero for counties along and north of Interstate 20. The bone-chilling cold arrived on the morning of January 7th, with low temperatures reported near zero across northern counties to the lower teens across the south. Record minimum temperatures were broken across the board for every climate site in Central Alabama.
|
|
Daily Climate Records
|
New Record Minimum Temperatures
|
| Date |
Location |
Temperature (°F) |
Previous Record |
| Jan 6 |
Anniston |
13 |
14 (1959, 2010) |
| Jan 7 |
Birmingham |
7 |
11 (1970) |
| Jan 7 |
Montgomery |
13 |
15 (1970) |
| Jan 7 |
Tuscaloosa |
9 |
13 (1970) |
| Jan 7 |
Anniston |
8 |
11 (1970) |
|
|
New Record Low Maximum Temperatures
|
| Date |
Location |
Temperature (°F) |
Previous Record |
| Jan 6 |
Tuscaloosa |
30 |
33 (1988) |
|
|
Observations
|
Observed Max/Min Temperatures
|
| |
Jan 6th |
Jan 7th |
| Location |
Max/Min (°F) |
Max/Min (°F) |
| Birmingham |
30/11 |
24/7 |
| Montgomery |
41/18 |
30/13 |
| Tuscaloosa |
30/14 |
28/9 |
| Anniston |
35/13 |
25/8 |
*Note: The maximum temperatures on Jan 6th were actually observed between 12:00am and 12:30am early that morning.
|
|
Consecutive Hours < 32°F
|
| Location |
# of Hours |
Time Period |
| Birmingham |
59 |
11pm on 1/5 - 10am on 1/8 |
| Montgomery |
55 |
3am on 1/6 - 10am on 1/8 |
| Tuscaloosa |
59 |
11pm on 1/5 - 10am on 1/8 |
| Anniston |
57 |
1am on 1/6 - 10am on 1/8 |
|
|
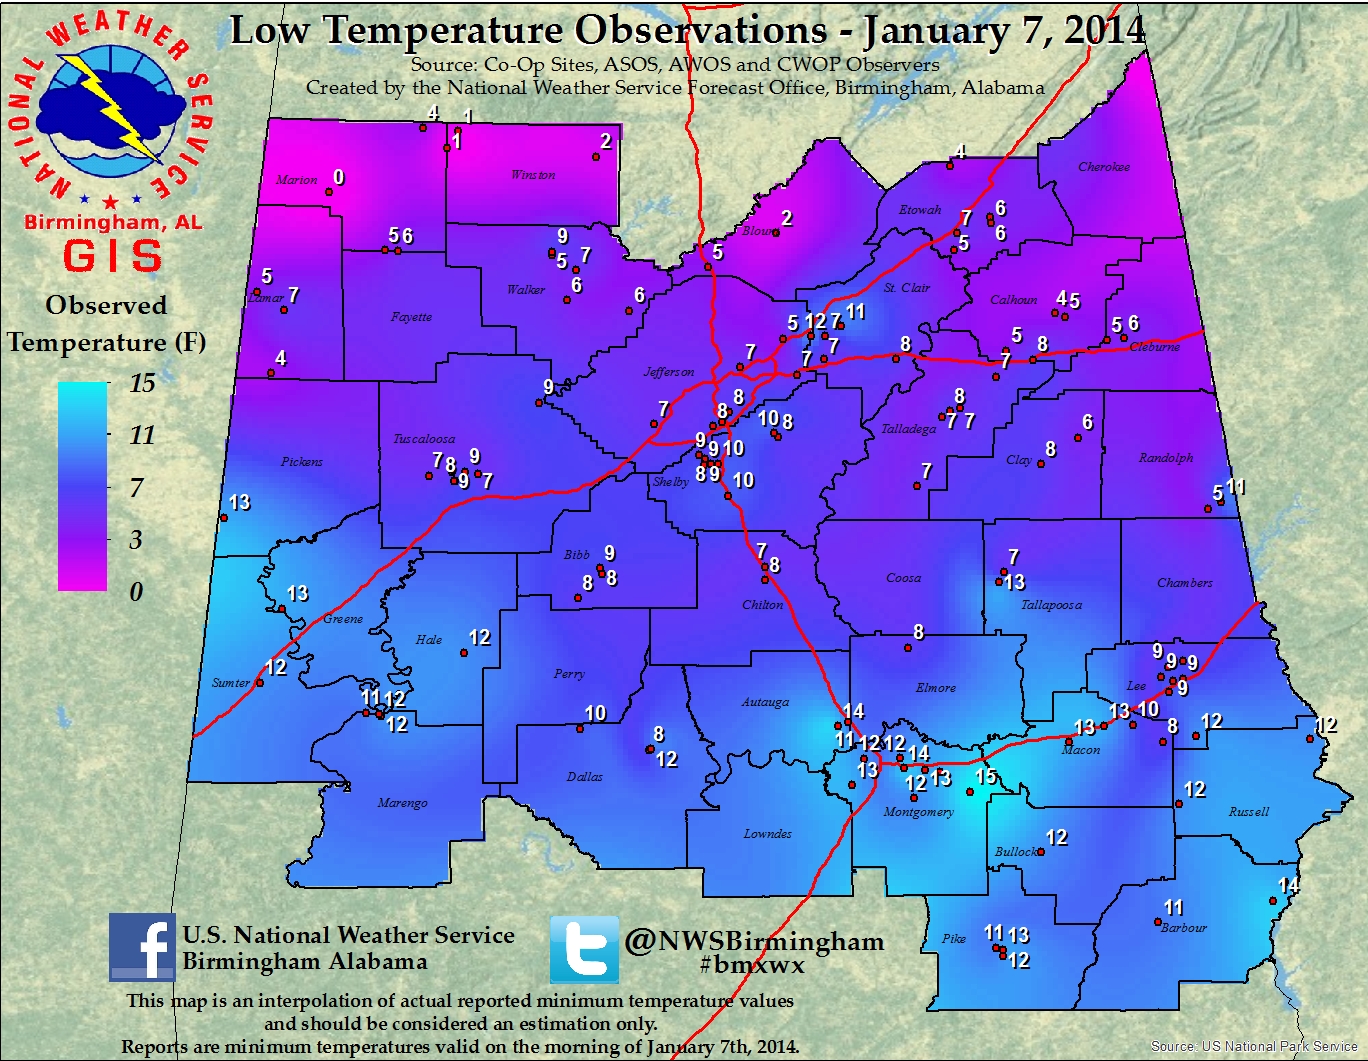
Map of Lowest Temperatures
The coldest temperatures of the event were recorded on the morning of January 7th. The map below depicts the observed low temperatures for locations across Central Alabama.
|
|
Fast Facts
- First time Birmingham and Anniston observed a minimum temperature < 10°F since Jan 24, 2003.
- First time Tuscaloosa observed a minimum temperature < 10°F since Dec 24, 1989*. (*Tuscaloosa's records are missing for several years in the 1990s, so it's possible that the actual date could be sooner.)
- First time Birmingham observed a maximum temperature < 25°F since Feb 4, 1996.
- First time Anniston observed a maximum temperature < 25°F since Jan 10, 2010.
|
|
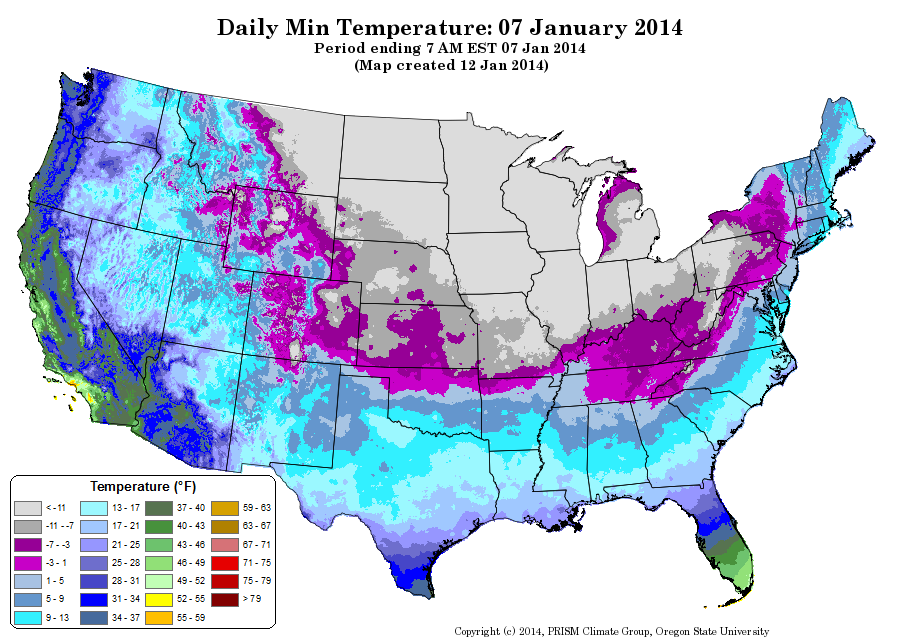
Nationwide Temperature Map
Image is courtesy of the PRISM Climate Group at Oregon State University.
|
|


 Follow us on YouTube