August 2001 Floods
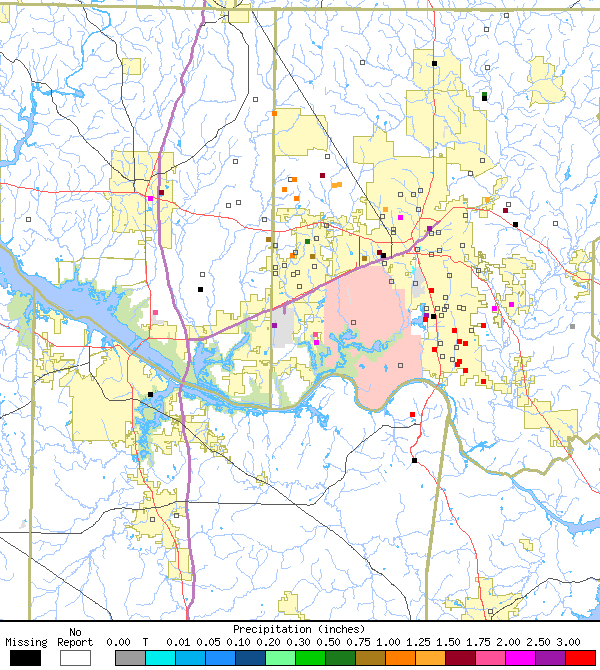
The following table shows rainfall amounts for some locations across the affected area. The rainfall data is comprised of Cooperative Observers, TVA/USGS automated gages, and the Cooperative Huntsville Area Rainfall Measurements or CHARM. Period 1 shows the rainfall from 7:00 am on the 9th, to 7:00 am on the 10th. Period 2 shows the rainfall from 7:00 am on 10th ending at 7:00 am on the 11th. The last column shows the two day total.
NOTE: Although the reports listed are a 24 hour total, the brunt of the rainfall during this event occurred on the morning of August 10th, roughly from 3:00 am to 10:00 am. Please note that site 39 rainfall measurement was 11:00 am on August 9th to 11:00 am on the 10th.
| Cooperative Observers and TVA/USGS Data | |||
|---|---|---|---|
| Site | Period 1, ending 10th | Period 2 ending 11th | 2 day total |
| Albertville | 0.00 | 4.72 | 4.72 |
| Aldridge Creek near Farley | 0.49 | 3.70 | 4.19 |
| Aldridge Creek at Toney | 0.00 | 5.23 | 5.23 |
| Athens | 0.00 | 2.25 | 2.25 |
| Boaz | 1.77 | 1.26 | 3.03 |
| Broglan Branch in Huntsville | 0.00 | 5.24 | 5.24 |
| Danville | 0.01 | 2.48 | 2.49 |
| Falkville | 0.01 | 4.27 | 4.28 |
| Guntersville | 0.10 | 4.29 | 4.39 |
| Hytop | 1.45 | 4.60 | 6.05 |
| Lim Rock | 0.28 | 2.96 | 3.24 |
| Pinhook Creek at Mastin Lake | 0.00 | 5.72 | 5.72 |
| Pinhook Creek in Huntsville | 0.00 | 5.28 | 5.28 |
| West Fork Pinhook Creek in Hunstville | 0.48 | 6.00 | 6.48 |
| Rainsville | 0.32 | 2.29 | 2.61 |
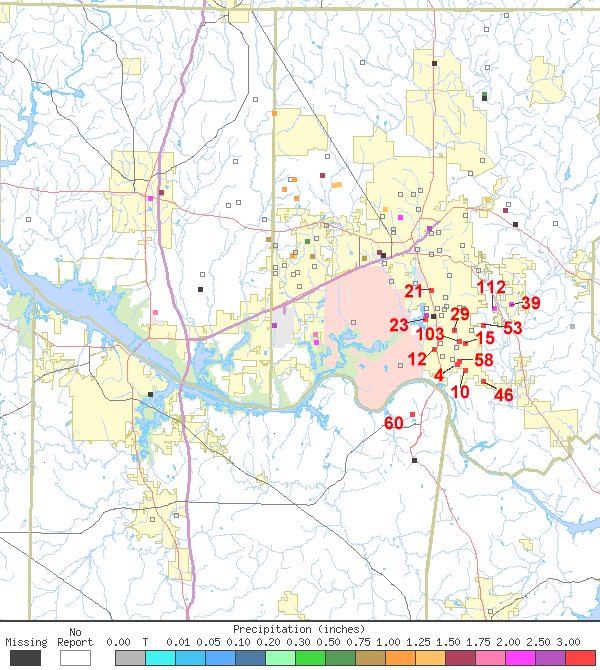
| Charm rainfall network | |||
| 4 | 1.62 | 3.98 | 5.60 |
| 10 | 1.61 | 5.06 | 6.67 |
| 12 | 0.63 | 5.45 | 6.08 |
| 15 | 2.26 | 3.30 | 5.56 |
| 21 | 0.02 | 3.17 | 3.19 |
| 23 | 0.21 | 3.17 | 3.38 |
| 29 | 0.11 | 3.72 | 3.83 |
| 39* | 4.75 | 2.07 | 6.82 |
| 46 | 1.40 | 3.25 | 4.65 |
| 53 | 1.44 | 3.47 | 4.91 |
| 58 | 1.68 | 4.57 | 6.25 |
| 60 | 1.33 | 8.25 | 9.58 |
| 103 | 0.76 | 3.48 | 4.24 |
| 112 | 0.8 | 2.02 | 2.82 |


 Follow us on YouTube