Remnants of Tropical Storm Lee affect Central Alabama
The remnants of Tropical Storm Lee slowly moved across Central Alabama Sunday, September 4th through Tuesday, September 6th. Several locations received beneficial rainfall; however, very heavy rainfall for an extended amount of time across northern portions of the state caused significant flash flooding, as well as river flooding. The significant flash flooding occurred throughout the Birmingham metro area. As a result, several high water rescues were performed. Numerous roadways were impassible, and 13 counties in the Birmingham county warning area suffered some sort of flash flooding. Rainfall amounts were considerably lower across the southeastern portions of the state, where drought conditions will improve slightly, but not enough to end the long-term drought that is currently in place.
In addition to the heavy rainfall and flooding, there were strong, widespread gusty winds which downed trees across many counties in North Central Alabama. There were two confirmed tornadoes. Below are links the write ups for the tornadoes and other additional data from the remnants of Tropical Storm Lee:
Peak Wind Gusts
The following tables list measured peak wind gusts at various locations around Central Alabama on September 5th.
Unofficial (Public) Observations:
| County | Location | Max Gusts |
| Jefferson | 3 W Birmingham | 63.5 |
| Jefferson | Center Point | 55 |
| Jefferson | Bessemer | 55 |
| Shelby | Chelsea | 55 |
| Blount | Straight Mountain | 53 |
| Tuscaloosa | Coaling | 51 |
| Jefferson | Trussville | 50 |
| Tuscaloosa | Northport | 50 |
| Dallas | Millers Ferry | 47 |
| Etowah | Hokes Bluff | 46 |
| Jefferson | Hoover | 45 |
| Cherokee | Cedar Bluff | 44 |
| Jefferson | Hueytown | 40 |
| Jefferson | Mountain Brook | 35 |
Official ASOS/AWOS Observations:
| County | Location | Max Gust |
| Jefferson | Birmingham (BHM) | 48 |
| Shelby | Calera (EET) | 48 |
| Calhoun | Anniston (ANB) | 44 |
| Pike | Troy (TOI) | 43 |
| Tuscaloosa | Tuscaloosa (TCL) | 43 |
| Montgomery | Montgomery (MGM) | 40 |
| Lee | Auburn (AUO) | 38 |
Storm Total Rainfall Estimates

Storm Total Rainfall Estimate
|
|||||||||
Satellite Data

Satellite Image of Tropical Storm Lee over the Gulf of Mexico
Analysis, Charts, and Outlooks


Surface Analysis Surface Analysis Surface Analysis
September 5th 7 AM CDT September 5th 1 PM CDT September 5th 7 PM CDT

500 MB Chart Day 1 Severe Weather Outlook Day 1 Severe Weather Outlook
September 5th at 7 AM CDT Issued September 5th at 757 AM CDT Issued September 5th at 245 PM CDT
National Summaries of Lee and the 2011 Season
 Tropical Cyclone Report for Lee from NHC
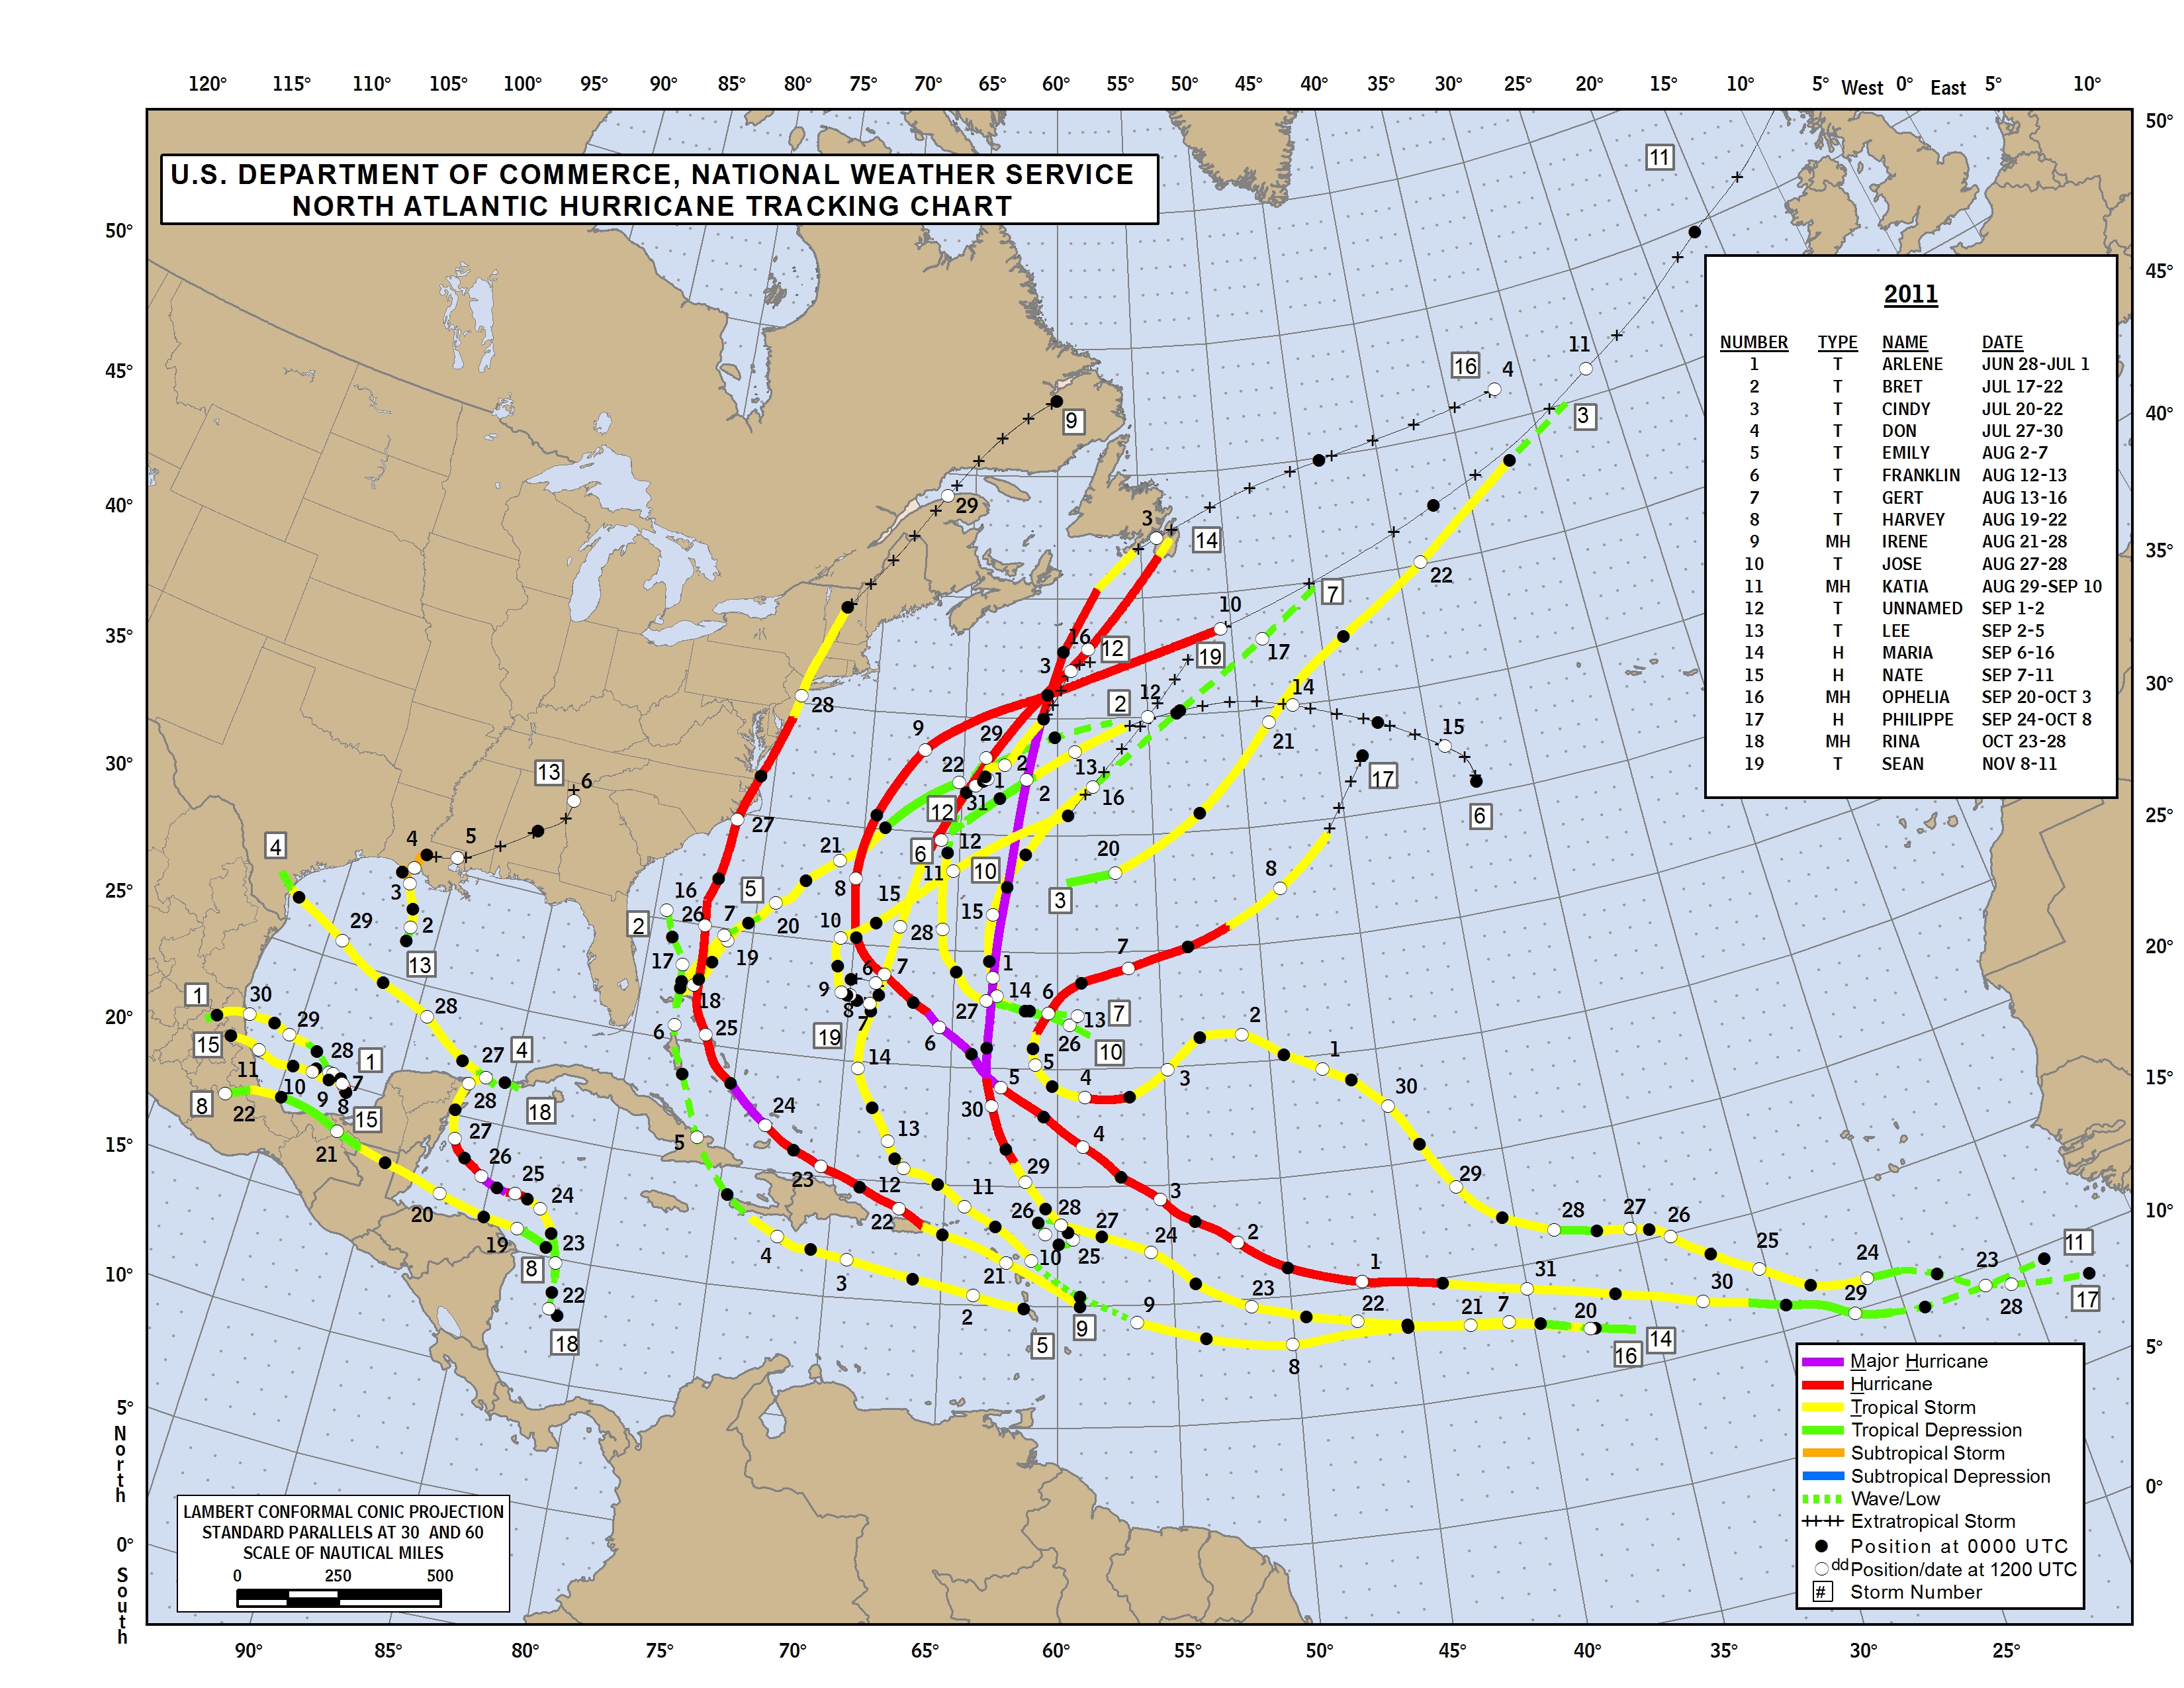
2011 Atlantic Tropical Season Graphic from NHC
Tropical Storm Lee Rainfall Information from WPC
NOAA Extreme Weather - Tropical Storm Lee
Summaries from Nearby Weather Forecast Offices


 Follow us on YouTube