|
Overview
The 2012 Atlantic Hurricane Season might be best termed the "Dr. Jekyll and Mr. Hyde" of hurricane seasons. The season began ominously, with two named cyclones (Alberto and Beryl) along the southeast U.S. coast by the end of Memorial Day weekend, and another two systems, including the season’s first hurricane (Chris) by the end of June. The season settled into the typical July lull, before ratcheting up again in August and September, with ten named storms, including 7 hurricanes. Nearly every cyclone during this period was either short lived (five days or less), or longer lived with frequent struggles to gain or maintain strength. In fact, only one of these cyclones was able to attain major status, as defined by the Saffir Simpson Hurricane Wind Scale (SSHWS); Michael reached Category 3 strength for less than 12 hours on September 6th. Hurricane Isaac (August 28/29) became the first landfalling hurricane of the season, barely attaining Category 1 strength on the SSHWS. However, Isaac’s impacts from storm surge flooding through multiple high tide cycles, long duration 40 to 70 mph winds on increasing saturated soils would belie the wind category to the tune of $2 billion (preliminary) in property damage and seven fatalities. Isaac’s poor SSHWS–to–damage ratio would be "Super" magnified two months later. Isaac closed the door on the Gulf of Mexico season, and through much of September and October, cyclones developed meekly in the open Atlantic ocean and recurved away from the U.S. Until Sandy came along. See the box at right for a brief summary of Sandy. Click here for a time lapse video of satellite images for the 2012 season. Even with Sandy in the mix, the 2012 Atlantic Hurricane Season Accumulated Cylcone Energy (ACE) Index was relatively low for a season with many named storms, and nearly identical to 2011 (123 vs. 119, preliminary value).
Rio Grande Valley: Zeroed Out
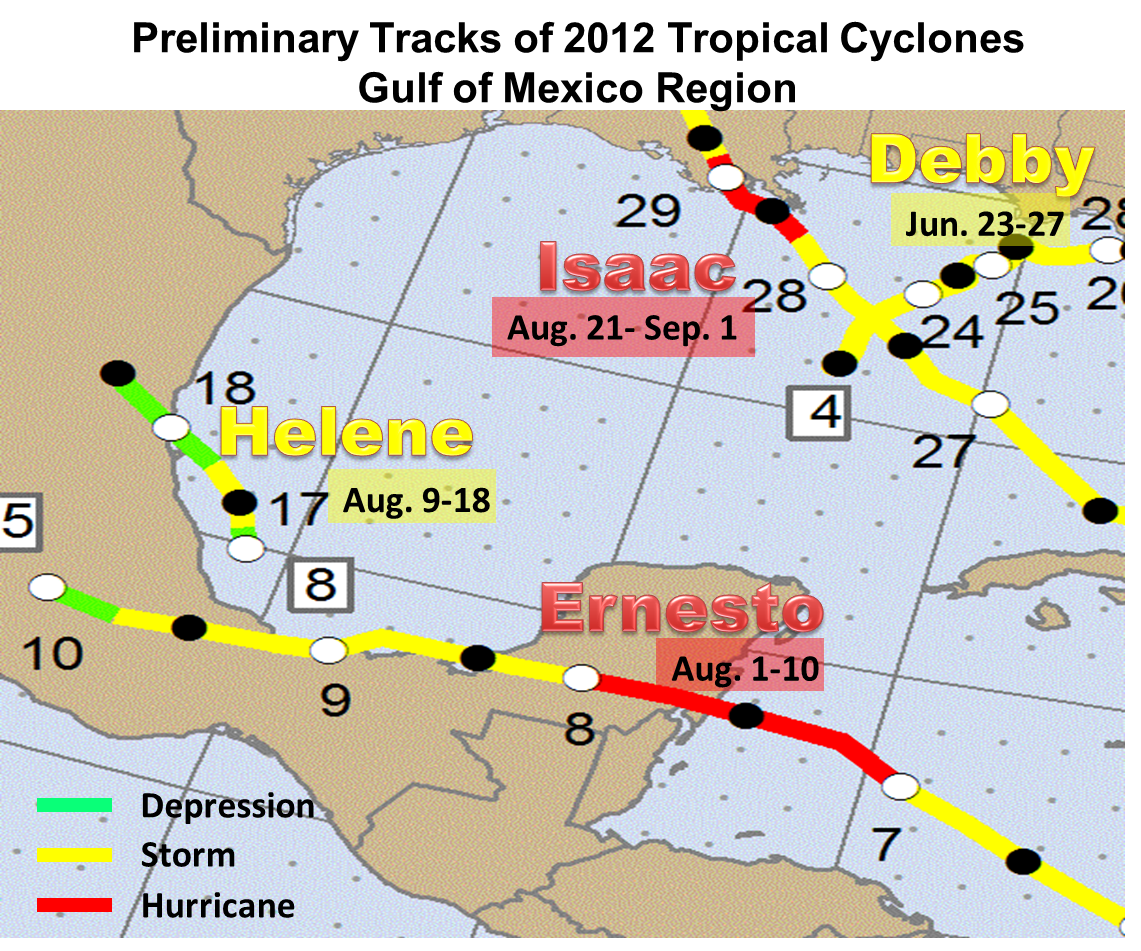
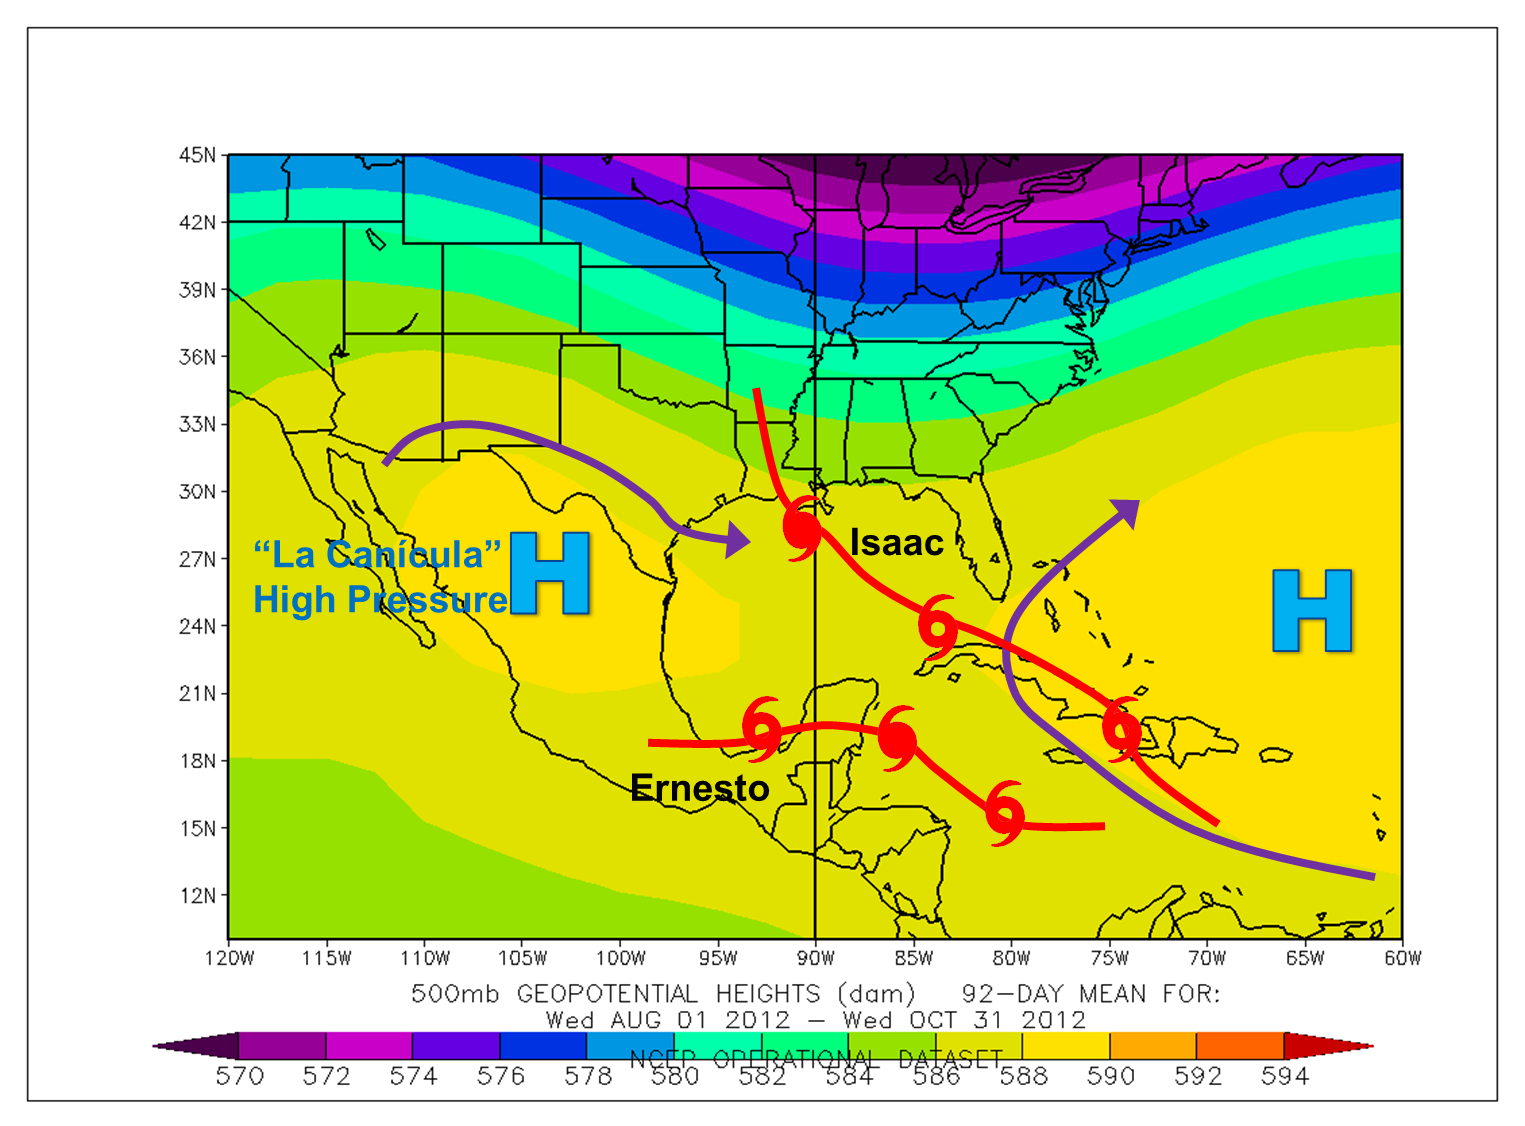
For the first time in three years, no storms made direct or indirect impact on the Rio Grande Valley. This was bad news for the drought–stricken region, which suffered through a second straight hot and dry summer in 2012. Similar to 2011, the potential for widespread, soaking rainfall from the tropics dried up, literally, in persistent northwest to west flow bringing dry air from the Southwest U.S. and northern Mexican desert regions, around the La Canícula ("Dog Days") high pressure ridge (below). Only two cyclones threatened the western Gulf (above); Hurricane Ernesto, like Hurricane Nate in 2011, was pressed to the south edge of the Bay of Campeche by the ridge. Dry air from La Canícula and the broader hot, dusty ridge across the central Great Plains, put up a stop sign for all cyclones daring to ease into the Gulf. Even Isaac, which had a well defined envelope of circulation and a decent source of tropical moisture, had to fight the dry air all the way to landfall on a track that typically favors modest to rapid strengthening. Brief Tropical Storm Helene, which landed south of Tampico as a depression, never had a chance.
|
| Superstorm Sandy: Sum of All Fears
Just at it appeared the impactful portion of the 2012 Atlantic Season along U.S. coastlines would be limited to one marginal tropical storm (Debby) and the "I" storm (Isaac) for a second year in a row, a large envelope of tropical energy began festering in the central Caribbean sea around the 19th/20th of October. By the 22nd, the energy organized into Tropical Storm Sandy, and early on the 24th would wrap up into a tight center of hurricane force winds. The center strengthened rapidly and made landfall with winds estimated near 110 mph in eastern Cuba as pressure crashed to 957 mb. As Sandy tracked northward through the Bahamas, dry air entering the system would reduce the winds to 70 to 75 mph, but pressure would remain formidably low, only rising to 970 mb. Soon after, puzzle pieces fell into place to transition Sandy from a hurricane with a small core and a large circulation into a Superstorm of epic proportion:
- Size. The initial large girth of Sandy, as much as 205 miles in the northern semicircle while passing the Bahamas, allowed larger atmospheric energy sources to feed, rather than destroy, the cyclone.
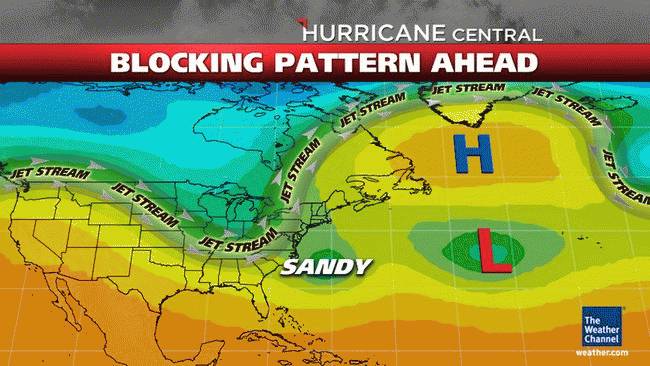
- Steering. A developing, strong negative phase of the North Atlantic Oscillation and Arctic Oscillation, coincided with Sandy’s march up the eastern seaboard. This teleconnection aided the development of a high amplitude blocking pattern (below left). The block provided necessary energy, known as baroclinicity (a term for energy derived when warm and cold air masses are in close proximity with one another; credit: Dr. Jeff Masters) for lowering surface pressure and the eventual curl into the mid Atlantic coast.
- Gulf Stream. Sandy’s track near the Florida east coast, initially curving northeast parallel to the southeast U.S. coast at increasing distance, was largely over 27°C (81°F) waters, which added additional fuel
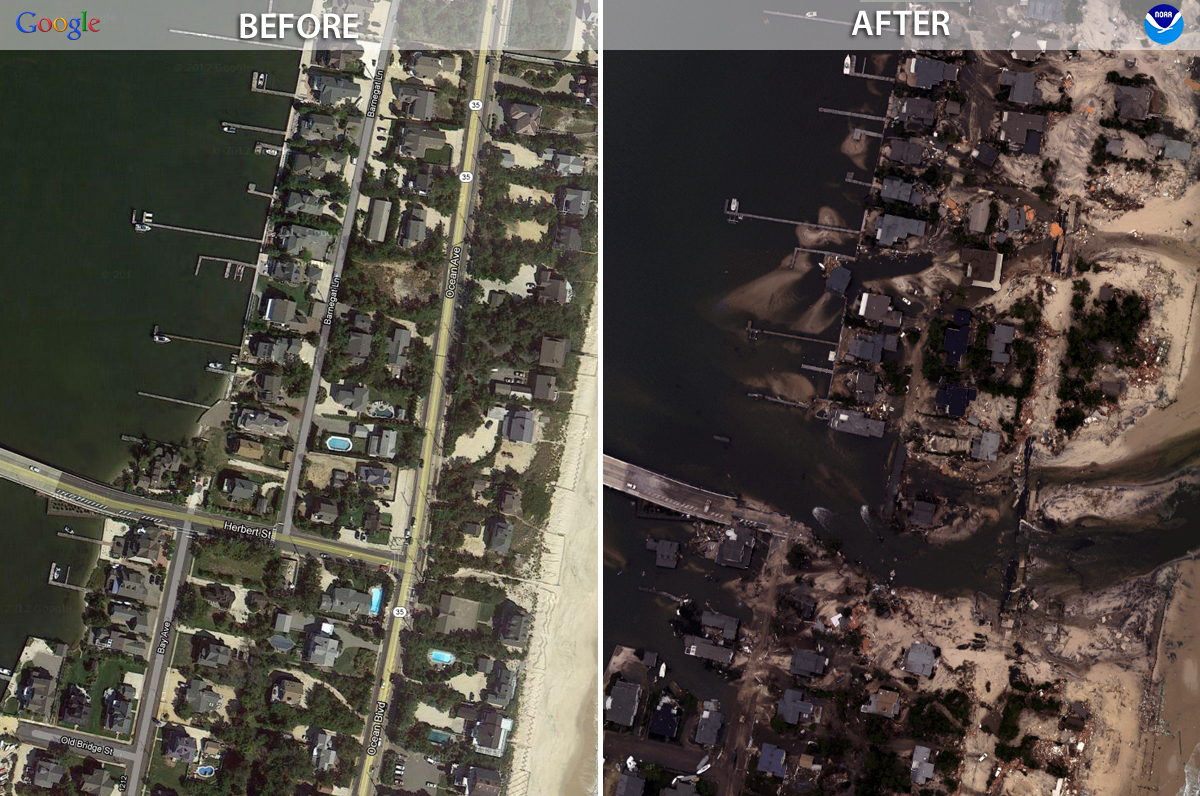
The rest is history. Sandy broadened in scope to include gale force winds more than 500 miles northeast of the center, built up the Atlantic Ocean to 25 to 35 feet for hundreds of miles, expanded in size to cover more than 1,000 miles, and intensified to a record low pressure for a storm east of New Jersey. Through landfall, and especially during high tide, storm surge destroyed or severely damaged thousands of homes and hundreds of miles of roads, bridges, tunnels, and more across the most densely populated corridor of the U.S. More than 8 million customers lost power during the peak of the storm. As of the end of November, damage estimates had soared to $63 billion (U.S.), making Sandy the second costliest weather event on record – so far. At last count, 253 persons died related to Sandy, including 131 in the U.S. A full report will be available from the National Weather Service in 2013. Meanwhile, check out the series of articles from the New York Times for photos, graphics, and more.
|
|
|
Fast Facts
- NOAA’s May 2012 Hurricane Outlook forecast 9 to 15 named storms, 4 to 8 hurricanes, 1 to 3 major hurricanes, and an Accumulated Cyclone Energy (ACE) Index Range of 65 percent to 140 percent of average. The preliminary results so far:
- 19 named cyclones
- 9 tropical storms
- 10 hurricanes
- 1 major hurricane (of the 10)
- ACE estimate: 128 percent of average
- The combination of high upper oceanic heat content across much of the basin, and a neutral El Niño Southern Oscillation in the eastern tropical Pacific for most of the season, and available moisture in the basin beyond the tropics were important reasons for the large number of cyclones.
- The season got off to a jackrabbit–fast start. Two cyclones by the end of May, and another two cyclones by the end of June, were both notable and record breaking. The two tropical storms before the official start of the season (June 1) occurred for the first time since 1908; the naming of Debby on June 23rd marked the earliest time in history, dating back to 1851, that four named cyclones were recorded.
- Teleconnections, or atmospheric "puzzle pieces" which help dictate intraseasonal weather patterns, likely played a role in storm formation and movement. Most notably: Flow around the broad central Atlantic Ridge and repeating troughs nearing the east coast (below) recurved all but one (Helene) Cape Verde wave, and a sizable number of storms (7) formed north of 20°N latitude.
- A persistent, weakly negative North Atlantic and Arctic Oscillation may have contributed to the stability of the eastern North American trough.
- The 2012 season, like the two before it, is proof positive why we don’t "do" seasonal landfall predictions. As stated on the NOAA Hurricane Season Outlook: "NOAA does not make seasonal hurricane landfall predictions. Hurricane landfalls are largely determined by the weather patterns in place as the hurricane approaches, which are only predictable when the storm is within several days of making landfall."
|


 Follow us on YouTube