|
Overview
The 2013 Atlantic Hurricane Season might be best remembered as the "Ghost" of the 2013 Atlantic Hurricane Season. Amid much fan fare, a busy season was forecast by nearly every forecasting organization back in May. Unfortunately for the forecasters, but fortunately for coastal residents in harm’s way, the season was a dud.
Things began in sprightly fashion; Tropical Storm Andrea formed in early June in the central Gulf, and made a rather predictable move to the northeast, eventually making landfall near Steinhatchee, Florida, on June 6th. Primary impacts were felt well away from the center, and included flash flooding in the Miami–Fort Lauderdale metropolitan area where up to 15 inches of rain fell. Minor storm surge flooding occurred along the Florida Suncoast, with ten small tornadoes on the peninsula. Thereafter, the season went largely barren. Andrea would be the only U.S. landfalling tropical cyclone in 2013; indirect impacts, primarily from rainfall, would be felt later in the season across the Rio Grande Valley from Hurricane Ingrid (northeast Mexico, below), and parts of the southeast U.S. from a dissipated Tropical Storm Karen in the north central Gulf. By the time Tropical Storm Melissa transitioned to a non-tropical low pressure system on November 22, there had been 13 named cyclones, only two which reached hurricane status. Each hurricane failed to attain Category 2 strength wind (96 mph); 2013 marked the first time this occurred since 1994. Humberto, the first named hurricane of the season, reached hurricane status on September 11th, tying the latest date for the first named hurricane in the satellite era (1960).
Rio Grande Valley: A "Winner"?
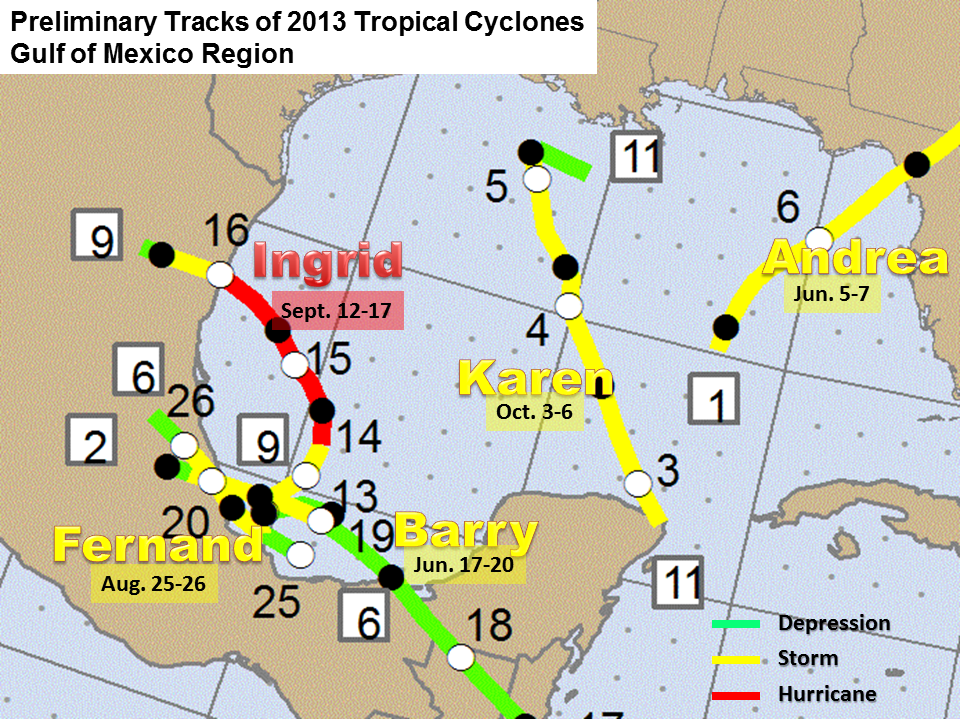
After failing to see any impact from a tropical cyclone in 2012, the outer bands of Hurricane Ingrid, which made landfall near La Pesca, Tamaulipas, on September 16th, dropped two to four inches of welcome rainfall from Brownsville through southern Hidalgo and much of Starr County that day. The rains, falling on increasingly saturated soil, produced pockets of poor drainage flooding mainly in Hidalgo County. In some sense, Hurricane Ingrid was the Valley’s serendipitous cyclone. The fortune of seeing welcome rain with only tidal overwash into the dunes at South Padre may have been a blessing in disguise; had Ingrid formed farther north and crossed the tip of the Yucatan peninsula (rather than moving though the southern portion of the peninsula), the cyclone would have had very favorable low wind shear, deep moisture, and very warm and deep Gulf water temperature to feed on and likely develop rapidly. Steering patterns would have pushed Ingrid toward the Valley, possibly as a major (Category 3 winds) hurricane, and we might be talking about a much more memorable season. Ingrid was certainly memorable in central Mexico; 23 persons died, with an estimated $1.5 billion (US) in property damage – by far the worst impact of the season anywhere in the Atlantic Basin.
Ingrid was one of several cyclones (see map, above) that struggled to develop in the southwest Gulf. These included Tropical Storm Barry (June) and Fernand (August), short–lived cyclones that made landfall in Veracruz (state), as well as Tropical Depression Eight, which made landfall near Tampico on September 7th. Each of these cyclones were impacted by wind shear, dry air, or some combination of each which kept them from reaching their potential; as the map above shows, intensification was often just prior to landfall. Still, Fernand proved there’s "More to the Story than the Category"; torrential mountain rains created deadly flash flooding and mudslides. Fourteen lost their lives with tens of millions in dollar (US) damage.

Loop of convergent band of locally heavy rainfall across the Rio Grande Valley associated with the remnant of Hurricane Ingrid. Ingrid’s leftover center is indicated by the black ‘hole’ among the green and yellow returns in central Tamaulipas (about 125 miles southwest of Brownsville). Click to enlarge.
|
Satellite image courtesy of Cooperative Institute for Meteorological Satellite Studies.
A Failure to Launch: Some Reasons Why
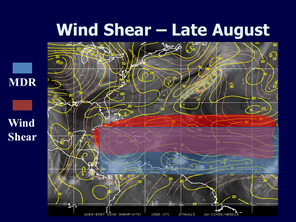
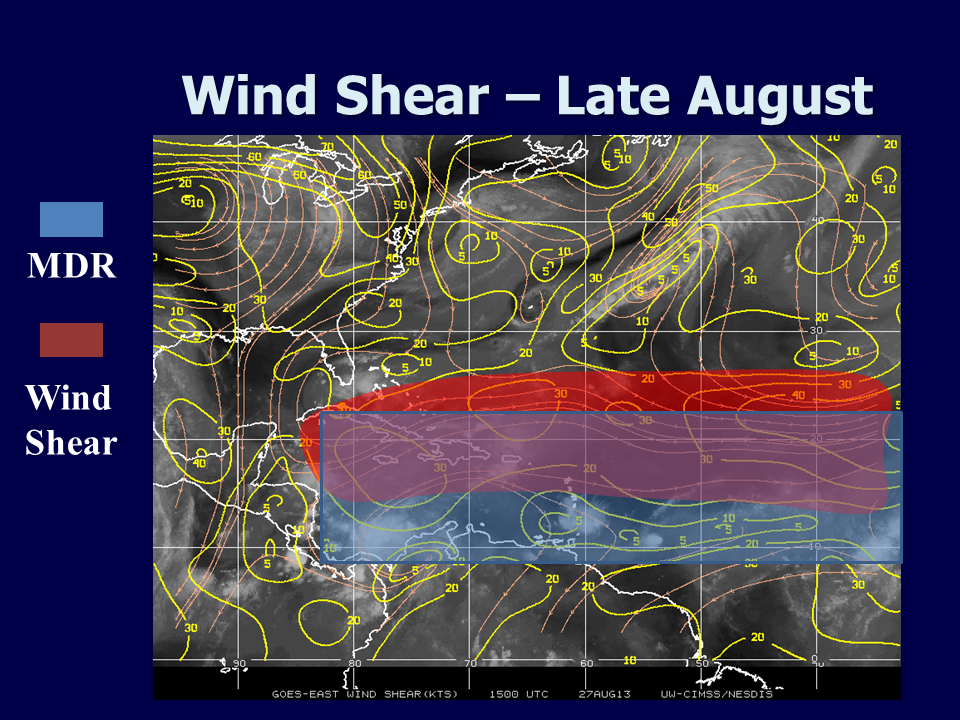
All the big "puzzle pieces" appeared to be in place prior to the 2013 Atlantic Hurricane Season: The long term average positive phase of the Atlantic Multidecadal Oscillation, which favors above average water temperatures in the Main Development Region (MDR) of the Atlantic Basin, which is an area bounded by the Tropical of Cancer and ~8° North Latitude, and from 72.5° West Longitude to the sub–Saharan African coast. A neutral to weakly–leaning positive El Niño Southern Oscillation, which typically limits wind shear across the MDR, western Caribbean, and Gulf. Finally, a favorable phase of the Madden–Julian Oscillation, which can provide moisture "seeds" that can help the growth of tropical cyclones in the MDR, arrived during the peak of the season in September.
So what happened?
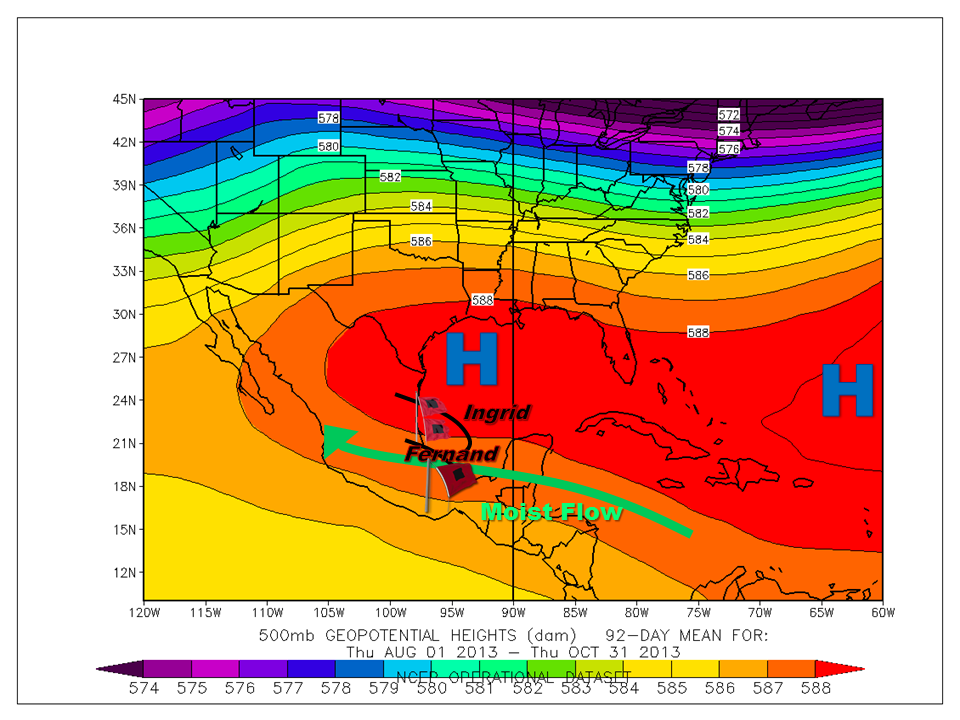
We suspect a healthy dose of smaller puzzle pieces, with limited to no predictability for their occurrence more than a couple weeks in advance, played a part. Serendipity may have played a smaller role, as may have been the case with Ingrid’s formation location in the Bay of Campeche rather than the south central Gulf, as well as a northern Caribbean sea disturbance in mid August that emerged into the southern Gulf only to be sheared by moderate southwest flow, and killed off by dry atmospheric air that surged into the western Gulf courtesy of the "La Canícula" high pressure ridge. The smaller puzzle pieces are described below.
- Shear. Deep atmospheric wind shear, a known enemy of tropical cyclone development, dominated good portions of the MDR for much of the peak Cape Verde season (August 1 through September 30).
- Dry Air. The second primary enemy of tropical cyclone development dominated the MDR and much of the Caribbean and Gulf of Mexico during the summer.
- A Weak Sub Saharan Jet Stream. This possibility, espoused by Brian McNoldy of the University of Miami’s Rosenstiel School of Marine and Atmospheric Science, may have reduced the necessary amplitude and curvature of easterly waves emerging off the coast of west Africa.
- Anomously low pre–season phase of the AMO. A period of anomalously low monthly index values of the Thermohaline Circulation(THC)/AMO (Klotzbach and Gray, 2013) from April to June may have contributed to the increased dry air and northerly flow that supported the dry air through the peak of the season (August and September). Though THC/AMO values recovered by July, the lagged influence of the April to June period was likely not enough to overcome the dry and stable airmass
- North Atlantic Oscillation (NAO). The pronounced positive phase of the NAO which dominated much of April and May perhaps correlated with the low AMO phase at the "wrong" time for the AMO to crash in order to maintain sufficiently warm and humid conditions.
- Bad Timing. Unlike the 2010–2012 seasons, which were dominated by negative phase of the NAO and showed distinct recurvature of most storms into the open ocean, the 2013 season had alternating positive and negative phases. A pronounced positive phase in July arrived prior to the peak of the Cape Verde/MDR season; the phase turned decidedly negative for most of August, reducing the opportunity for U.S. landfalls. In September, the NAO turned positive again (and rainfall increased across Texas), but the persistent dry air and wind shear across the MDR kept development to a minimum.
|
|


 Follow us on YouTube