National Weather Service United States Department of Commerce


animation slide show of photos from Rio Grande Valley flooding September 26 and 27 2014
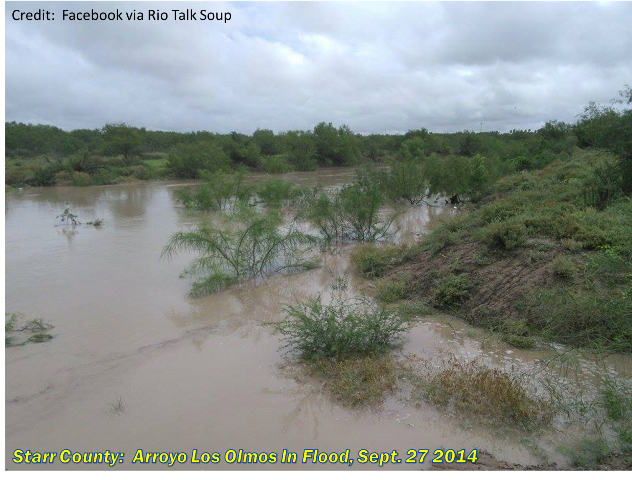
Photos from urban, flash, and arroyo flooding in Rio Grande City, Edinburg/McAllen/San Juan, and eastern Cameron County during and after torrential rains of September 26–28, 2014
When It Rained, It Poured!
Ark Needed? Pockets of the Upper, Middle, and Lower RGV Flooded, September 26–27, 2014
Graphic depicting some reasons for the locally heavy rainfall and flooding across the Rio Grande Valley, Sept. 26 to 28 2014
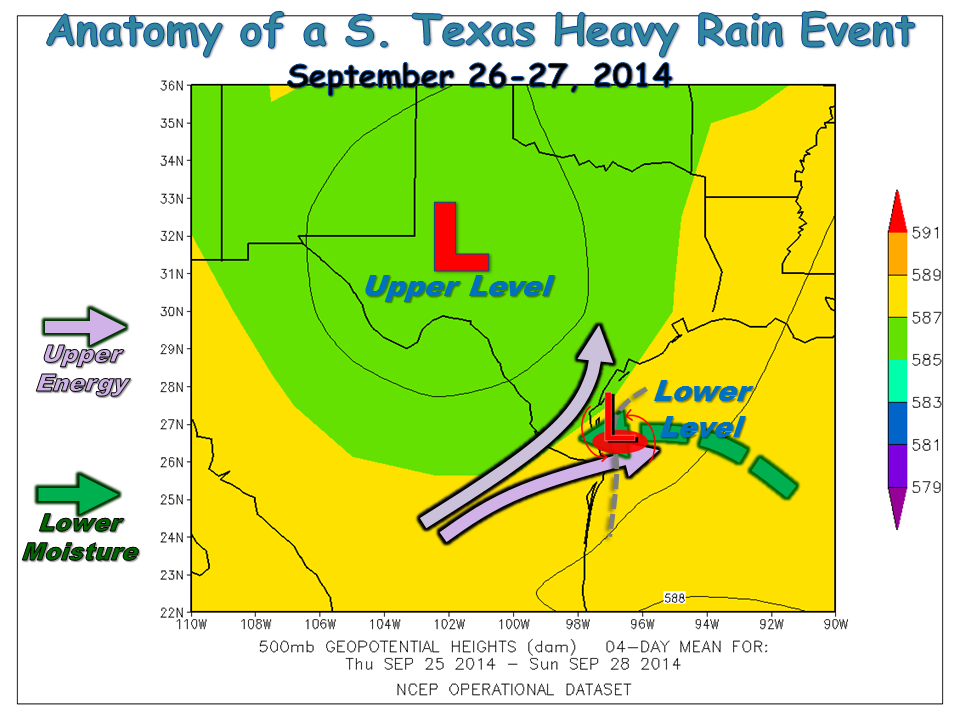
Graphical depiction of some atmospheric reasons for the flooding rainfall in South Texas, September 26–28, 2014
 

September 2014, already with above average rainfall in hand and plenty of lush, green grass and brush as a result, finished with a flourish as a slow moving upper level disturbance (large red "L" above) seeded the high levels of the atmosphere with moisture and helped focus/enhance tropical moisture closer to the earth’s surface along a trough of low pressure (smaller red "L"), from September 25th through 28th. The result was a combination of collisions that led to life and property threatening flooding across different locations in the Rio Grande Valley between Friday night, September 26th, and early Sunday morning, September 28th. By the time the final weekend of September 2014 ended, Valley–wide rainfall would be the largest for a single month since July 2008, when early month rains were overwhelmed by widespread flooding from Hurricane Dolly. The repeated rainfall overcame comparative months of September 2010 and June 2010.

September 26, Evening: Rio Grande City Washout
Early afternoon heating, boundaries/storms moving toward the west and southwest from the South Texas Brush Country, and a wave of upper level energy rotating from southwest to northeast each combined to create a nearly stationary band of torrential rain producing thunderstorms over Rio Grande City and nearby locations. Nuisance flooding began during the late afternoon, and significant, life and property flooding began in Rio Grande City before sunset. Flooding peaked after sunset and continued through at least 11 PM, including water levels on the normally low flowing or dry Arroyo Los Olmos exceeding bank full by 2 to 3 feet, and several feet of flowing water that flooded the Las Lomas neighborhood. Several cars were partially submerged, and at least one house had extensive inundation. Observations and radar estimated suggested 6 to 8+ inches of rain fell during the long duration event. In addition to the flooded Arroyo Los Olmos, the river stage at Rio Grande City spiked as well but remained well below the danger level – though flow rates and water level in the Rio Grande were harrowing.

Radar loop of composite reflectivity over Rio Grande City during peak of flooding, September 26, 2014
Loop of radar composite reflectivity across southern Starr County, from 745 PM through 858 PM September 26th, around the time that the worst flooding began in Rio Grande City and nearby areas. Data viewer credit: Plymouth State Weather Center.
 
Radar loop of composite reflectivity over the McAllen metropolitan region during the peak of torrential rains and flooding between 221 and 4 PM Sept. 27 2014
Loop of radar composite reflectivity across central Hidalgo County, from 221 through 4 PM September 27th. Radar and surface reports suggested 2 to 3 inches in an hour or less in some areas, creating a combination of urban and flash flooding. Data viewer credit: Plymouth State Weather Center.
 

September 27, Afternoon: Mid Valley Mess
A similar circumstance to the setup on the 26th arose by mid afternoon on the 27th, but this time favored the most populated metropolitan region in the Rio Grande Valley. A slow moving band of blinding rains developed in rural northeast Starr and northwest Hidalgo County soon after noon, and would soon link up with other cells forming from Reynosa/Tamaulipas into the McAllen/Edinburg/Mission/San Juan/Pharr area generally between 230 and 330 PM. The rain may have lasted an hour, but accumulated well over 2 inches in McAllen and Edinburg. Poor drainage locations were unable to keep up with the rainfall rate, and water up to 3 feet deep piled up in a few areas until a little while after the rain moved east. Farther north, in rural central and northern Hidalgo County, rains continued well after they had cleared out from the larger population centers. Nearly 4 ½ inches fell in San Manuel during the afternoon; some areas likely received between 6 and 8 inches. Locations in and near the heaviest cores reported several feet of inundation, including water reaching into houses.

September 27–28: Laguna Madre Lakes?
The longest lasting and highest total rainfall fell in a small area of the Laguna Madre and nearby Laguna Atascosa National Wildlife Refuge south of Arroyo City. High resolution radar estimates suggested 9 to 10 inches over the area. Along Farm to Market 106 (FM 106), between the La Tina Ranch and Holly Beach east of Rio Hondo, 6 to 9 inches likely fell. A local storm survey, as well as other accounts, indicated part of the road bed washed away on FM 106 with water up to or still into homes along the road, more than 12 hours after the rain had ended. Along Arroyo City Blvd. (FM 1847), several vehicles were disabled by the floodwaters, which were likely 3 feet or higher in several locations. Most of the significant flooding began around 9 PM on the 27th, and continued well past midnight into the pre dawn hours of the 28th before waters started to recede. The heavy rainfall in the Lower Valley combined with upstream rains in the Mid and Upper Valley to create a wave of high, fast flowing water on the Rio Grande at San Benito late on the 28th and into the 29th.

Radar loop of composite reflectivity over eastern Cameron County as the peak of torrential rains and flooding began, from 727 to 858 PM Sept. 27, 2014
Loop of radar composite reflectivity across eastern Cameron County, from 727 through 858 PM September 27th. Radar and surface reports suggested 2 inches an hour at times. Data viewer credit: Plymouth State Weather Center.
 

On South Padre Island, several rounds of showers and thunderstorms dropped between 4 and 6 inches throughout the day and evening, adding another layer of hazard to an already rough and confused surf (and on and off showers since the 25th) which pushed up to the dunes at high tide on the 26th and 27th. The heavy rain flooded most roads with 1 to 2 feet of water during the afternoon of the 27th.

Rough and tumble surf near the Isla Blanca Jetty (north) on South Padre Island during the afternoon of Friday, September 26 2014
Rainfall from 7 AM September 25 through 7 AM September 28 2014 across the Rio Grande Valley
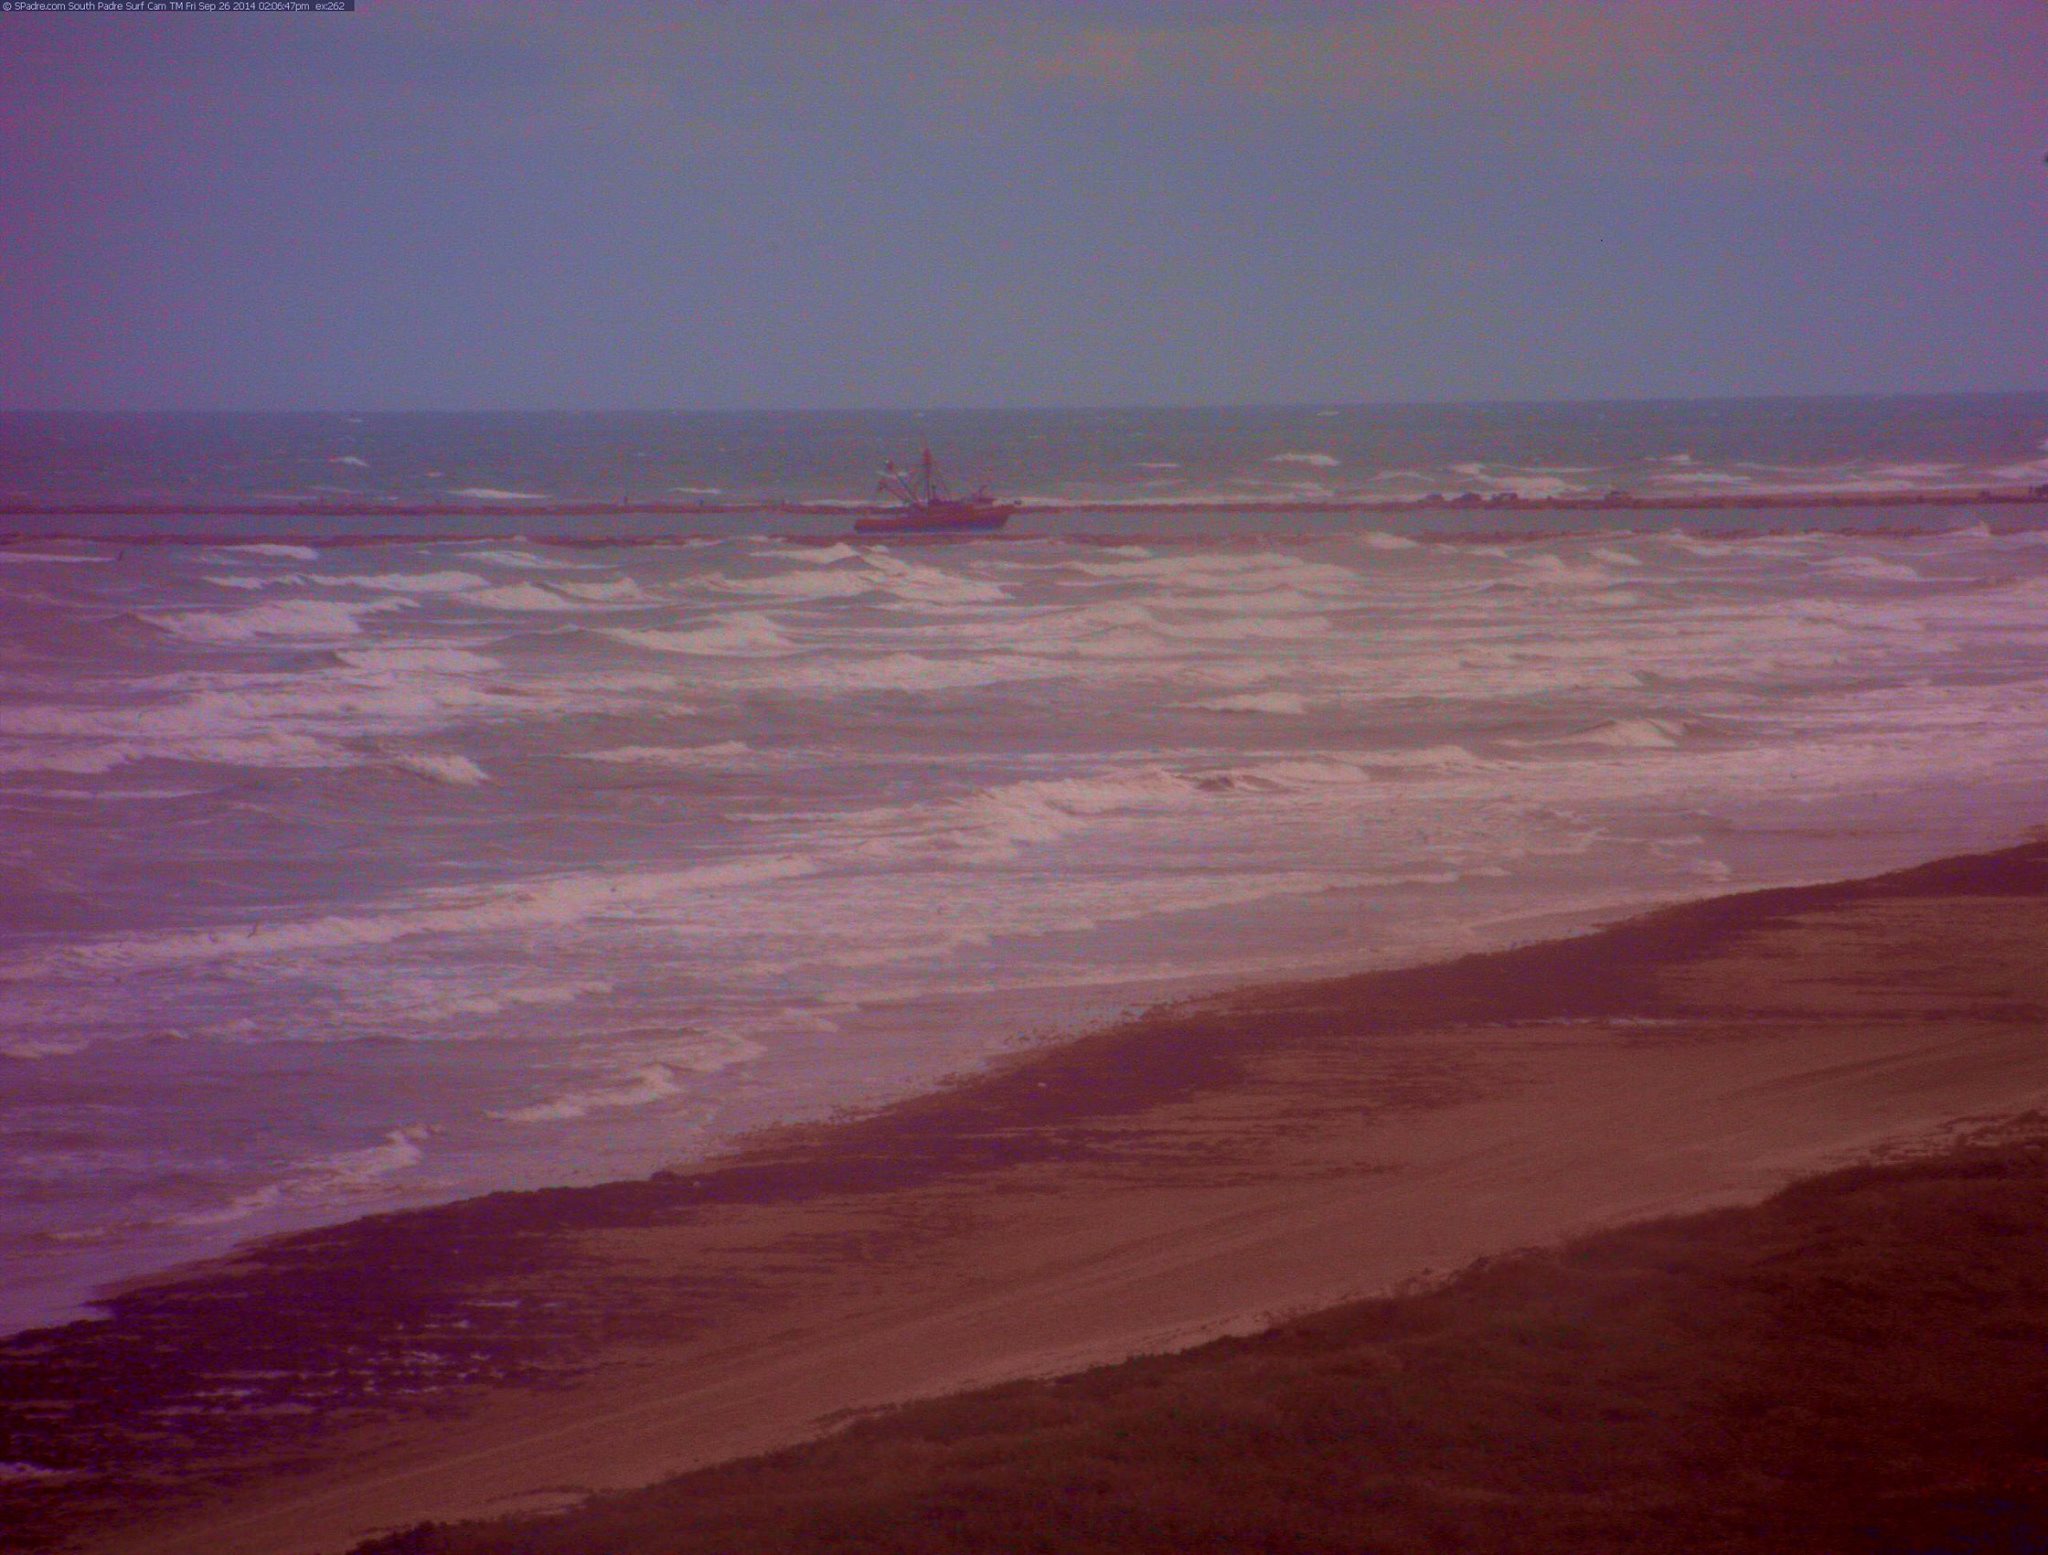
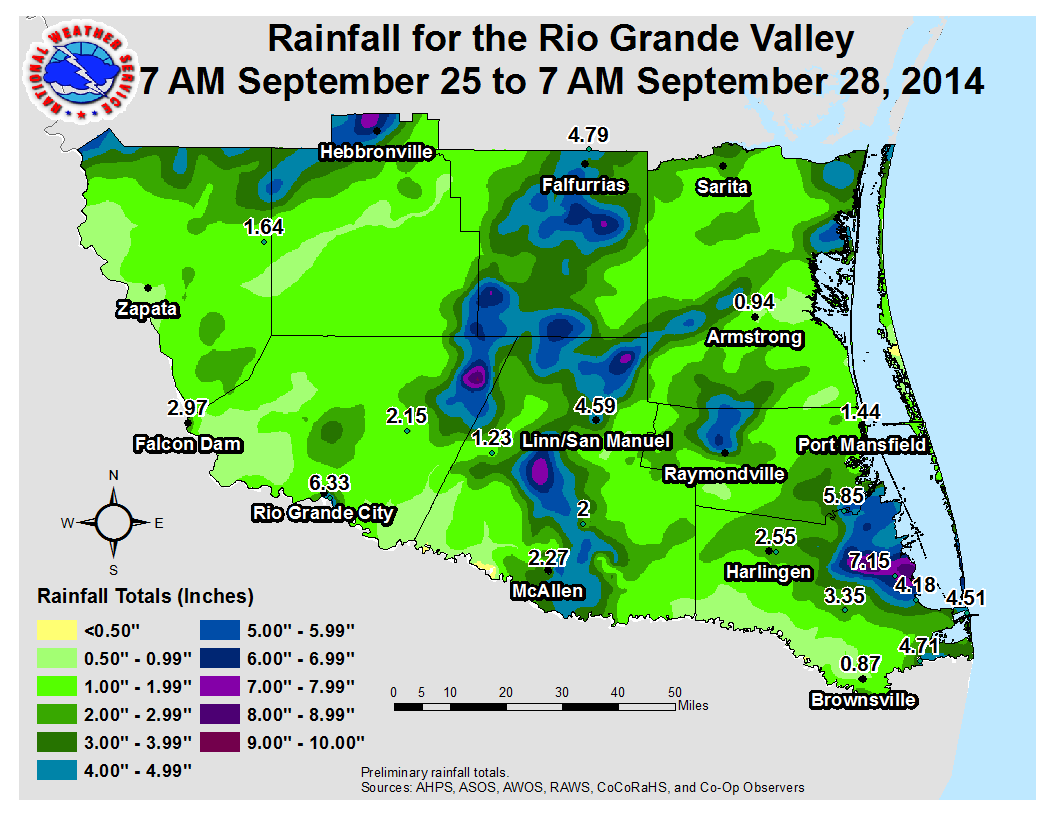
Rainfall, measured and estimated, for Deep South Texas and the Rio Grande Valley between 7 AM September 25 and 7 AM September 28, 2014
Selected Preliminary Rainfall Between 7 AM September 25 and 7 AM September 28, 2014
Location
County
Sept. 25-28 Rainfall (inches)
Bayview/Cameron Co. Airport
Cameron
7.48
Rio Grande City
Starr
6.33
Laguna Atascosa NWR
Cameron
5.87
Rio Hondo 9.4 NE
Cameron
5.85
San Benito 8.7 ENE
Cameron
5.70
Falfurrias/Cooperative
Brooks
4.79
Brownsville 12.6 E
Cameron
4.71
San Manuel/Cooperative
Hidalgo
4.59
South Padre Island/Isla Blanca Coop
Cameron
4.51
Laguna Vista 0.3 N
Cameron
4.18
Falfurrias 8.9 SSW
Brooks
4.03
Brownsville 6.4 SE
Cameron
4.01
Falfurrias 0.5 WNW
Brooks
3.64
Los Fresnos 0.3 NE
Cameron
3.35
Falcon Dam Cooperative
Starr
2.97
Harlingen/Valley International Airport
Cameron
2.48
Falcon Lake RAWS
Starr
2.42
McAllen/Miller Airport
Hidalgo
2.27
Rio Grande City 17.7 NE
Starr
2.15
Harlingen/Cooperative
Cameron
2.09
Edinburg/Cooperative
Hidalgo
2
Santa Ana NWR
Hidalgo
1.99
Harlingen 4.2 W
Cameron
1.79
Linn 8.4 WNW
Hidalgo
1.72
Hebbronville RAWS
Jim Hogg
1.63
Harlingen 2.6 ESE
Cameron
1.57
San Benito 0.6 SSE
Cameron
1.56
Port Mansfield
Willacy
1.44
Harlingen 0.4 N
Cameron
1.40
McCook/Cooperative
Hidalgo
1.23
McAllen/Cooperative
Hidalgo
1.23
Linn/San Manuel NWR
Hidalgo
1.19
Brownsville 2.2 W
Cameron
1.13
Brownsville 4.1 ENE
Cameron
1.12
Mission 3.1 NE
Hidalgo
1.09
Brownsville/SPI Airport
Cameron
1
Data from NWS Automated Surface Observing Systems, NWS Cooperative Climate Observers, Mesowest Data, and Community Collaborative Rain, Hail, and Snow Network.