 Email the authors
Introduction
Scattered strong to locally severe storms tracked across the North Country during the afternoon hours on June 18, 2018. A warm, moist tropical air mass (from the remnants of Hurricane Bud) was in place over New England and New York ahead of a cold front sagging south from Canada. While cloud cover limited surface heating, the air mass itself was sufficiently unstable to allow for thunderstorm development in the early afternoon. Due to the moist characteristics of the air mass, storms that did develop produced very heavy rainfall rates, along with several damaging wet microbursts. These severe storms caused up to 16,000 people in Vermont to lose power, with additional power outages occurring in northern New York. The strongest microburst produced significant property damage and downed 3 to 4 dozen trees in the vicinity of Waitsfield, VT. The National Weather Service (NWS) in Burlington, VT conducted a damage survey, and determined that the microburst damage path was over a mile long and up to a quarter mile wide. The damage extended from the ridgeline on Hemlock Hill across the Mad River Valley to near the base of Mt. Waitsfield. Figure 1 below shows a map of local storm reports across the North Country on 18 June 2018.

Figure 1: Map of local storm reports from 18 June 2018. [click to enlarge]
Pre-Storm Environment
The Day 1 Convective Outlook from the Storm Prediction Center (SPC) showed a slight risk for severe thunderstorms across a large portion of the Northeast, with wind being the primary severe weather threat. From SPC, a slight risk implies well-organized severe thunderstorms are expected, but in small numbers and/or low coverage. Depending on the size of the area, approximately 5-25 reports of 1 inch or larger hail, and/or 5-25 wind events, and/or 1-5 tornadoes would be expected. The probabilistic wind forecast from SPC, showed a 15% chance of severe thunderstorm winds within 25 miles of a given point during the outlook period across the entire Weather Forecast Office (WFO), Burlington, VT forecast area. The slight risk area verified very well across the Mid Atlantic States into the Northeast, given the number of severe weather reports.

Figure 2: The Storm Prediction Center (SPC) Day 1 categorical outlook (left) and SPC Wind Outlook (right) at 9:00 AM EDT on 18 June 2018. [click to enlarge]
The GOES-16 visible satellite showed extensive cloud coverage across the North Country, but enough breaks occurred to warm surface temperatures well into the 80s, which combined with rich moisture produced enough instability to support severe thunderstorms. The taller/puffy cauliflower looking clouds in the image below indicated where stronger thunderstorms were located. The red dotted lines outline where boundaries where located, while the blue line with triangles shows the position of an approaching cold front. These low level boundaries helped to enhance low level convergence and resulted in numerous rounds of showers and thunderstorms.

Figure 3: GOES-16 visible satellite image, at 4:06 PM EDT on 18 June 2018. [click to enlarge]

Figure 4: Surface map analysis with surface plots, mean sea level pressure (orange lines), warm front (red half circles), and outflow boundary (red dot line) at 5:00 PM EDT on 18 June 2018. [click to enlarge]
On 18 June 2018, New England was well established in the warm sector of a low-pressure system positioned in Canada, with southerly winds advecting an anomalously warm, moist air mass into the region. Surface dew points in the upper 60s to mid 70s were prevalent across the North Country, with showers and storms already developing in the morning along the International Border. Temperatures across the St. Lawrence and Champlain Valleys were in the 80s at 10:00 AM EDT, with additional heating into the upper 80s to lower 90s further south across southern New England and southeastern New York. An outflow boundary was established from the morning activity, leading to enhanced surface convergence ahead of a series of cold fronts pushing southward from Canada, which led to several rounds of convection throughout the day with very heavy rainfall rates.

Figure 5: Upper air sounding from Albany, NY at 2:00 PM EDT on 18 June 2018. [click to enlarge]
The 2:00 PM EDT upper air sounding from Albany, NY shows nearly dry adiabatic low-level lapse rates were present from the surface to 700 mb (~12,000 feet above ground level), along with ample amounts of low-level moisture (precipitable water value of 1.74 inches). Forecast surface based CAPE values of over 2100 J/kg suggested moderate instability within the lower atmosphere, while 35 knots of surface to 6km bulk shear would allow storms to organize into multicellular lines, with damaging winds as the primary severe weather threat. Freezing levels on this day were almost 15,000 feet, which means that a deep layer of warm air was present in the low to mid levels of the atmosphere, minimizing the severe hail threat. The very high equilibrium levels (46,000 feet) indicated thunderstorm tops would extend to 45,000 to 50,000 feet into the atmosphere, and be capable of producing severe winds and very heavy rainfall. Based on parcel theory, the equilibrium level is the level at which the rising parcel equals the ambient air temperature at that given height, and results in the rising parcel now becoming stable; it no longer accelerates upward.
This sounding suggests the main threats of the storms on this particular day would be heavy rain and damaging winds. The very high amounts of precipitable water (PW) present in the atmosphere along with the high freezing levels, indicating a deep warm cloud layer, support warm rain processes (i.e., collision-coalescence) and heavy rainfall. Warm clouds contain a much higher concentration of small drops than cold clouds, so a deep warm cloud layer, such as seen in this sounding, supports heavy rainfall.
The 2 PM EDT Albany, New York sounding also indicates an environment supportive of damaging winds via wet microbursts. The layer of drier air present aloft in the 400mb to 600mb layer enhances evaporative cooling, which increases the potential for damaging winds within downbursts. Furthermore, steepening low level lapse rates from warming surface temperatures, helps to accelerate air parcels to the surface within a convective environment. While forecast lifted indices of -6 C would support the formation of hail within storms, the deep warm layer present in the atmosphere would make it difficult for large hail to reach the ground before melting. For this reason, the threat for large hail was not very high on this particular day.

Figure 6: SPC Rapid Refresh (RAP) mesoanalysis of Supercell Composite (left) with Bunker Storm Motions (orange wind barbs) and Most Unstable CAPE (red lines), Convective Inhibition (CIN) (light blue fill), and effect bulk shear > 25 knots (orange wind barbs) at 2:00 PM EDT on 18 June 2018. [click to enlarge]
Figure 6 shows the Rapid Refresh (RAP) analysis of CAPE and 0 to 6 km effective bulk shear from SPC on 18 June 2018 at 2:00 PM EDT. As a low to mid-level jet approached the region, the deep layer shear increased to between 35 and 45 knots, while modest CAPE values were in place across our CWA. From SPC, the definition of effective bulk shear is “similar to the 0-6 km bulk shear, though it accounts for storm depth (effective inflow base to EL) and is designed to identify both surface based and ‘elevated’ supercell environments. Supercells and organized convection becomes more probable as the effective bulk shear vector increases in magnitude through the range of 25-40 knots and greater”. The RAP most unstable CAPE showed values between 1000 and 2000 J/kg across northern New York into central and southern Vermont. Note, the best combination of deep-layer shear and highest instability (CAPE) was located across central New York into central/southern Vermont, and closely matches the region of greatest concentration of wind damage. The combination of moderate instability and effective shear values between 35 and 45 knots helped to produce an environment favorable for organized thunderstorms, with damaging winds being the primary severe weather threat, due to the magnitude of wind shear through a deep layer of the atmosphere.
Storm Analysis
Figure 7 shows a schematic evolution of a microburst. A microburst is an intense small-scale downdraft produced by a thunderstorm. A microburst is often associated with a sudden burst of damaging winds, that can knock down trees, power lines, and can cause significant property damage. In very moist environments, cloud water descends with the downdraft, leading to a wet microburst (Figure 8). Wet microburst are accompanied by significant precipitation rates, which helps to transport severe winds aloft to the surface, when deep layer mixing is present.

Figure 7: Schematic of microburst (photo courtesy of Fujita 1981). [click to enlarge]
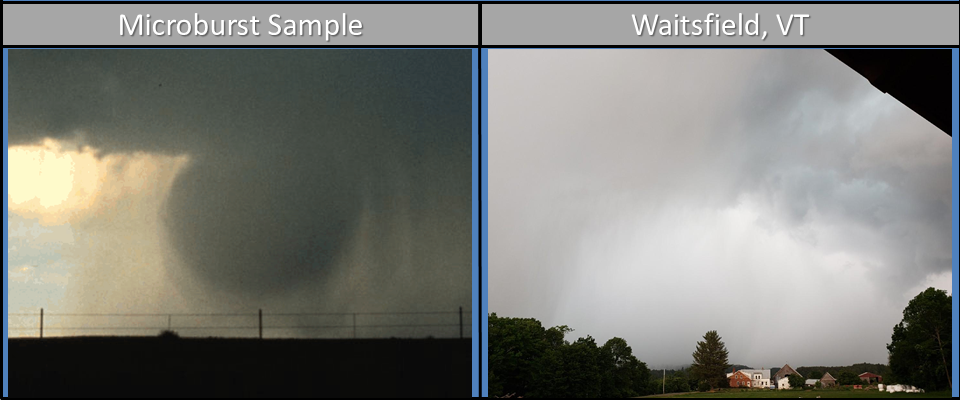
Figure 8: Image of a wet microburst from National Weather Service Birmingham (left), and an image displaying the rain shaft moments before microburst damage was observed at Waitsfield, VT courtesy of Meggie McLaughlin (right). [click to enlarge]
Figure 9 below shows KCXX 1.8° base reflectivity (left) and 1.3° base velocity (right) of a bowing segment within the larger line of storms moving east-southeast through central Vermont. The base reflectivity shows a sharp reflectivity gradient along the leading edge of the bowing segment, which indicates an area of strong low-level convergence. Examination of radar scans between 4:20 PM EDT and 4:35 PM EDT (not shown) reveals an even sharper leading edge reflectivity gradient in the minutes leading up to the microburst, indicating the presence of a strong updraft within the storm. Base velocity values of 50-55 kts are observed around 4:35 PM EDT near Waitsfield along and just behind the leading edge of the bowing segment of the storm. These strengthening low levels winds indicate the location of the microburst as the downdraft within the storm descended to surface.

Figure 9: KCXX 1.3° base reflectivity (left) and velocity (right) near Waitsfield, VT at 4:35 PM EDT on 18 June 2018. [click to enlarge]
Figure 10 shows the damage path as the storm moved southeastward across the Mad River Valley near Waitsfield, Vermont. The microburst left a swath of isolated tree and property damage across the valley, initially with all damage indications pointing to straight-line winds from the northwest to southeast. The southeastern terminus of the damage path contained the most significant tree and property damage, consistent with winds of 60 to 80 mph spreading outward (divergent pattern) upon reaching the surface (a typical damage signature of a microburst). The whitish color in the image below outlines where NWS survey team saw isolated wind damage with estimated speeds of 40 to 60 mph. Meanwhile, the light green areas show two enhanced regions of wind speeds of 60 to 80 mph with significant tree and property damage observed.

Figure 10: Waitsfield, VT microburst damage path, based on National Weather Service storm survey. [click to enlarge]
Figure 11 shows KCXX 1.3° base reflectivity (left) and 1.3° base velocity (right) of a storm that brought strong winds to East Topsham and Newbury, VT, resulting in power outages owing to downed trees in the area. Radar imagery of this bowing segment clearly shows a descending rear inflow jet, marked by a weak echo channel behind a bulge in reflectivities, collocated with outbound low-level velocities of up to 55 knots.

Figure 11: KCXX 1.3° base reflectivity (left) and velocity (right) near Newbury, VT at 5:10 PM EDT on 18 June 2018. [click to enlarge]
Figure 12 shows the KCXX 0.5° reflectivity (left) and velocity (right) at 4:50 PM EDT, of a thunderstorm that produced several areas of tree and power line damage. Radar data indicated a miniature bowing segment with inbound winds (moving toward the radar) of 60 to 65 knots at 6000 feet above ground level. These velocities, combined with a sharp radar reflectivity gradient and a storm motion of 45 mph, supported the damaging thunderstorm wind gusts threat. This miniature bowing segment produced trees and powerlines down east of Hogansburg and in the town of Constable.

Figure 12: KCXX 0.5° base reflectivity (left) and velocity (right) over Northern New York at 4:50 PM EDT on 18 June 2018. [click to enlarge]
Hydro
Several rounds of showers and thunderstorms impacted northern New York and Vermont on June 18, 2018. The air mass which was in place had very high precipitable water; upstream soundings indicated about 1.75”. Storms trained along a line extending from Massena, NY southeastward through Plattsburgh, Burlington, and just north of Montpelier. In this area, rainfall totals ranged from three quarters of an inch to over three inches. Massena and Burlington set new rainfall records for the date, with totals of 3.31” and 2.29”, respectively.
Vermont and Northern New York were included in a “slight risk” of excessive rainfall in the Weather Prediction Center (WPC) Day 2 Excessive Rainfall Outlook. This indicated a 10%-20% chance of rainfall rates exceeding the flash flood guidance over the one, three, or six hour intervals. Zone-average flash flood guidance was 2.00”-2.50” and 2.50”-3.00” for the one and three hour intervals with over 3.00” for six hour intervals. The image below shows WPC Day 2 Excessive Rainfall Outlook map.

Figure 13: Day 2 Excessive Rainfall Outlook from WPC issued 4:12 AM EDT on 17 June 2018. [click to enlarge]
The RAP 13 precipitable water (PW) analysis at 2 PM EDT showed a ribbon of enhanced PW values of 2.0 to 2.25 inches from the eastern Great Lakes into northern New York and Vermont, which are near climatological maximum values. PW represents the depth of water if all the water in the atmospheric column precipitated out as rain. PW values greater than 1.5 inches, suggest a greater potential for heavy rainfall, especially during the summertime. The rich atmospheric moisture interacted with several boundaries to produce multiple lines of showers and thunderstorms across the North Country. These thunderstorms produces very heavy rainfall rates with Massena, New York reporting 1.69 inches in one hour on Monday afternoon and over 2.96 inches of rainfall in two hours between 4:46 PM and 6:46 PM EDT on June 18th.

Figure 14: RAP13 precipitable water analysis at 2:00 PM EDT on 18 June 2018. [click to enlarge]
The image below shows a sounding climatology plot of PW at Albany, New York for the entire year, with a period of record from January 1, 1948 to October 26, 2014. The PW value from the 2:00 PM EDT Albany, NY sounding was 1.74 inches, which was just below the max moving average of 1.84 inches. From SPC, “the moving average lines represent a 91-day centered moving average, although a user can change the number of days to whatever he or she would like. The 91-day time period was chosen in order to smooth data over an approximate seasonal period.” The daily maximum PW value for June 18th at Albany per the plot is 2.17 inches.

Figure 15: Precipitable water climatology from all soundings at Albany, New York. [click to enlarge]
The plot below shows a 24 hour observed precipitation map from June 18th. This plot highlights the axis of heavy precipitation from near Massena, NY to Burlington, VT to just south of St. Johnsbury, VT. Observed rainfall within this axis of precipitation ranged between 1 and 3 inches. This area of heavy rainfall occurred because of multiple lines of thunderstorms training along several boundaries draped from northern New York into central Vermont.

Figure 16: 24 hour precipitation map from 12:00 PM EDT on June 18th to 12:00 PM EDT on June 19th. [click to enlarge]
Conclusion
A warm and moist air mass across the North Country on June 18th produced scattered wind damage, along with an axis of very heavy rainfall from northern New York into parts of central Vermont. The most concentrated area of damage occurred near Waitsfield, VT, where a NWS BTV storm survey determined a wet microburst occurred. Winds associated with this microburst were estimated between 60 and 80 mph, based on significant structural damage to a farmstead. In addition, an area of 3 to 4 dozen trees were uprooted or snapped off associated with this microburst, with other property damage occurring to a shed near Route 100 in Waitsfield. The damage path was 1.5 miles long and about a quarter mile wide. Other tree and power line damage was observed across northern New York and parts of central and southern Vermont during this event with up to 16,000 people without power in Vermont. The images below are damage photos taken by the NWS BTV survey team.
Damage photos from NWS BTV Storm Survey

View from front of collapsed hay barn 1 mile south-southeast of Waitsfield, VT. Photo courtesy of NWS BTV. [click to enlarge]

Backside view of collapsed hay barn 1 mile south-southeast of Waitsfield, VT. Photo courtesy of NWS BTV. [click to enlarge]

Cow barn with part of metal roof missing 1 mile south-southeast of Waitsfield, VT. Photo courtesy of NWS BTV. [click to enlarge]

Collapsed shed at home on Route 100 in Waitsfield, VT. Photo courtesy of NWS BTV. [click to enlarge]

Snapped pine trees 1 mile south-southeast of Waitsfield, VT. Photo courtesy of NWS BTV. [click to enlarge]

Tree damage near Waitsfield, VT, seen across valley about 1 mile away. Photo courtesy of NWS BTV. [click to enlarge]
References:
Fujita, T. T., 1981: Tornadoes and downbursts in the context of generalized planetary scales. J. Atmos. Sci., 38,1511–1534.
Radar imagery provided by GR2Analyst, Gibson Ridge Software Company.
Satellite imagery provided by the Regional and Mesoscale Meteorology Branch (RAMMB)/Cooperative Institute for Research in the Atmosphere (CIRA) Satellite Loop Interactive Data Explorer in Real-time (SLIDER) web application: http://www.rammb-slider.cira.colostate.edu
Figures 2, 5, 6, 14 and 15 provided by Storm Prediction Center Website: http://www.spc.noaa.gov/
Figures 4 and 14 provided by Weather Prediction Center Website: http://www.wpc.ncep.noaa.gov/


 Follow us on YouTube