Above Average Temperatures Get Blown Away by Arctic BlastHeavy Rainfall, Flooding, and High Winds 12/01/06 |
|
|
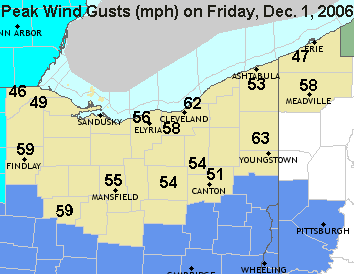
The end of November felt more like spring with temperatures for a week straight at or above 60 degrees and a 10 day stretch of no precipitation with high pressure parked over the area. Cleveland, at Hopkins Airport, had eight days where the average temperature for the day was 10 or more degrees above normal. There were even two days, November 26th and 29th that were 20 and 23 degrees above normal, respectively. Records were broken at Toledo (66) on Wednesday, the 29th and Mansfield (65) and Youngstown (65) on Sunday, the 26th. Overall, the month of November ended up 2 to 3 degrees above normal. That had to change sooner or later. A strong system was developing across the Rockies and was tracking east across the country, creating weather troubles across the Midwest. When the cold front began to move across northern Ohio Wednesday night and Thursday morning, low pressure developed and deepened along the front and surged warm air northward again into northeast Ohio and northwest Pennsylvania Friday morning. Finally, the system departed the area and with it winds gusted over 60 mph and temperatures fell 20 to 25 degrees by evening. Wind damage was reported area wide with numerous trees and power lines down.
The ground was prepped with a half inch to an inch and a half of rain on Thursday making any additional rainfall a flooding hazard. On Friday, an additional inch and a half to two and a half inches fell over the Maumee, Portage, Sandusky, Blanchard, Huron, Black River basins flooding many places along those rivers.
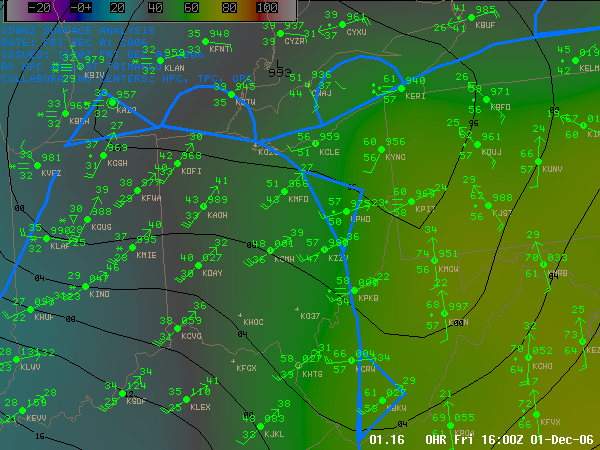
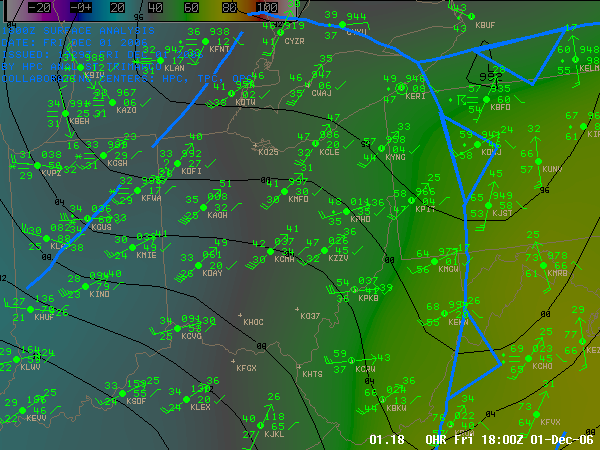
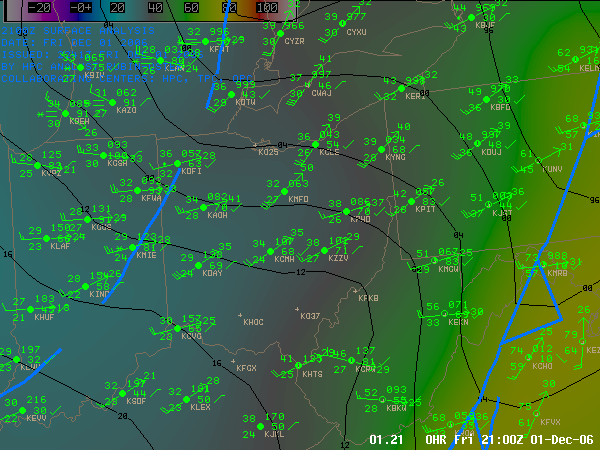
The following three images depict the warm and cold frontal progressions across the region. Temperatures are in green in the upper left hand portion of the observation. Wind gusts, when observed, are at the head of the arrow pointing away from the wind barb. The times for the images are 11 am, 1 pm, and 4 pm, respectively.
|
National Weather Service - Climate Data
Please note this information is preliminary and subject to revision. Official and certified climatic data can be
accessed at the National Climatic Data Center (NCDC)
(https://www.ncdc.noaa.gov/oa/ncdc.html).


 CLIMATE REPORT
 NATIONAL WEATHER SERVICE CLEVELAND OH
 1227 AM EST FRI DEC 1 2006

 ...................................

 ...THE CLEVELAND CLIMATE SUMMARY FOR THE MONTH OF NOVEMBER 2006...

 CLIMATE NORMAL PERIOD 1971 TO 2000
 CLIMATE RECORD PERIOD 1871 TO 2006

 WEATHER         OBSERVED          NORMAL  DEPART
                  VALUE   DATE(S)  VALUE   FROM
                                           NORMAL
 ................................................
 TEMPERATURE (F)
 HIGHEST            66   11/09
 LOWEST             23   11/04
 AVG. MAXIMUM     52.5
 AVG. MINIMUM     37.3
 MEAN             44.9                       3.1
 DAYS MAX >= 90      0
 DAYS MAX <= 32      0
 DAYS MIN <= 32      7
 DAYS MIN <= 0       0

 PRECIPITATION (INCHES)
 TOTALS           3.40                      0.02
 DAYS >= .01         8
 DAYS >= .10         5
 DAYS >= .50         2
 DAYS >= 1.00        1
 GREATEST
  24 HR. TOTAL    1.47   MM

 SNOWFALL (INCHES)
 TOTALS            1.4
 SINCE 7/1         1.4
 GREATEST
  24 HR TOTAL      0.9   MM

 DEGREE_DAYS
 HEATING TOTAL     594               672     -78
  SINCE 7/1       1155              1169     -14
 COOLING TOTAL       0                 1      -1
  SINCE 1/1        710               712      -2
 .................................................

 WIND (MPH)
 AVERAGE WIND SPEED              8.3
 HIGHEST WIND SPEED/DIRECTION    26/200
 HIGHEST GUST SPEED/DIRECTION    32/200


 WEATHER CONDITIONS. NUMBER OF DAYS WITH
 THUNDERSTORM              0     MIXED PRECIP               1
 HEAVY RAIN                2     RAIN                       6
 LIGHT RAIN                8     FREEZING RAIN              0
 LT FREEZING RAIN          0     HAIL                       0
 HEAVY SNOW                0     SNOW                       1
 LIGHT SNOW                4     SLEET                      0
 FOG                      16     FOG W/VIS <= 1/4 MILE      2
 HAZE                     12

 -  INDICATES NEGATIVE NUMBERS.
 R  INDICATES RECORD WAS SET OR TIED.
 MM INDICATES DATA IS MISSING.
 T  INDICATES TRACE AMOUNT.


 Follow us on YouTube