On average, 27 people are killed and nearly 250 people are injured annually from cloud-to-ground (CG) lightning flashes across the United States. Each year, CG lightning also aides in initiating wildfires that account for around 3.8 million acres of land burned, which is around 35 percent more acres burned than human-caused wildfires. Additionally, thunderstorms can contribute to substantial delays for commercial flights across the U.S. National Airspace System. Lightning can also threaten people attending outdoor events and other recreational activities.
Location-based climatology information about lightning may be beneficial to those potentially impacted by thunderstorms. In order to provide a robust visualization of lightning climatology across the country, this product displays lightning flash "heatmaps," which are matrix-style displays for specific locations. These heatmaps are derived from 30 years of archived CG flash data and are intended to inform interested users on their spatial and temporal lightning climatology risk.
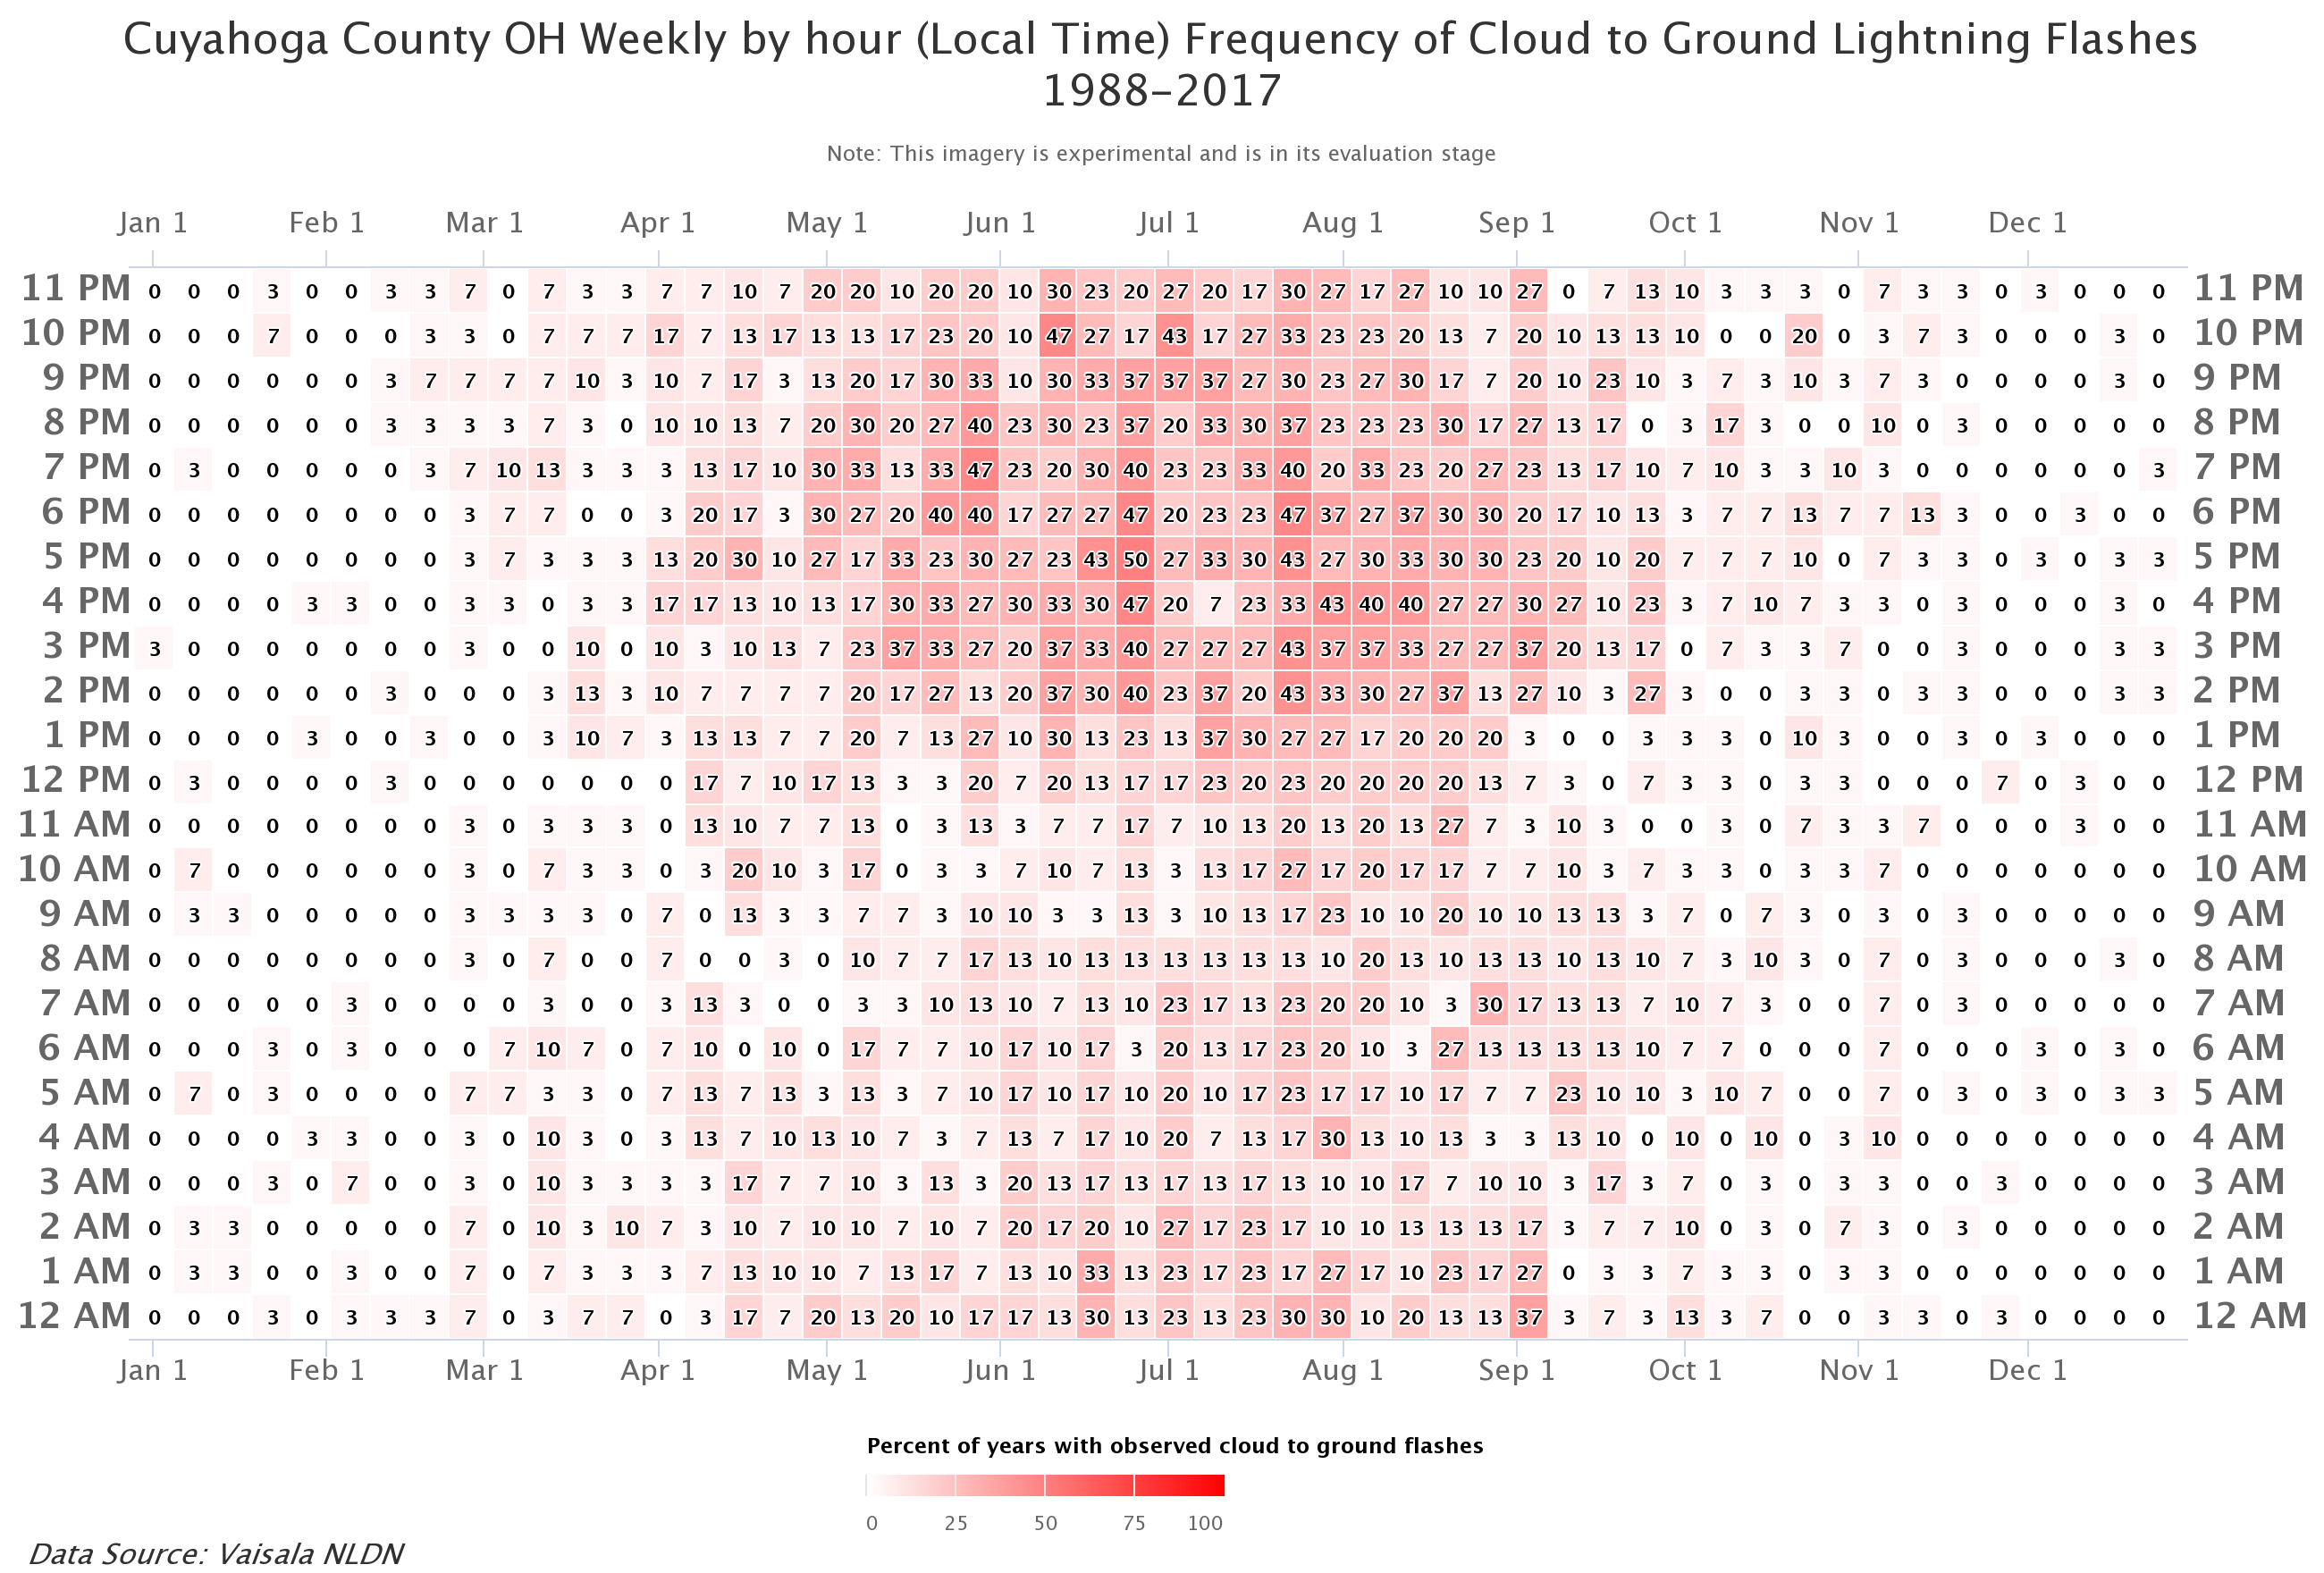
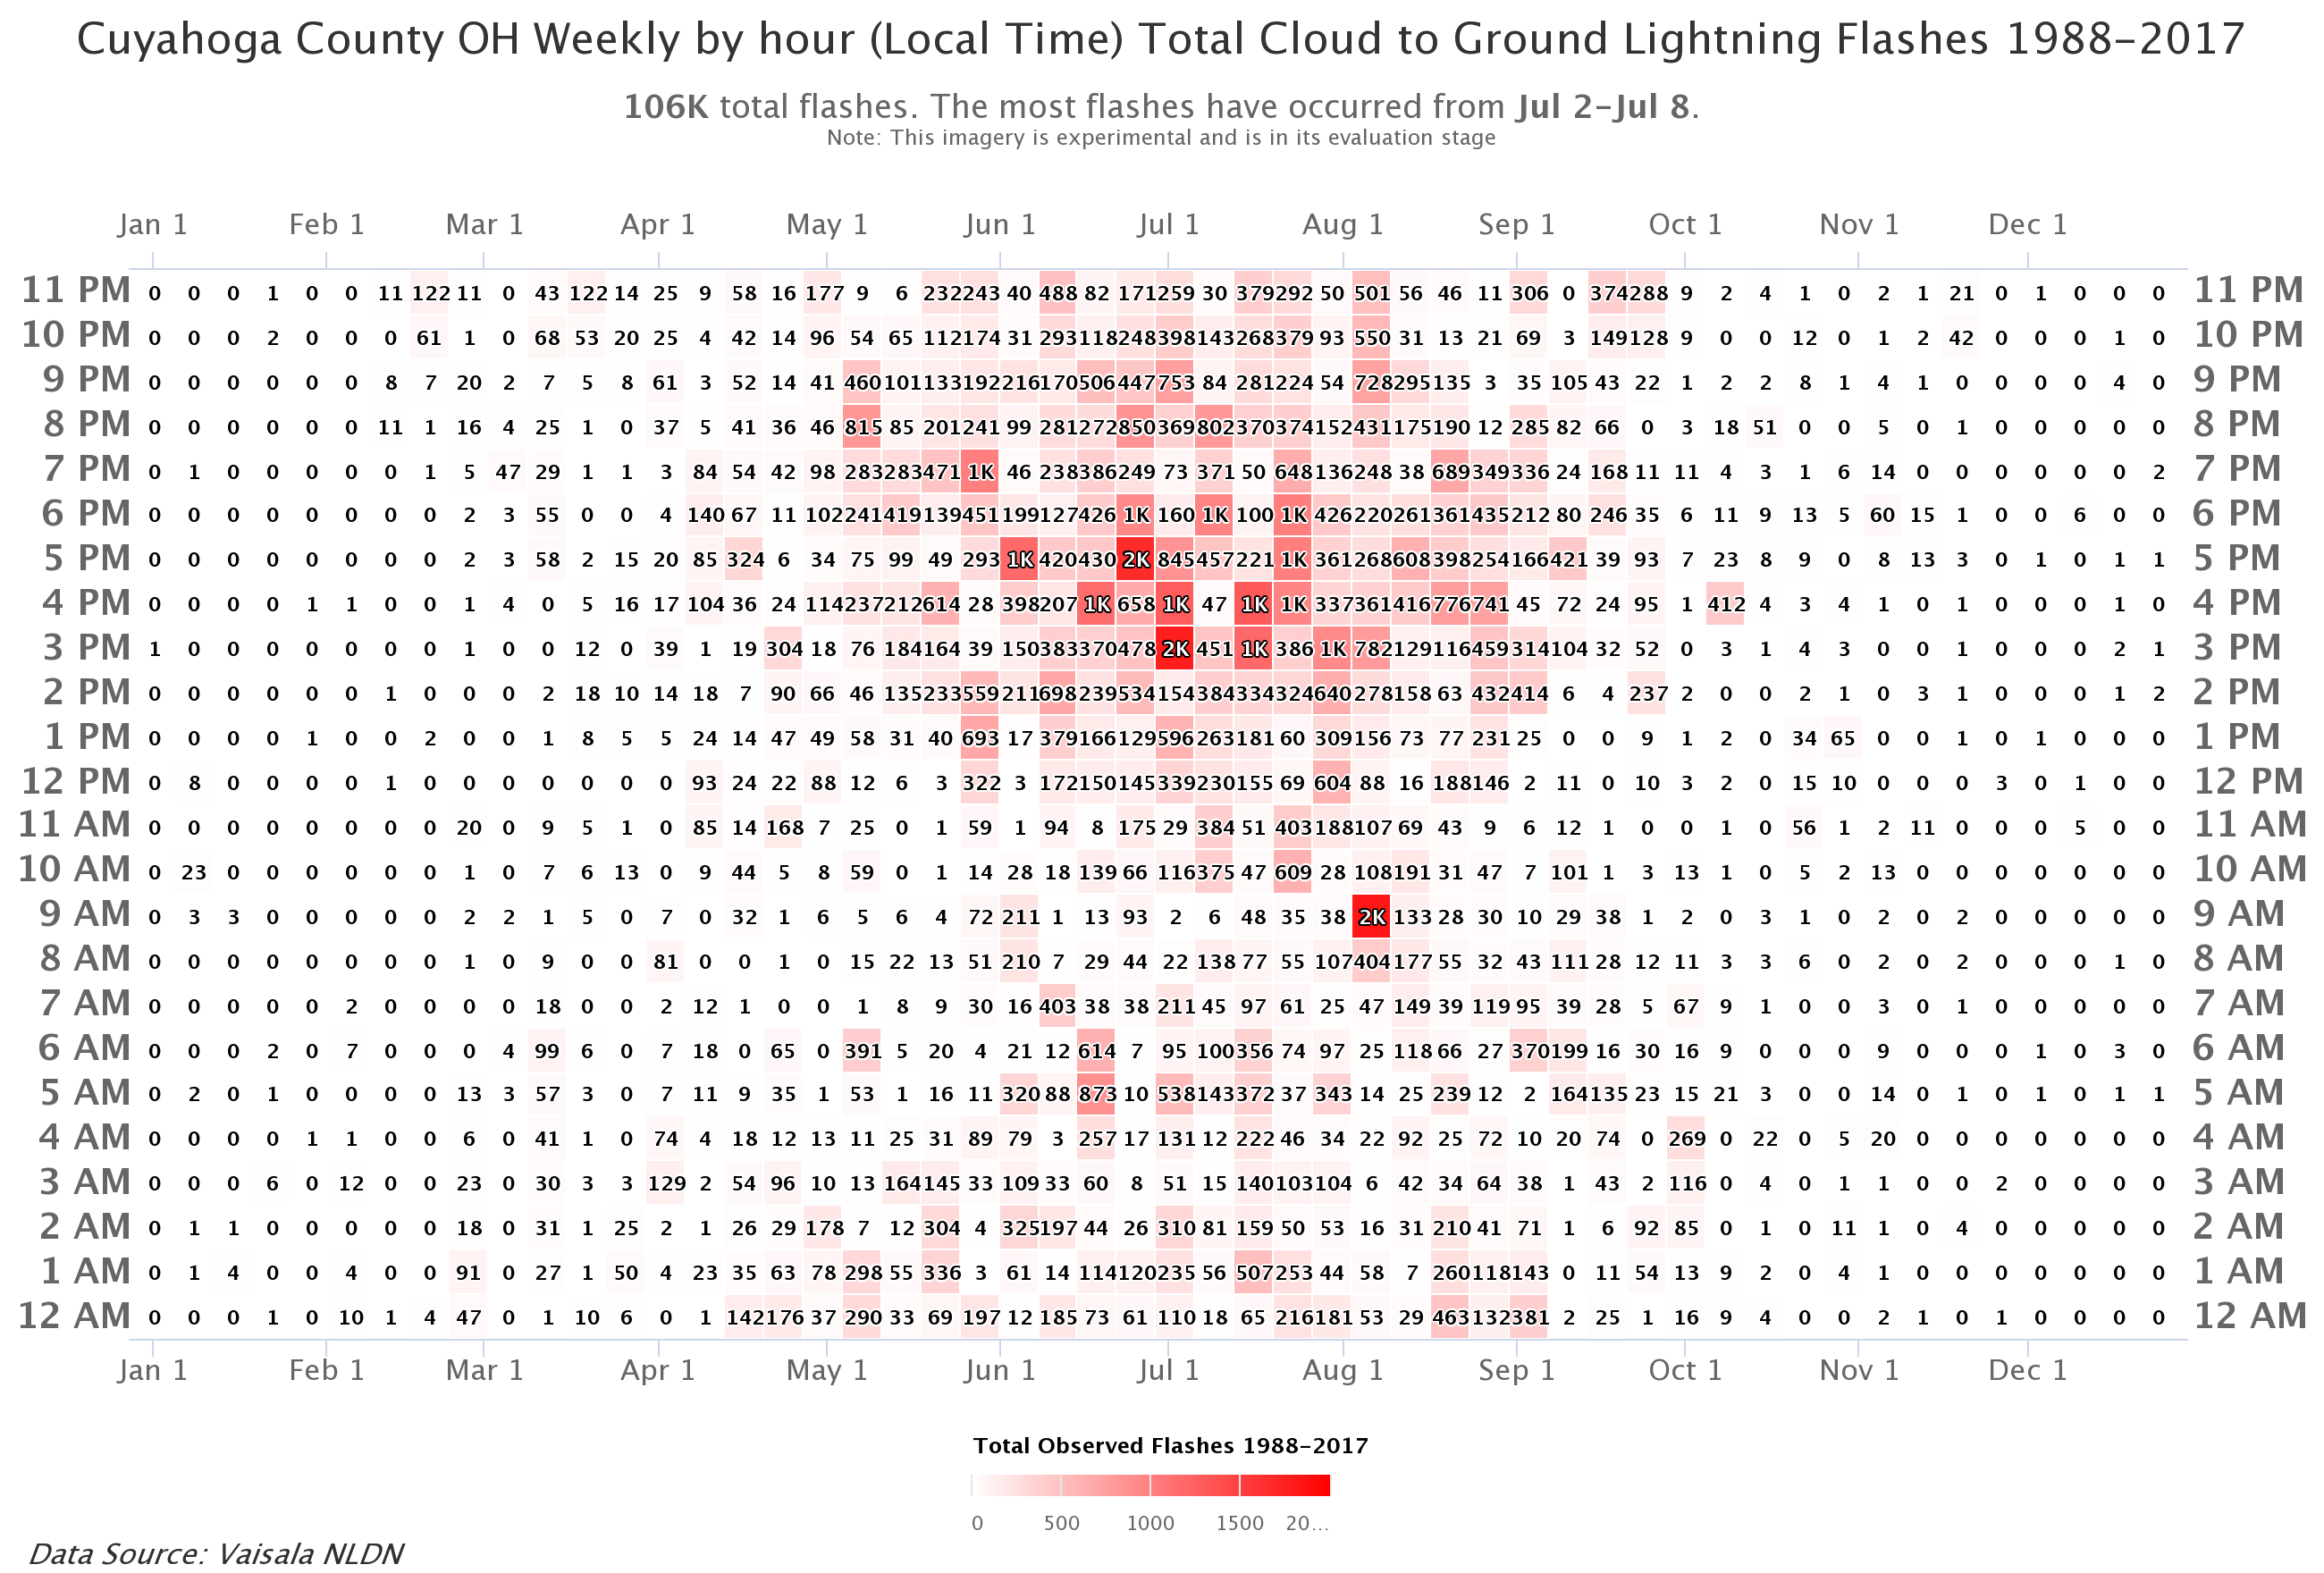
This product provides two different types of heatmaps for three different types of selectable mapping layers. Users can choose to view a heatmap of CG flash frequency for each hour of the day, for weekly ranges throughout an average year, as well as a heatmap for the total number of CG flashes for that location for each hour of the day, for weekly ranges throughout an average year.
Users can select either specific counties/parishes, NWS fire weather zones, or 10-mile radius areas surrounding airports to view the two types of lightning climatology heatmaps.
Please see NWS Product Description Document (PDD) for more details:
https://nws.weather.gov/products/PDD/PDD_ExpLightningClimatology_2019.pdf
Experimental lightning climatology imagery can be accessed from a mobile-friendly National Oceanic and Atmospheric Administration (NOAA) ArcGIS online mapping application found at the following URL:
Users are encouraged to provide feedback on this experimental service by using the brief survey and comment form available online at:
https://www.surveymonkey.com/r/LightningClimatology
Examples for Cuyahoga County OH:


 Follow us on YouTube