Summer 2019 Climate Summaries
and fall 2019 Outlook
summer defined as June, July and August
fall defined as September, October and November
|
For the full details check out: Click here For a larger view of the Duluth, Minnesota temperature graph provided by the Midwestern Regional Climate Center: Click here |
|
For the full details check out: Click here For a larger view of the International Falls, Minnesota temperature graph provided by the Midwestern Regional Climate Center: Click here |
|
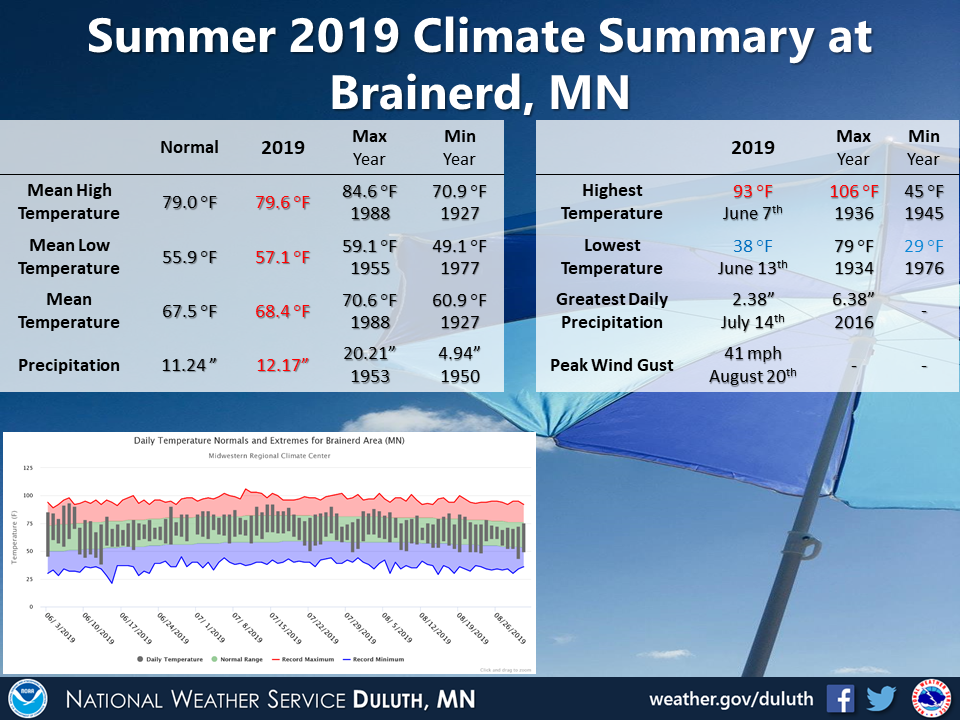
For the full details check out: Click here For a larger view of the Brainerd, Minnesota temperature graph provided by the Midwestern Regional Climate Center: Click here |
|
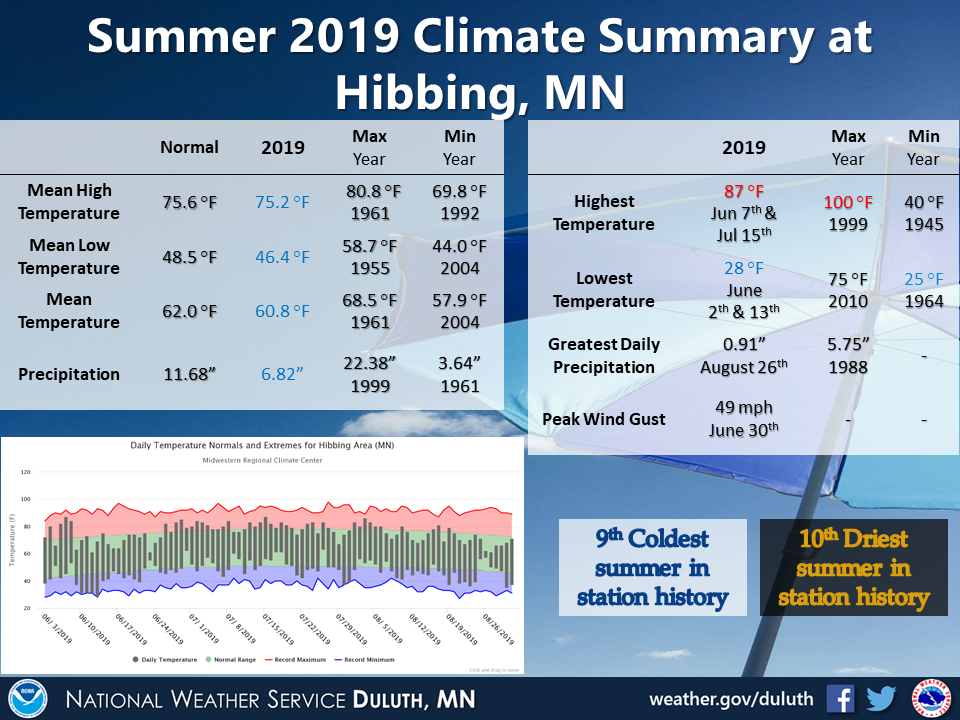
For the full details check out: Click here For a larger view of the Hibbing, Minnesota temperature graph provided by the Midwestern Regional Climate Center: Click here |
|
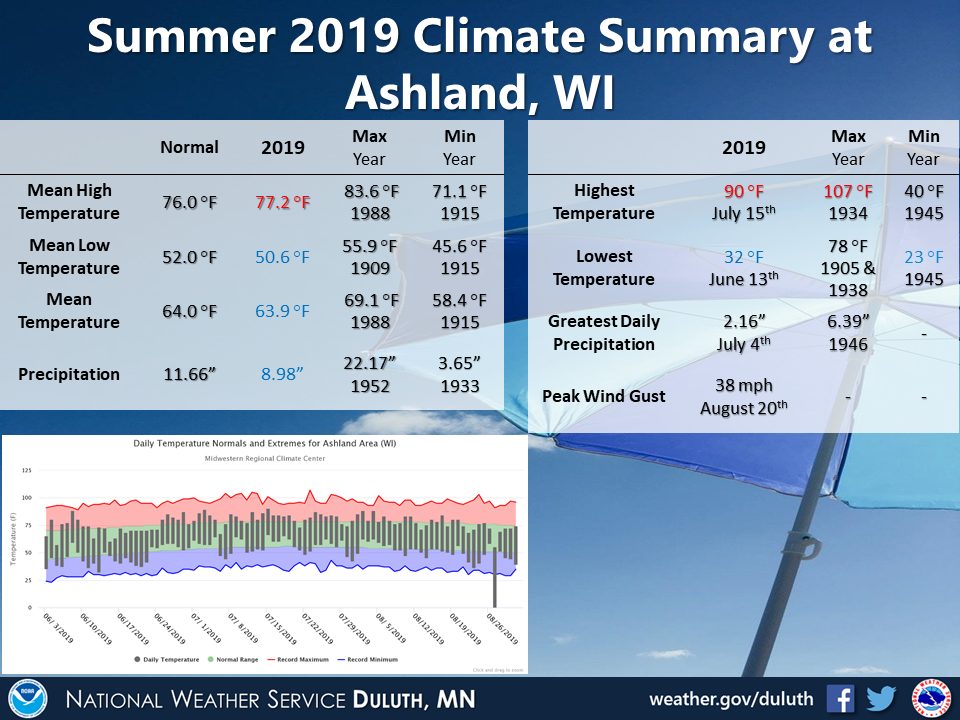
For the full details check out: Click here For a larger view of the Ashland, Wisconsin temperature graph provided by the Midwestern Regional Climate Center: Click here |
Fall 2019 Climate Outlook
(Fall defined as September, October and November)
| Temperature Outlook | Precipitation Outlook |
  |
  |
|
Normal highs for Duluth, Minnesota start in the low 70s in early September and cool to the low 30s by the end of November. Normal lows start in the mid 50s in early September and cool to the upper teens by the end of November. Normal precipitation for the fall is 8.17 inches. Normal snowfall for the fall is 16.1 inches. Normal highs for International Falls, Minnesota start in the low 70s in early September and cool to the mid 20s by the end of November. Normal lows start in the upper 40s and cool to the single digits above zero by late November. Normal precipitation for the fall is 6.45 inches. Normal snowfall for the fall is 16.0 inches. Normal highs for Brainerd, Minnesota start in the mid 70s in early September and by the end of November normal highs cool to the low 30s. Normal lows start in the low 50s and cool to the mid teens by late November. Normal precipitation for the fall is 7.65 inches. Normal snowfall for the fall is 8.8 inches. Normal highs for Hibbing, Minnesota start in the low 70s in early September and by the end of November normal highs cool to the mid to upper 20s. Normal lows start in the mid 40s in early September and cool to the single digits above zero by late November. Normal highs for Ashland, Wisconsin start in the mid 70s in early September and by the end of November normal highs cool to the low 30s. Normal lows start in the upper 40s in early September and cool to the mid teens by late November. For all locations the latest Climate Prediction Center (CPC) outlook indicates that odds are tilted toward above normal temperatures and slightly tilted toward above normal precipitation. |
|
Duluth, MN
Meteorological fall defined as September, October and November
|
Normals for the fall season |
|
|
The Normal, Seasonal Average Temperature (degrees F) |
42.5 |
|
|
|
|
Normal Seasonal Precipitation (inches) |
8.17 |
|
Normal Seasonal Snowfall (inches) |
16.1 |
|
|
|
|
Normal Heating Degree Days |
2063 |
|
Normal Cooling Degree Days |
15 |
|
|
|
|
Records for the fall season |
|
|
Warmest Season (Seasonal Average Temperature) |
49.9 in 1963 |
|
Coldest Season (Seasonal Average Temperature) |
37.7 in 1959 |
|
|
|
|
Greatest Seasonal Precipitation (inches) |
17.74 in 1881 |
|
Least Seasonal Precipitation (inches) |
1.97 in 1952 |
|
|
|
|
Greatest Seasonal Snowfall (inches) |
56.8 in 1991 |
|
Least Seasonal Snowfall (inches) |
0.2 in 1899 |
International Falls, MN
Meteorological fall defined as September, October and November
|
Normals for the fall season |
|
|
The Normal, Seasonal Average Temperature (degrees F) |
40.1 |
|
|
|
|
Normal Seasonal Precipitation (inches) |
6.45 |
|
Normal Seasonal Snowfall (inches) |
16.0 |
|
|
|
|
Normal Heating Degree Days |
2280 |
|
Normal Cooling Degree Days |
11 |
|
|
|
|
Records for the fall season |
|
|
Warmest Season (Seasonal Average Temperature) |
48.3 in 1920 |
|
Coldest Season (Seasonal Average Temperature) |
32.8 in 1926 |
|
|
|
|
Greatest Seasonal Precipitation (inches) |
12.09 in 1965 |
|
Least Seasonal Precipitation (inches) |
1.79 in 1952 |
|
|
|
|
Greatest Seasonal Snowfall (inches) |
33.5 in 1955 |
|
Least Seasonal Snowfall (inches) |
Trace in 1999 |
Brainerd, MN
Meteorological fall defined as September, October and November
|
Normals for the fall season |
|
|
The Normal, Seasonal Average Temperature (degrees F) |
44.6 |
|
|
|
|
Normal Seasonal Precipitation (inches) |
7.65 |
|
Normal Seasonal Snowfall (inches) |
8.8 |
|
|
|
|
Normal Heating Degree Days |
1888 |
|
Normal Cooling Degree Days |
31 |
|
|
|
|
Records for the fall season |
|
|
Warmest Season (Seasonal Average Temperature) |
50.4 in 1963 |
|
Coldest Season (Seasonal Average Temperature) |
36.3 in 1919 |
|
|
|
|
Greatest Seasonal Precipitation (inches) |
12.69 in 1971 |
|
Least Seasonal Precipitation (inches) |
0.84 in 1976 |
|
|
|
|
Greatest Seasonal Snowfall (inches) |
28.5 in 1983 |
|
Least Seasonal Snowfall (inches) |
T in Multiple Years |
Hibbing, MN
Meteorological fall defined as September, October and November
|
Normals for the fall season |
|
|
The Normal, Seasonal Average Temperature (degrees F) |
39.9 |
|
|
|
|
Normal Heating Degree Days |
2292 |
|
Normal Cooling Degree Days |
9 |
|
|
|
|
Records for the fall season |
|
|
Warmest Season (Seasonal Average Temperature) |
47.1 in 1953 |
|
Coldest Season (Seasonal Average Temperature) |
35.8 in 1993 |
Ashland, WI
Meteorological fall defined as September, October and November
|
Normals for the fall season |
|
|
The Normal, Seasonal Average Temperature (degrees F) |
44.2 |
|
|
|
|
Normal Heating Degree Days |
1915 |
|
Normal Cooling Degree Days |
23 |
|
|
|
|
Records for the fall season |
|
|
Warmest Season (Seasonal Average Temperature) |
50.8 in 1931 |
|
Coldest Season (Seasonal Average Temperature) |
40.2 in 1951 |


 Follow us on YouTube