| Climate/Almanac Data - Feb Normals - Feb Records |
| |
| FEBRUARY |
| |
|
Site
(Click site name for report)
|
Avg
Temp |
Normal |
Dept
From
Norm |
Precip
Total |
Normal |
Dept
From
Norm |
Snowfall
Total |
Normal |
Dept
From
Norm |
| Burlington |
25.0° |
30.1° |
-5.1° |
2.01" |
1.62" |
+0.39" |
NA |
6.5" |
NA |
| Cedar Rapids |
17.4° |
24.4° |
-7.0° |
1.99" |
1.22" |
+0.77" |
NA |
6.9" |
NA |
| Davenport |
21.4° |
26.1° |
-4.7° |
3.81" |
1.34" |
+2.47" |
9.7" |
NA |
NA |
| Dubuque |
17.5° |
23.7° |
-6.2° |
3.30" (6) |
1.44" |
+1.86" |
19.1" (7) |
9.0" |
+10.1" |
| Iowa City |
20.1° |
26.3° |
-6.2° |
2.69" |
1.24" |
+1.45" |
NA |
NA |
NA |
| Moline |
24.1° |
27.0° |
-3.1° |
3.72" (5) |
1.60" |
+2.12" |
8.8" |
6.8" |
+2.0" |
The ranking is listed in parentheses (__) when within the "Top 10".
|
| |
| February 2019 was about 3 to 7 degrees below normal. |
| Precipitation totals for February 2019 were about 0.5 to 2.5 inches above normal. |
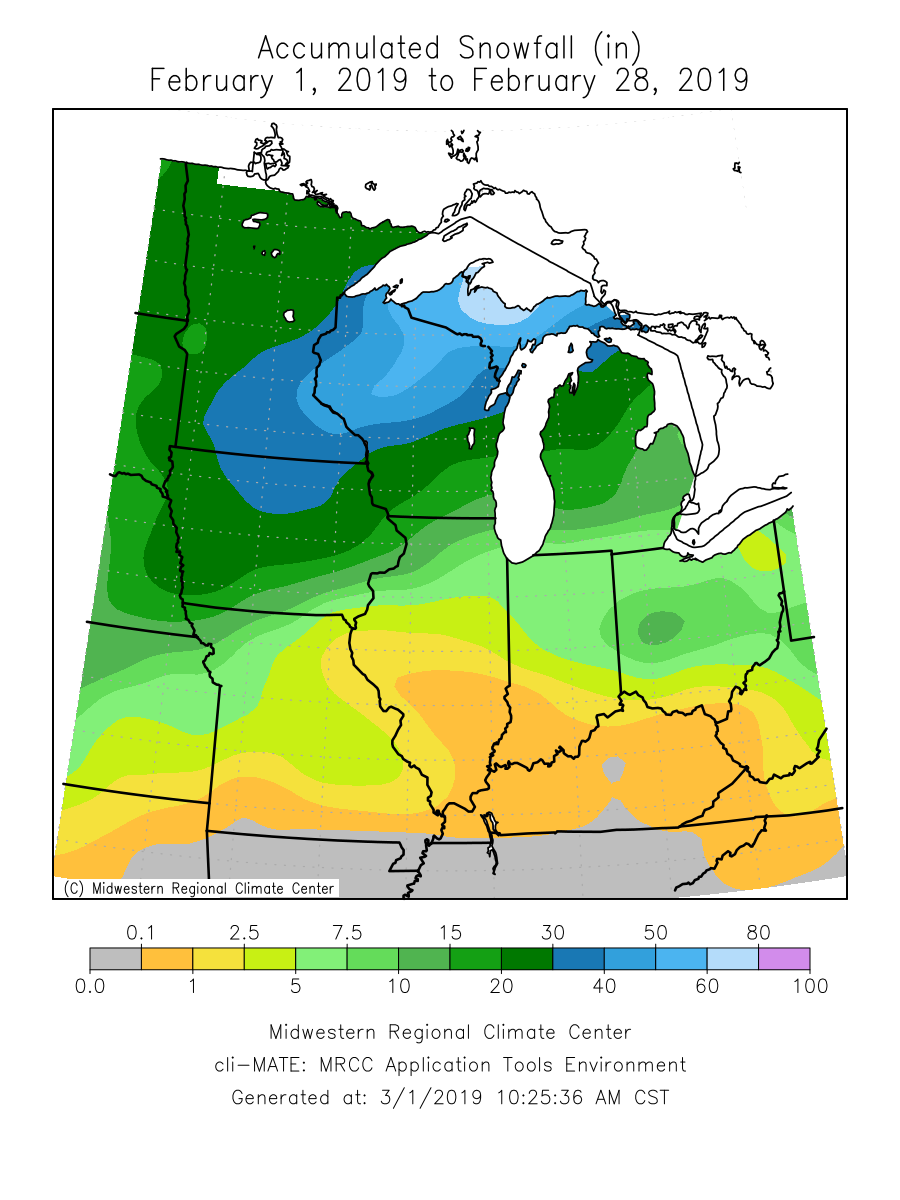
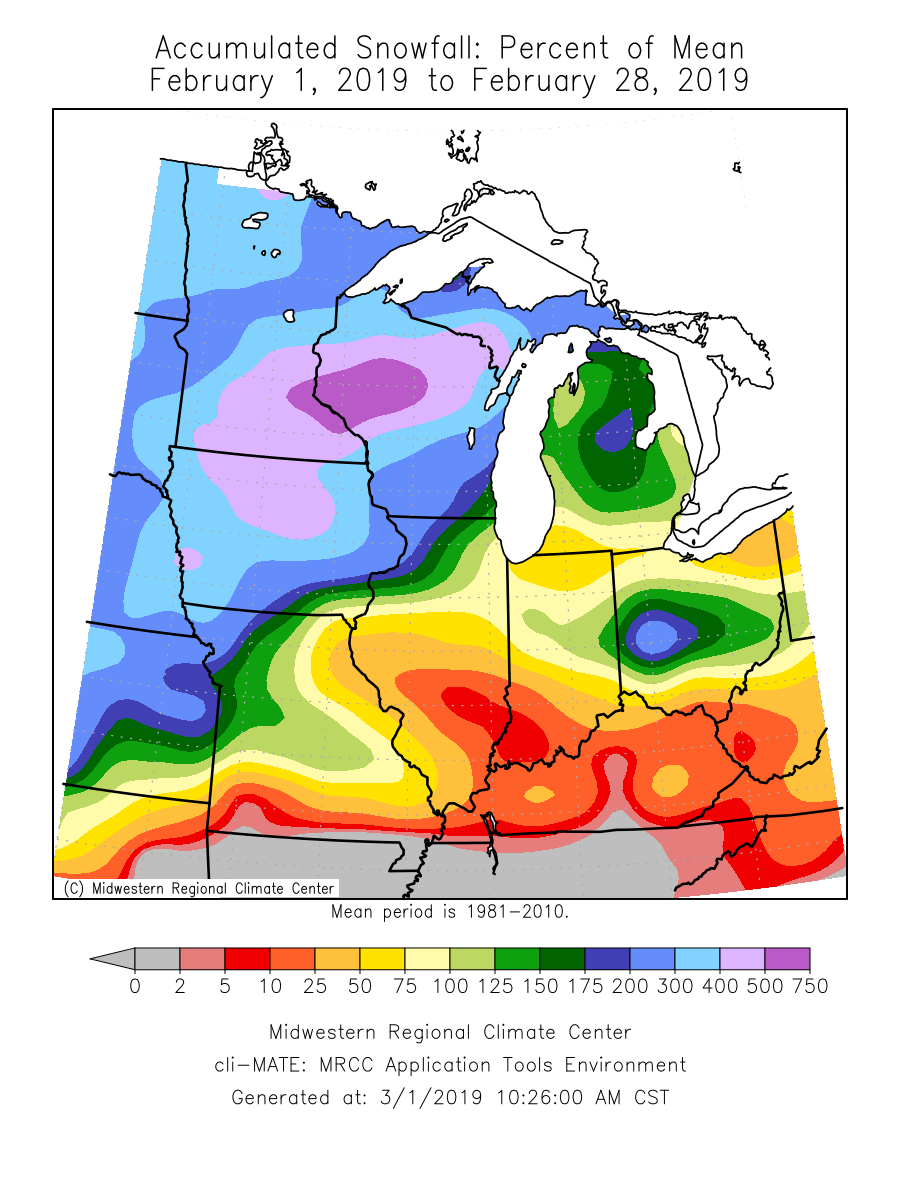
| Snowfall totals for February 2019 were about 2 to 10 inches above normal. |
| Please see Feb Records for monthly record information. |
| |
| |
| The climate maps below are courtesy of the Midwest Regional Climate Center. |
| These maps become available around 10am on the first of the month. |
| |
Average
Temperature |
Average
Temperature
Departure from Mean |
Accumulated
Precipitation |
Accumulated
Precipitation
Percent of Mean |
Accumulated
Snowfall |
Accumulated
Snowfall
Percent of Mean |
 |
 |
 |
 |
 |
 |
|
| |
| |
| |
| |
| |
| Climate/Almanac Data - Winter Normals - Winter Records |
| |
WINTER
(DEC-FEB) |
| |
|
Site
(Click site name for report courtesy of the
Iowa Environmental Mesonet.)
|
Avg
Temp |
Normal |
Dept
From
Norm |
Precip
Total |
Normal |
Dept
From
Norm |
Snowfall
Total |
Normal |
Dept
From
Norm |
| Burlington |
26.6° |
28.3° |
-1.7° |
6.79" |
4.95" |
+1.84" |
NA |
20.7" |
NA |
| Cedar Rapids |
21.0° |
22.4° |
-1.4° |
4.81" |
3.56" |
+1.25" |
NA |
20.9" |
NA |
| Davenport |
23.7° |
24.1° |
-0.4° |
8.94" |
4.26" |
+4.68" |
38.5" |
NA |
NA |
| Dubuque |
20.8° |
21.7° |
-0.9° |
8.19" (3) |
4.45" |
+3.74" |
45.5" |
30.8" |
+14.7" |
| Iowa City |
23.3° |
24.5° |
-1.2° |
6.58" |
3.68" |
+2.90" |
NA |
NA |
NA |
| Moline |
25.6° |
25.4° |
+0.2° |
9.63" (3) |
5.27" |
+4.36" |
40.1" (9) |
25.5" |
+14.6" |
|
|
The ranking is listed in parentheses (__) when within the "Top 10".
|
| |
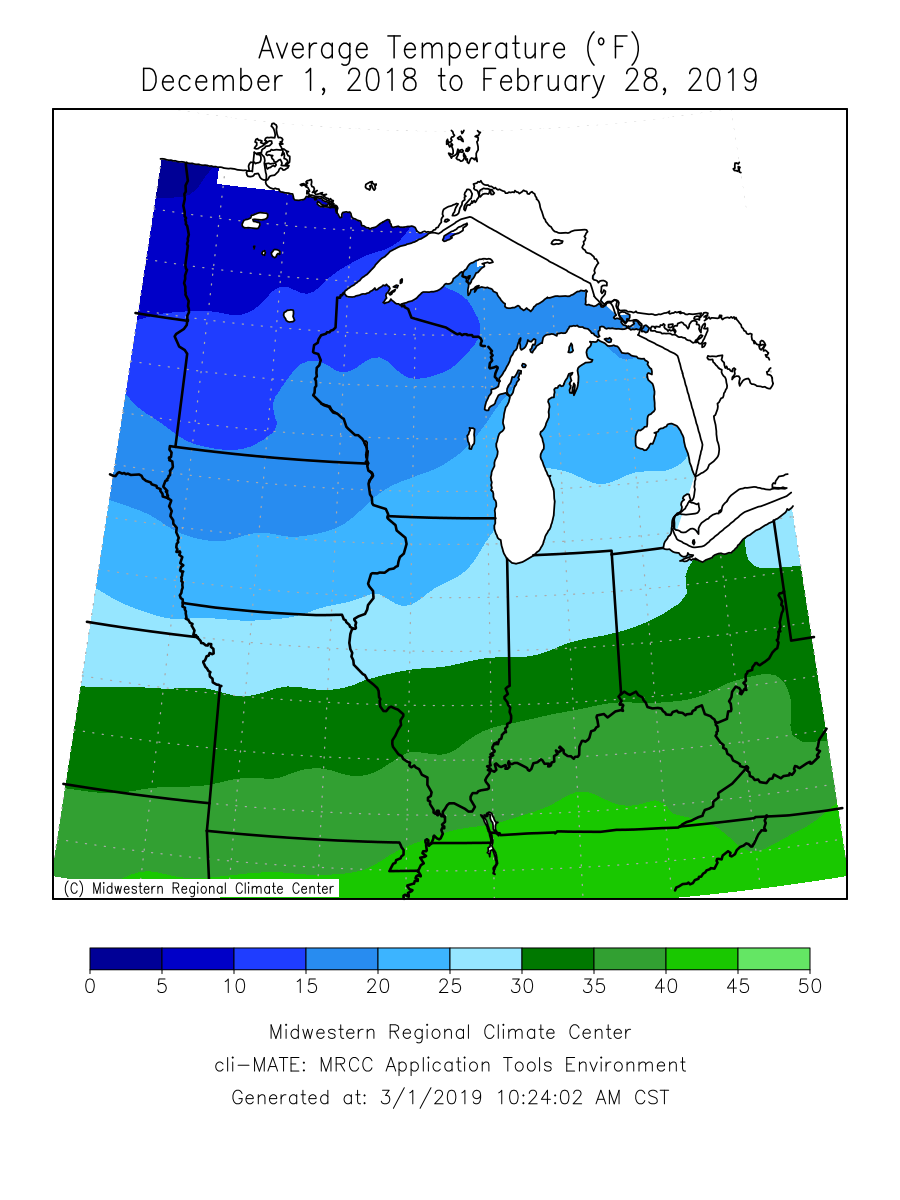
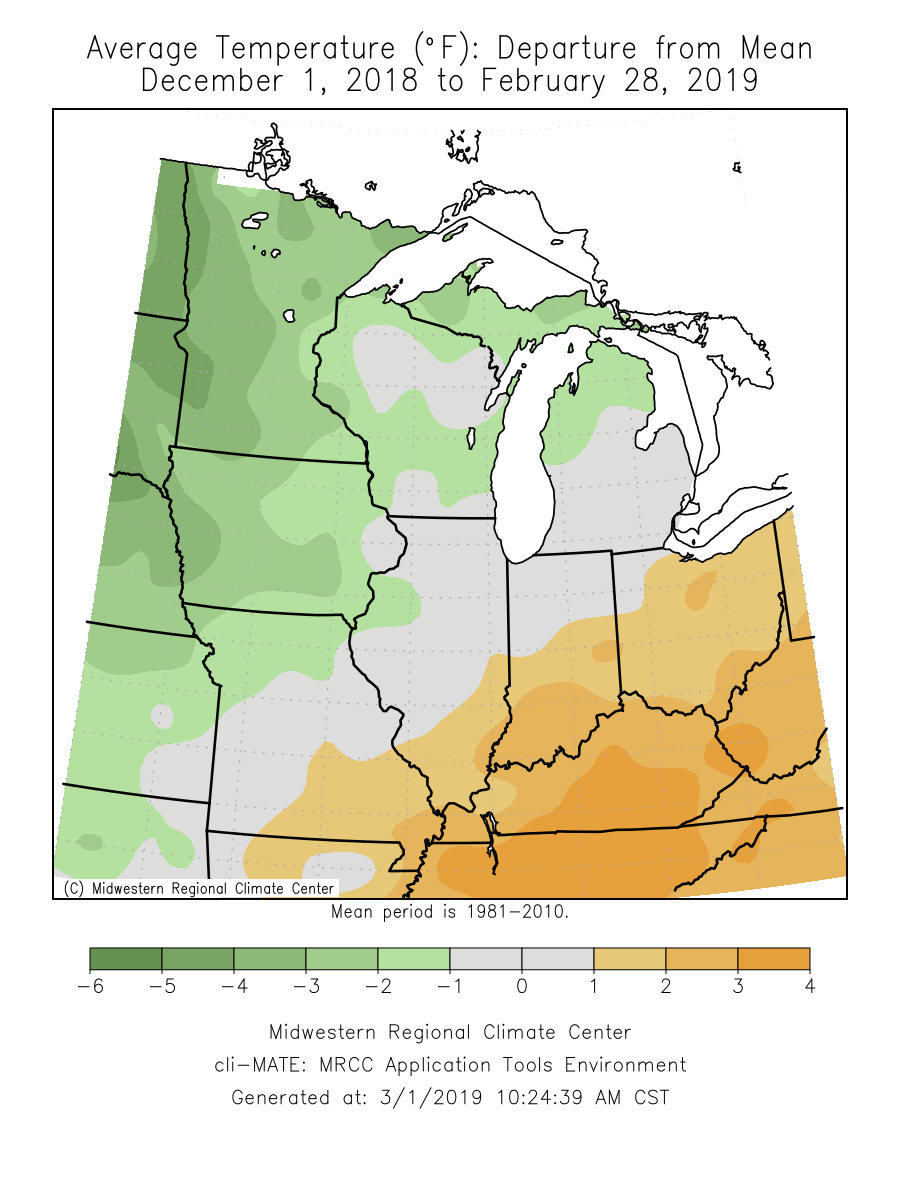
| Winter 2018-2019 was about normal to 1.5 degrees below normal. |
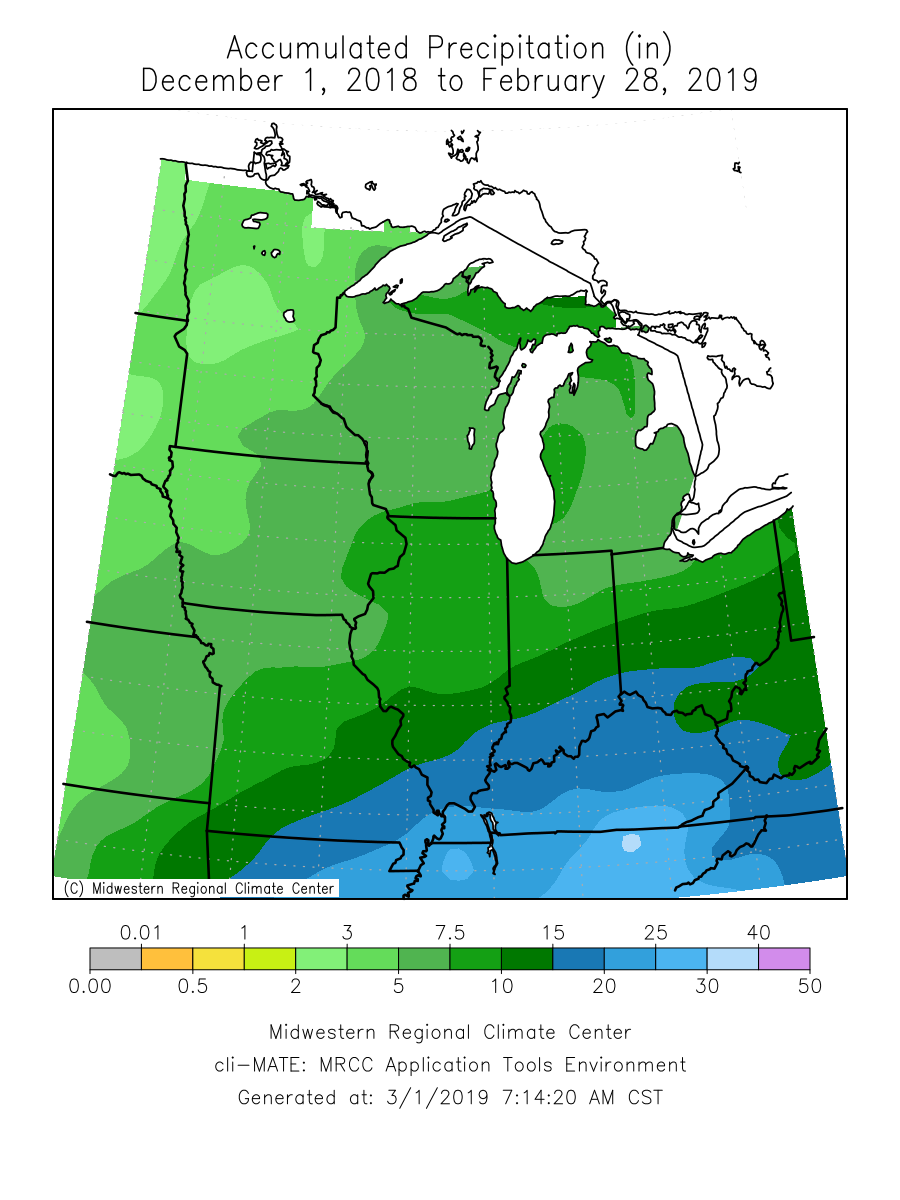
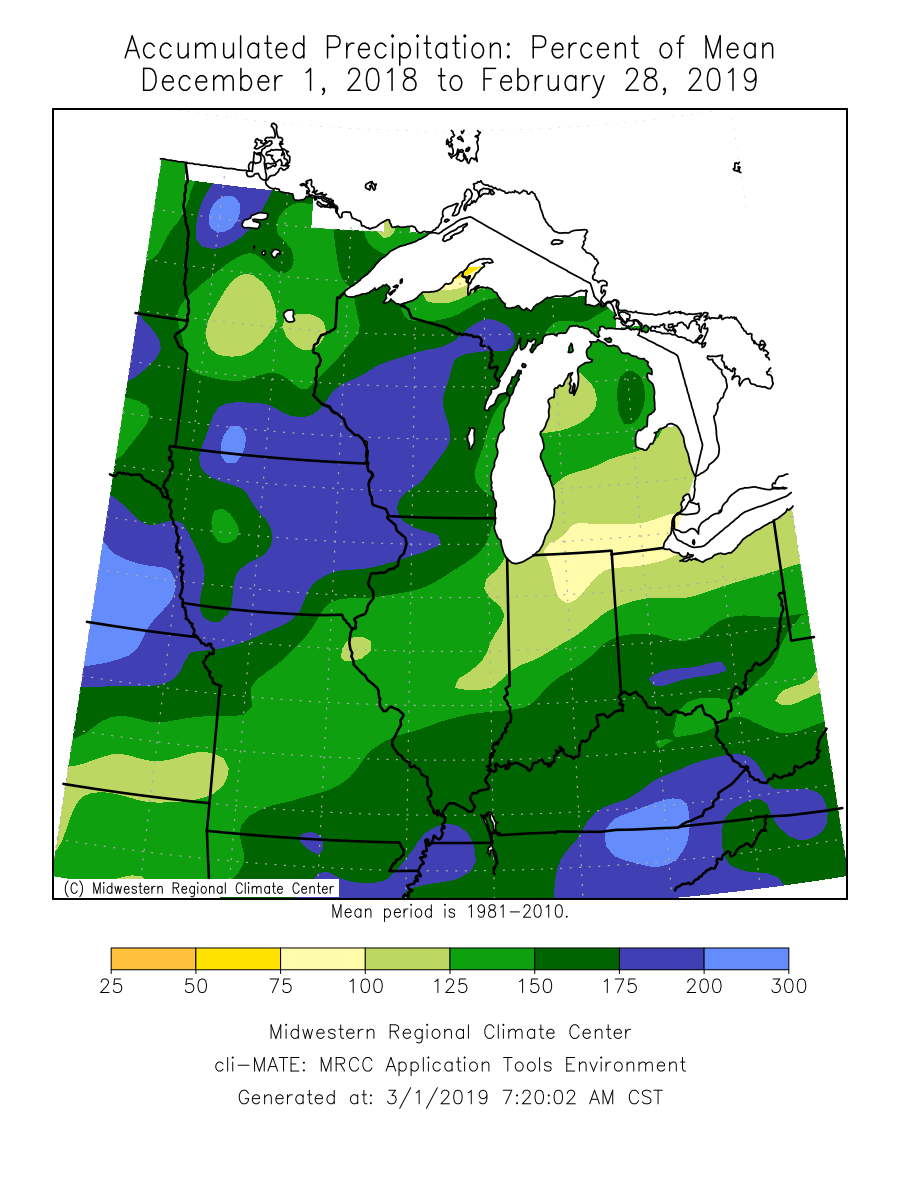
| Precipitation totals for Winter 2018-2019 were about 1 1/4 to 4 3/4 inches above normal. |
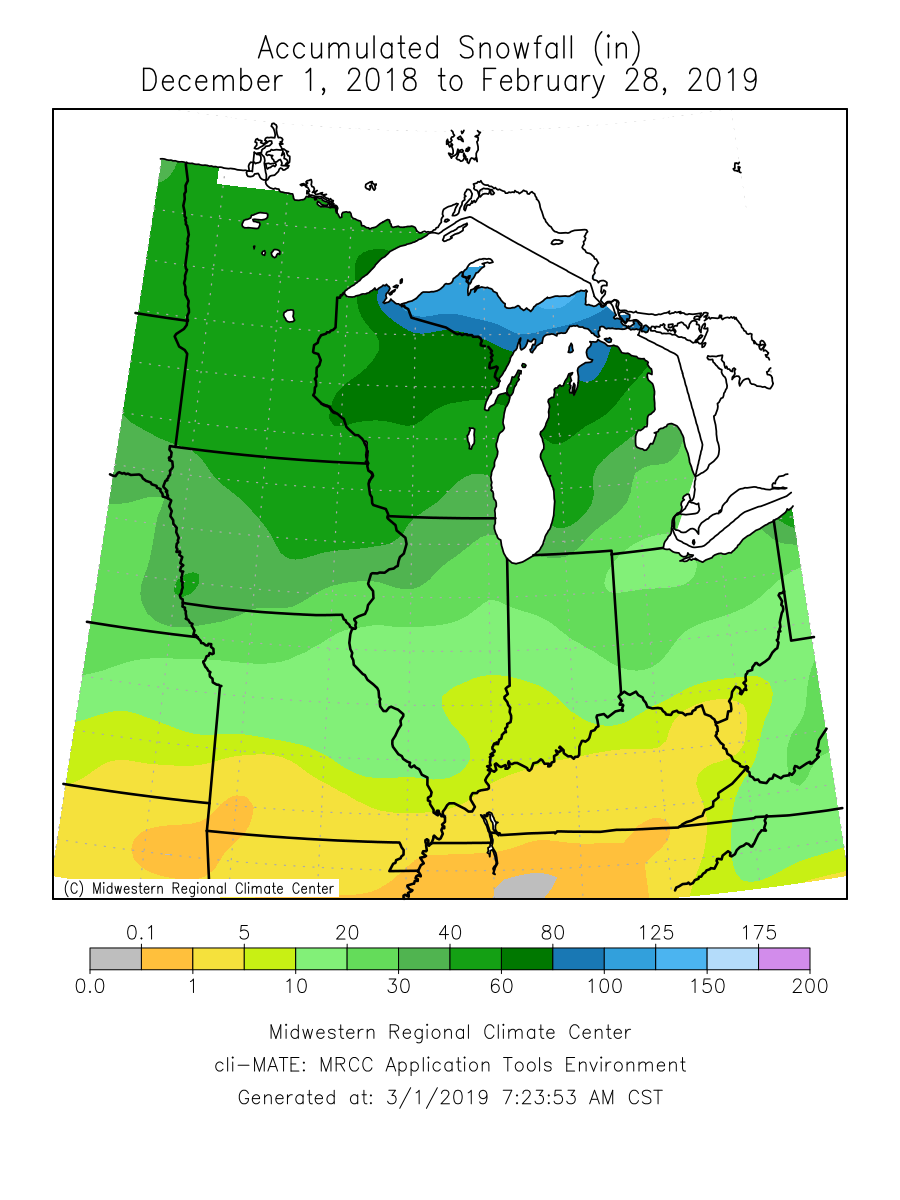
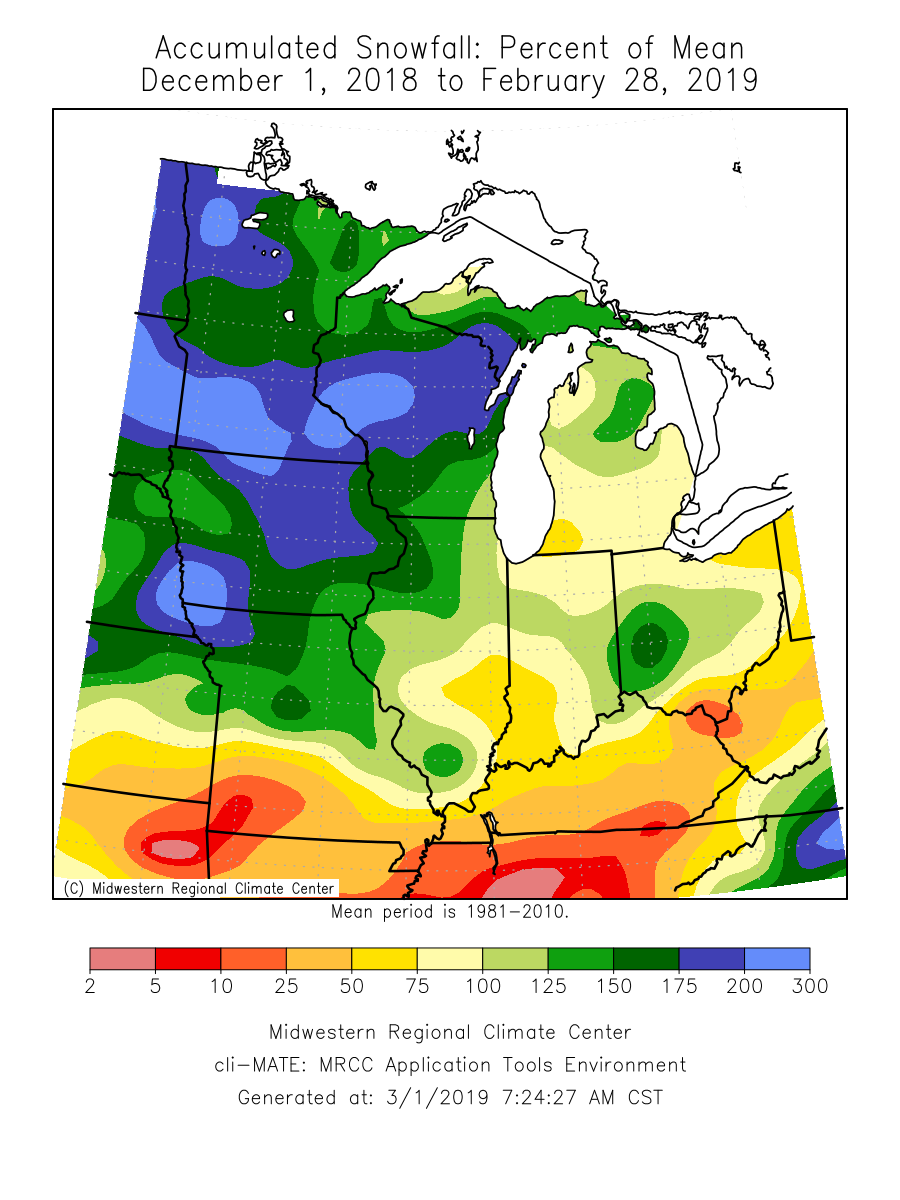
| Snowfall totals for Winter 2018-2019 were about 14-15 inches above normal. |
| Please see Winter Records for seasonal record information. |
| |
| |
| The climate maps below are courtesy of the Midwest Regional Climate Center. |
| |
Average
Temperature |
Average
Temperature
Departure from Mean |
Accumulated
Precipitation |
Accumulated
Precipitation
Percent of Mean |
Accumulated
Snowfall |
Accumulated
Snowfall
Percent of Mean |
 |
 |
 |
 |
 |
 |
|
| |
| |
| |
| A LOOK AHEAD |
| |
| |
March
Temperature Outlook |
March
Precipitation Outlook |
March - May
Temperature Outlook |
March - May
Precipitation Outlook |
 |
 |
 |
 |
|
| |
| |
| |
| |
| |
|
|


 Follow us on YouTube