| Climate/Almanac Data - Oct Normals - Oct Records |
| |
| OCTOBER |
| |
|
Site
(Click site name for report)
|
Avg
Temp |
Norm |
Dept
From
Norm |
Precip
Total |
Norm |
Dept
From
Norm |
Snowfall
Total |
Normal |
Dept
From
Norm |
| Burlington |
50.9° |
55.4° |
-4.5° |
2.27" |
3.12" |
-0.85" |
NA |
0.0 |
NA |
| Cedar Rapids |
46.4° |
50.6° |
-4.2° |
3.34" |
2.62" |
+0.72" |
NA |
0.0 |
NA |
| Davenport |
49.6° |
51.7° |
-2.1° |
2.78" |
2.97" |
-0.19" |
6.5" |
NA |
NA |
| Dubuque |
46.6° |
50.0° |
-3.4° |
6.89" (4) |
2.66" |
+4.23" |
9.2" (1) |
T |
+9.2 |
| Iowa City |
49.4° |
52.0° |
-2.6° |
2.14" |
2.87" |
-0.73" |
NA |
NA |
NA |
| Moline |
51.0° |
53.2° |
-2.2° |
3.03" |
2.97" |
+0.06" |
5.8" (2) |
0.0 |
+5.8 |
|
| The ranking is listed in parentheses (__) when within the "Top 10". |
| |
| October 2019 was about 2 to 4 degrees below normal. |
| Precipitation totals for October 2019 were roughly an inch below normal at Burlington to 3/4 of an inch above normal at Cedar Rapids, with the exception of Dubuque which was over 4" inches above normal. |
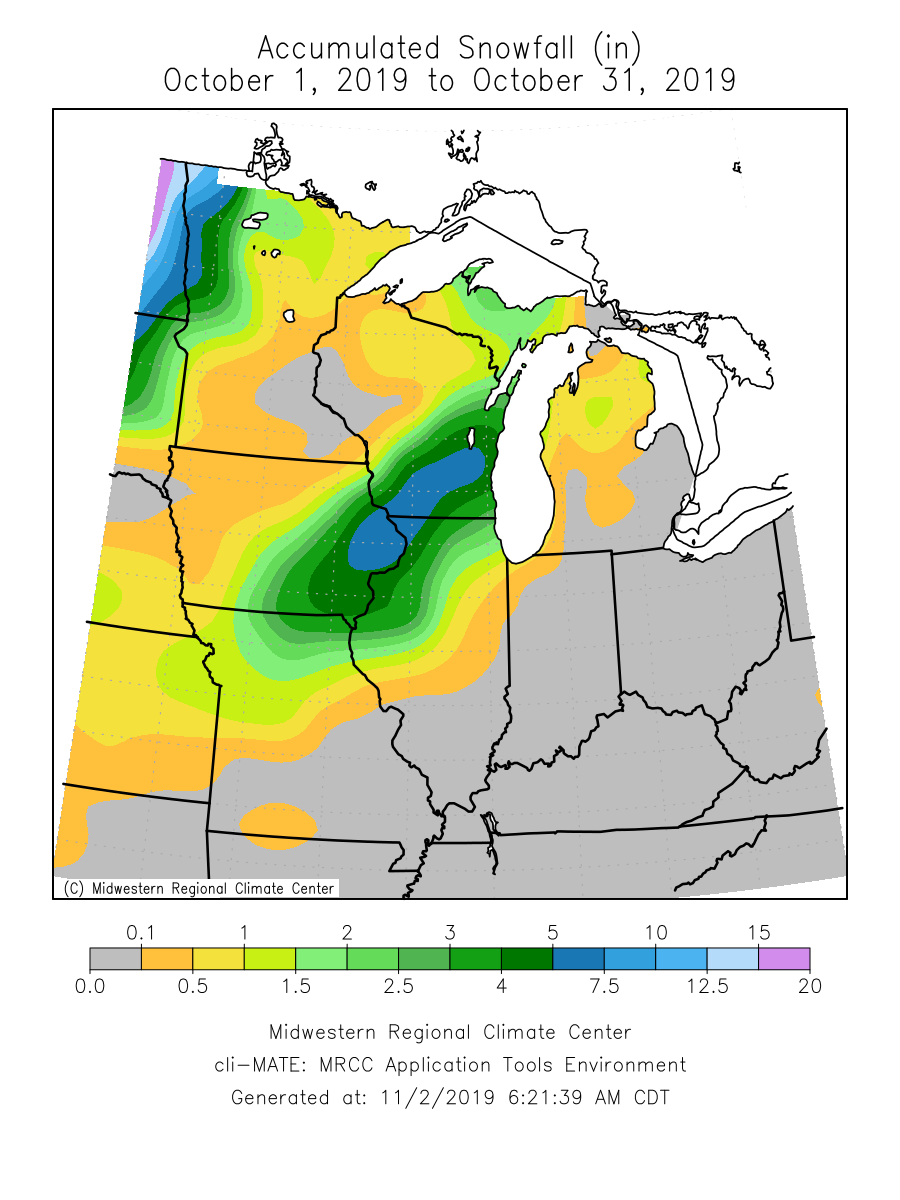
Dubuque had its snowiest October on record as well as its 4th wettest October.
Moline had its 2nd snowiest October on record. [Record Snowiest = 1967 (6.6")]
All six sites had snow on Halloween! |
| Please see Oct Records for monthly record information. |
| |
| |
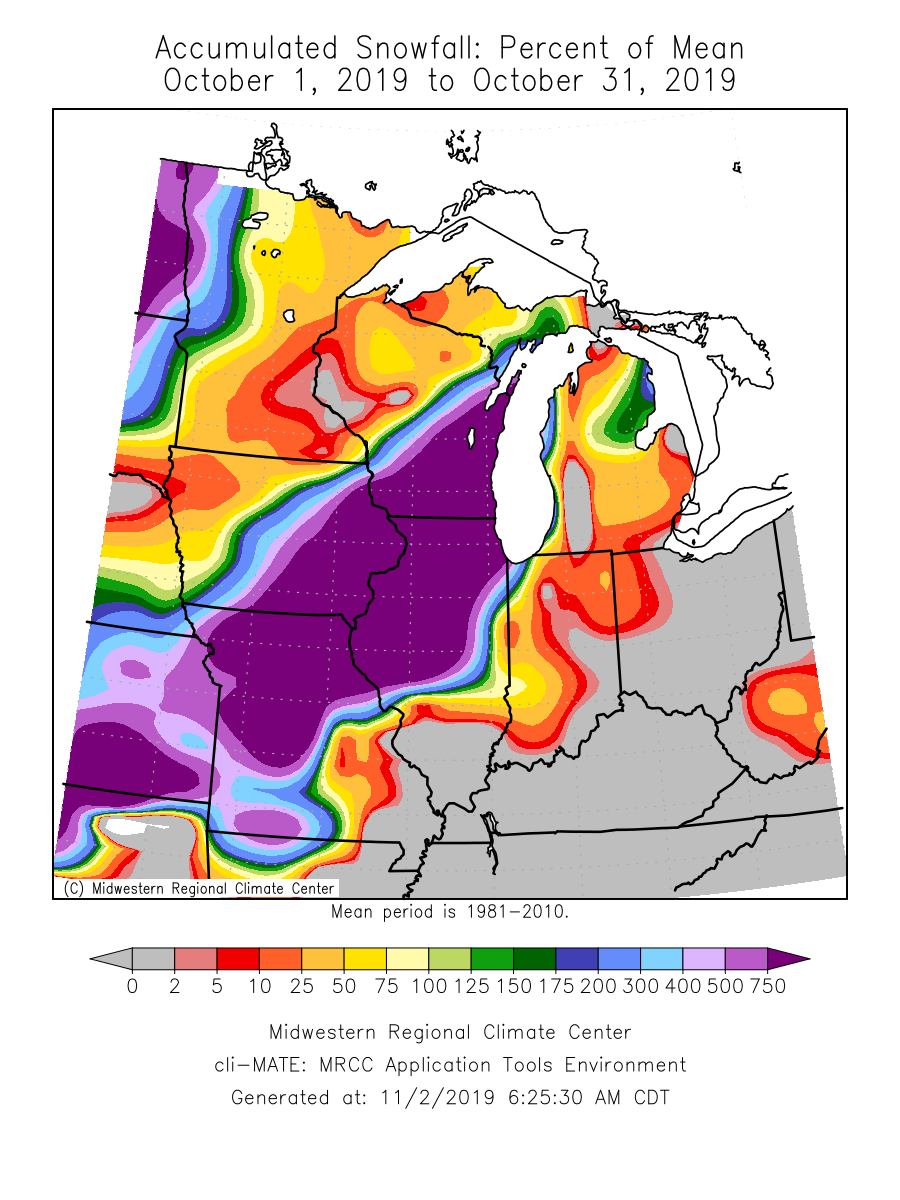
| The climate maps below are courtesy of the Midwest Regional Climate Center. |
| These maps become available around 10am on the first of the month. |
| |
|
|
|
|
|
Average
Temperature |
Average
Temperature
Departure from Mean |
Accumulated
Precipitation |
Accumulated
Precipitation
Percent of Mean |
Accumulated
Snowfall |
Accumulated
Snowfall
Percent of Mean |
 |
 |
 |
 |
 |
 |
|
| |
| |
| A LOOK AHEAD |
| |
| |
November
Temperature Outlook |
November
Precipitation Outlook |
November - January
Temperature Outlook |
November - January
Precipitation Outlook |
 |
 |
 |
 |
|
| |
| |
| |
| |
| |
| |
| |
| |


 Follow us on YouTube