| Climate/Almanac Data - Nov Normals - Nov Records |
| |
| November |
|
|
|
|
Site
(Click site name for report)
|
Avg
Temp |
Normal |
Dept
From
Norm |
Precip
Total |
Normal |
Dept
From
Norm |
Snowfall
Total |
Normal |
Dept
From
Norm |
| Burlington |
33.5° (4th) |
42.4° |
-8.9° |
2.22" |
2.50" |
-0.28" |
NA |
0.8" |
NA |
| Cedar Rapids |
30.9° (7th) |
37.1° |
-6.2° |
1.70" |
2.11" |
-0.41" |
NA |
1.7" |
NA |
| Davenport |
31.6° |
38.8° |
-7.2° |
3.54" |
2.45" |
+1.09" |
15.4" |
NA |
NA |
| Dubuque |
30.0° (7th) |
36.7° |
-6.7° |
1.92" |
2.35" |
-0.43" |
4.2" |
2.8" |
+1.4" |
|
Iowa City
|
32.3° |
39.0° |
-6.7° |
3.21" |
2.35" |
+0.86" |
NA |
NA |
NA |
| Moline |
33.5° |
40.0° |
-6.5° |
3.03" |
2.56" |
+0.47" |
18.6" (1st) |
1.2" |
+17.4" |
|
| The ranking is listed in parentheses (__) when within the "Top 10". |
| |
| November 2018 was around 6 to 9 degrees below normal. |
| Precipitation totals for November 2018 range from half an inch below normal, to around one inch above normal. |
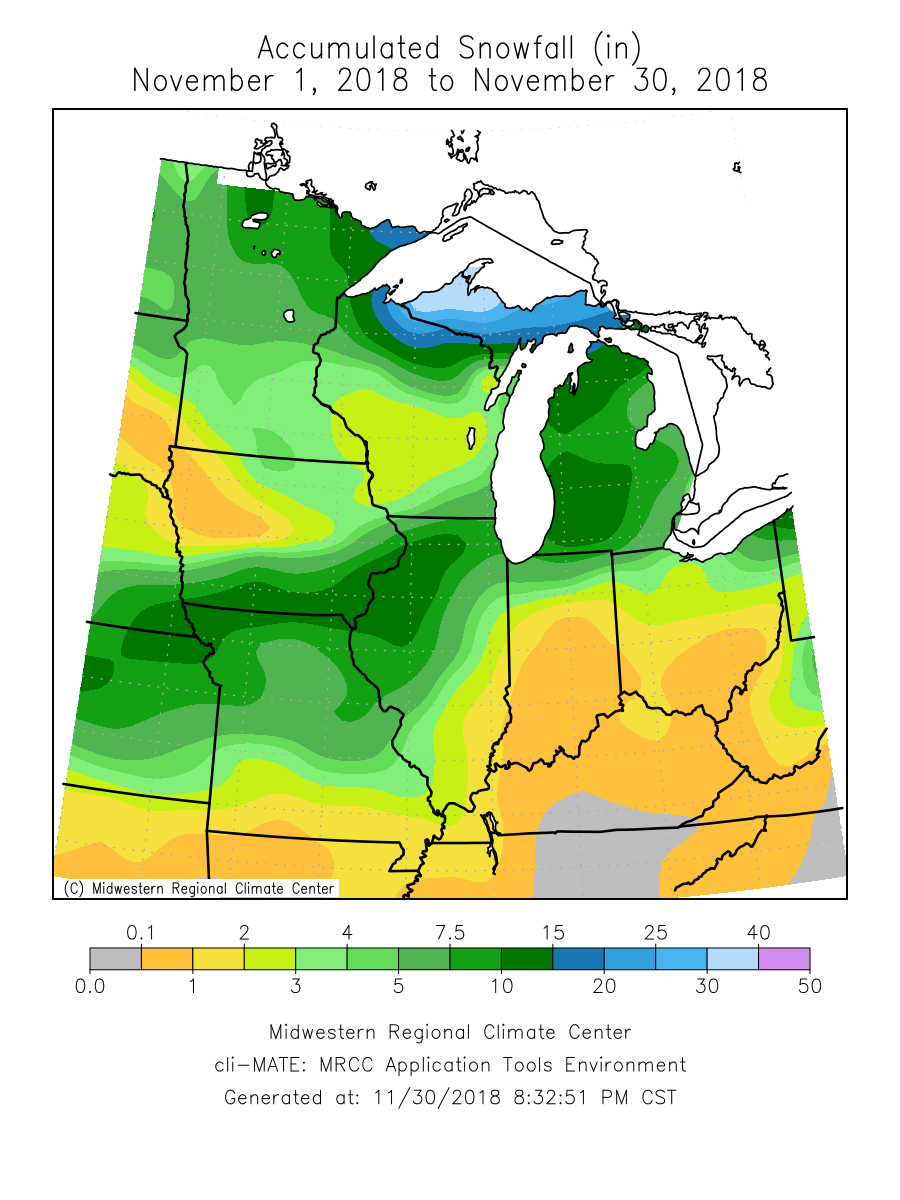
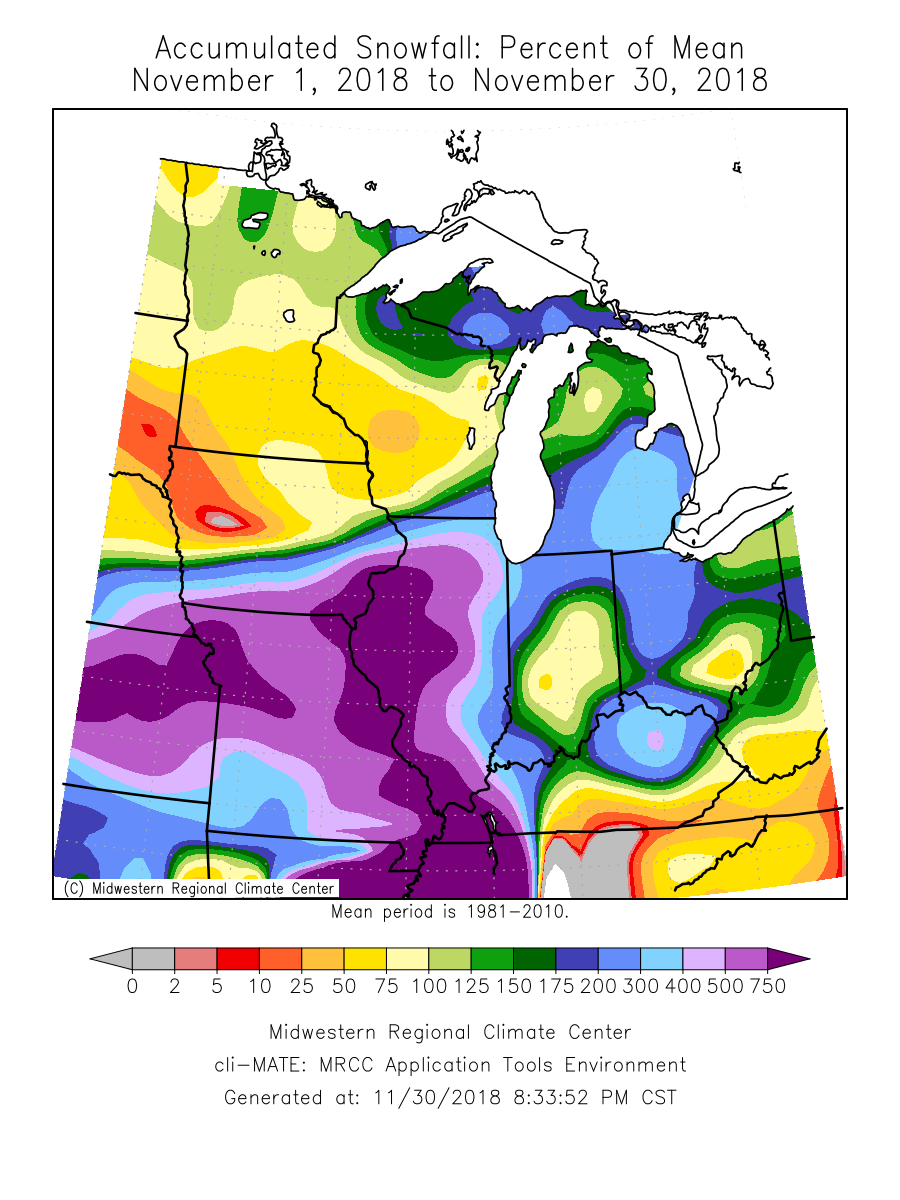
| Snowfall totals for November 2018 ranged from around 1 inch to around 18 inches above normal! |
| Please see Nov Records for monthly record information. |
| |
| The climate maps below are courtesy of the Midwest Regional Climate Center. |
| These maps become available or updated around 10am on the first of the month. |
|
|
| |
| |
| |
| |
| Climate/Almanac Data - Autumn Normals - Autumn Records |
| |
AUTUMN
(SEP-NOV) |
| |
|
Site
(Click site name for report courtesy of the
Iowa Environmental Mesonet.)
|
Avg
Temp |
Normal |
Dept
From
Norm |
Precip
Total |
Normal |
Dept
From
Norm |
Snowfall
Total |
Normal |
Dept
From
Norm |
| Burlington |
51.8° |
55.1° |
-3.3° |
13.75"
|
9.14" |
+4.61" |
NA |
0.8" |
NA |
| Cedar Rapids |
48.6° |
50.2° |
-1.6° |
12.26" |
7.89" |
+4.37" |
NA |
1.7" |
NA |
| Davenport |
49.6° |
51.3° |
-1.7° |
17.11" |
8.48" |
+8.63" |
15.4" |
NA |
NA |
| Dubuque |
47.5° |
49.6° |
-2.1° |
17.27" (5th) |
8.47" |
+8.80" |
4.2" |
2.8" |
+1.4" |
| Iowa City |
50.3° |
51.7° |
-1.4° |
17.48" |
8.61" |
+8.87" |
NA |
NA |
NA |
| Moline |
51.4° |
52.9° |
-1.5° |
12.76" |
8.62" |
+4.14" |
18.6" (1st) |
1.2" |
+17.4" |
|
| The ranking is listed in parentheses (__) when within the "Top 10". |
| |
| Autumn 2018 was about 1.5 to 3.5 degrees below normal. |
| Precipitation totals for Autumn 2018 were about 4 to 9 inches above normal! |
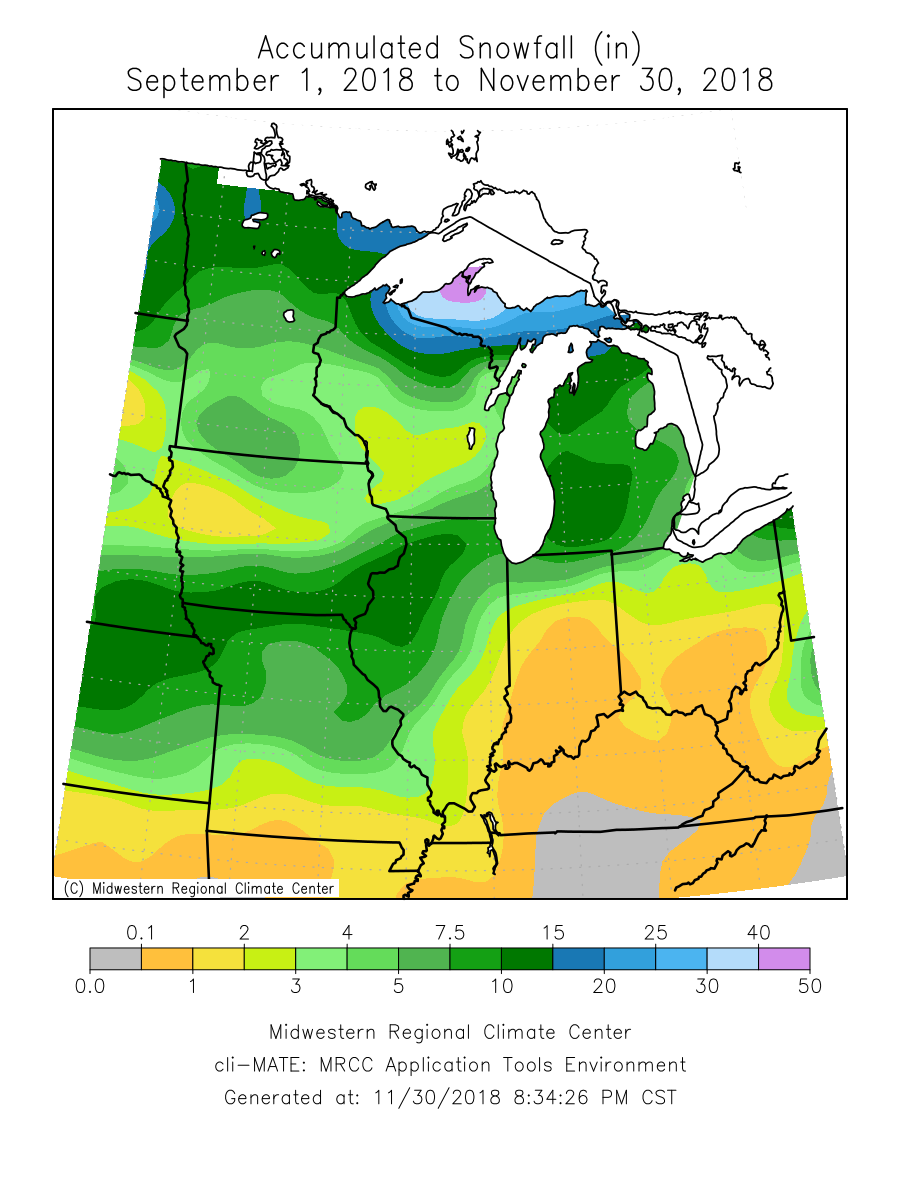
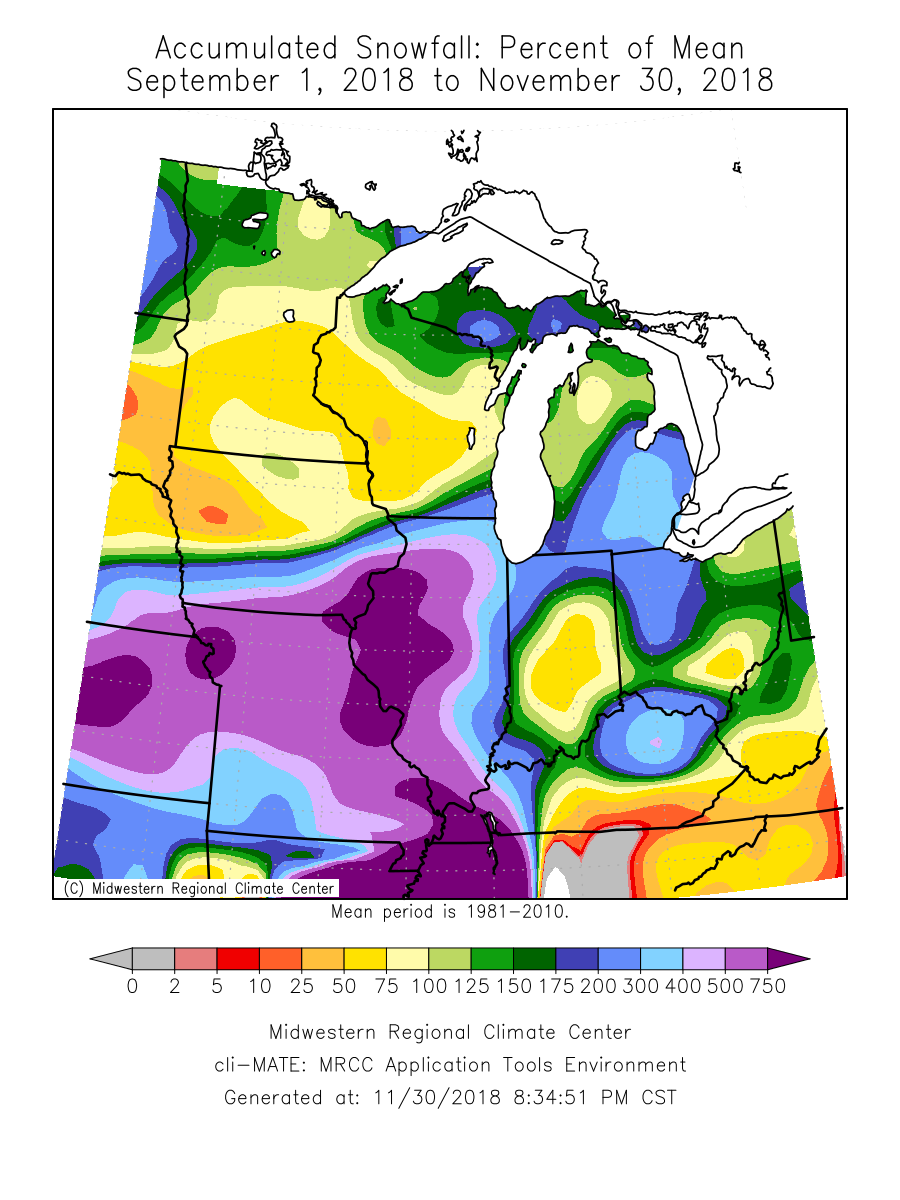
| Snowfall totals for Autumn 2018 were 1 to around 18 inches above normal! |
| Please see Autumn Records for seasonal record information. |
| |
| |
| The climate maps below are courtesy of the Midwest Regional Climate Center. |
| These maps become available or updated around 10am on the first of the month. |
| |
Average
Temperature |
Average
Temperature
Departure from Mean |
Accumulated
Precipitation |
Accumulated
Precipitation
Percent of Mean |
Accumulated
Snowfall |
Accumulated
Snowfall
Percent of Mean |
 |
 |
 |
 |
 |
 |
|
| |
| |
| |
| A LOOK AHEAD |
| |
| |
December
Temperature Outlook |
December
Precipitation Outlook |
December - February
Temperature Outlook |
December - February
Precipitation Outlook |
 |
 |
 |
 |
|
| |
| |
| |
| |
| |
| |
| |
| |


 Follow us on YouTube