National Weather Service United States Department of Commerce
Back to River Levels Page


Latest 5-Day Precipitation Forecast


Current Flood Warning Statements


Summary of Flooding from March through early May

Summary of Flooding from Late May through June


Mississippi River Highest Gage Height Records
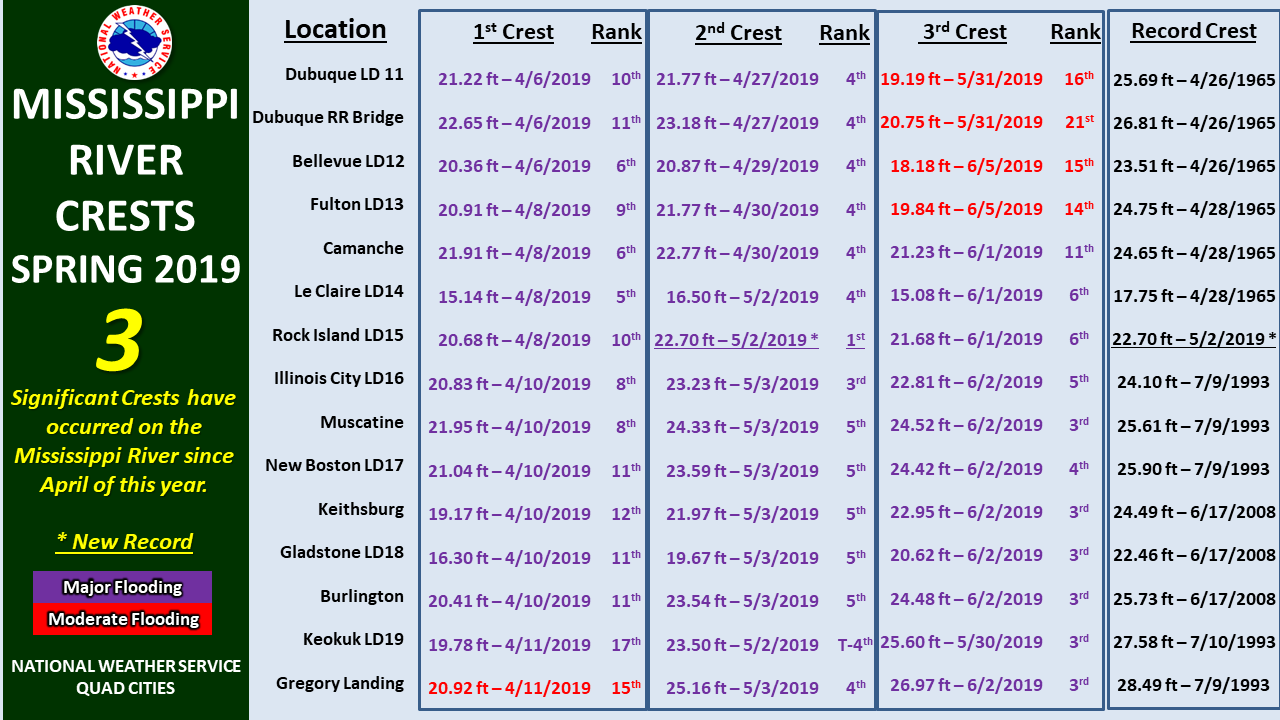
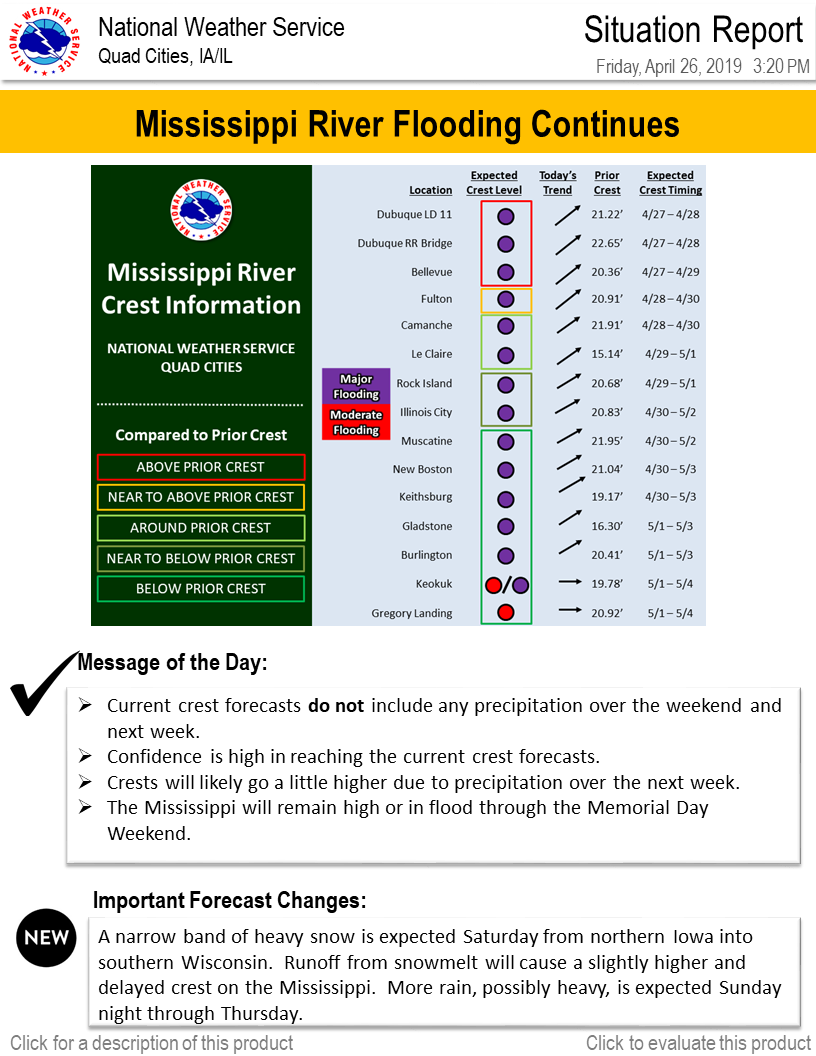
Dubuque, IA Lock & Dam 11   25.69 ft   4/26/1965
Dubuque, IA Railroad Bridge   26.81 ft   4/26/1965
Bellevue, IA Lock & Dam 12   23.51 ft   4/26/1965
Fulton, IL Lock & Dam 13   24.75 ft   4/28/1965
Camanche, IA   24.65 ft   4/28/1965
Le Claire, IA Lock & Dam 14   17.75 ft   4/28/1965
Rock Island, IL Lock & Dam 15**   22.70 ft**   5/2/2019**
Illinois City , IL Lock & Dam 16   24.10 ft   7/9/1993
Muscatine, IA   25.61 ft   7/9/1993
New Boston, IL Lock & Dam 17   25.90 ft   7/9/1993
Keithsburg, IL   24.49 ft   6/17/2008
Gladstone, IL Lock & Dam 18   22.46 ft   6/17/2008
Burlington, IA   25.73 ft   6/17/2008
Keokuk, IA Lock & Dam 19   27.58 ft   7/10/1993
Gregory Landing, MO   28.49 ft   7/9/1993


** New Record set at Rock Island Lock & Dam 15 - 22.70 ft on 5/2/2019


  Forecast Rainfall Amounts
The graphics below are for  6 hour rainfall amounts, from the most current time through 48 hours.
               
0-6 Hours 6-12 Hours 12-18 Hours 18-24 Hours 24-30 Hours 30-36 Hours 36-42 Hours 42-48 Hours
NA NA NA NA NA NA NA NA


Forecast High Temperatures
The graphics below are for  Maximum Temperatures for the next 7 days, from the most current time to day 7.
             
Today Tomorrow Day 3 Day 4 Day 5 Day 6 Day 7
NA NA NA NA NA NA NA
             

Forecast Low Temperatures
The graphics below are for  Minimum Temperatures for the next 7 days, from the most current time to day 7.
             
Tonight Tomorrow Night Day 3 Day 4 Day 5 Day 6 Day 7
NA NA NA NA NA NA NA
             

Temperature and Precipitation Outlooks for Weeks 2 through 4

Week 2 Temperature Outlook Week 2 Precipitation Outlook


Week 3 and 4 Temperature Outlook Week 3 & 4 Precipitation Outlook


Snow and Water Content Information

Current Snow Depth Current Snow Water Equivalent
   
   
Current Snow Temperature Modeled Hourly Snow Melt
   
 
Top Left
Snow Depth Legend
Top Right
Water Equivalent Legend


Bottom Left
Snow Temperature Legend


Bottom Right
Snow Melt Legend


Archived Information Provided by the Quad Cities NWS through the 2019 Spring Flood:


Situation Report: 3/22/2019 Webinar Slides:  3/25/2019 Situation Report: 3/29/2019 Webinar Slides:   4/1/2019 Situation Report:  4/5/2019 Webinar Slides:   4/8/2019


Webinar Slides: 4/15/2019

Situation Report: 4/18/2019 Webinar Slides:  4/22/2019

 Situation Report: 4/26/19

Webinar Slides: 4/29/2019

Webinar Slides:  5/3/2019


Webinar Slides:  5/6/2019

Situation Report: 5/9/2019

Webinar Slides: 5/13/2019

Webinar Slides: 5/17/2019

Webinar Slides: 5/23/2019

Webinar Slides:  5/28/2019


Situation Report: 6/7/2019 Situation Report:   6/14/2019 Situation Report: 6/28/2019      


2019 Flood Outlook Webpage - Last Updated 3/7/2019


Chance of Exceedance Probabilities for the Next 3 Months


Choose your location from the drop down menu below to  see the probabilities on how high the river might get.

 
Select Location: