Scientific Analysis of the January 31 - February 2, 2011 Blizzard
Snowfall Totals
On January 31st, a strong shortwave began to round the base of the western United States trough inducing the development of low pressure near northern Mexico. Pieces of this shortwave energy raced quickly northeast over the Upper Mississippi Valley. It pulled with it warm and moist air over the top of a strong mid level front. This spread light snow and freezing drizzle across much of the Quad Cities forecast area, with totals between 1 and 2 inches by the morning of February 1st.
Figure: 850 mb heights (3000-4000 ft) and temperatures (below freezing in blue) showing warm air surging north into Missouri and Illinois.
Early on February 1st the low pressure began to undergo rapid intensification, drawing in more warm and moist air from the Gulf of Mexico. Heavy snow continued to spread north into north central Missouri, with more thunder observed near Kirksville, Missouri. By mid morning conditions were rapidly deteriorating in the Quad Cities forecast area south of Highway 34.

Figure: Sea level pressure and surface temperatures at 6 PM on Tuesday. Note the 996 mb low and the 1049 mb high creating strong difference in pressure across Iowa and northern Illinois.
Once snow began, visibilities dropped to around 1/4 mile in an hour or less. The rapid onset of blizzard to near blizzard conditions was likely due to the high pressure, specifically its location. Typically, the cold, dry, Arctic air masses are located north or northeast of our forecast area. This funnels dry air into the area on an east or northeast wind, delaying saturation and the start of heavy snow. With the high pressure centered northwest of the region, the northeast winds were bringing in modified air that was already nearly saturated.

Figure: Forecast 850 mb wind speeds (shaded above 55 mph) from the Rapid Update Cycle (RUC) model. Note the 80 mph south winds meeting 75 mph northeast winds just southeast of the Quad Cities forecast area.
Figure: 850 mb moisture transport. Note the high values originating in the Gulf of Mexico being pulled north to (and eventually over) the mid level front.
These strong winds were occurring at the top of a well mixed layer extending from the surface to around 2000 feet. Above that height, warm air carried north slid over the cold, stable air near the surface. This created what is commonly referred to as a temperature inversion (rising temperatures with height). The winds right at the base of the inversion were on the order of 50 to 60 mph, and were able to mix down to the surface as strong gusts. Due to frictional effects these winds slow down near the surface, but still resulted in widespread gusts from 40 to 50 mph. Explosive deepening of the surface low also helped to create another feature that enhanced wind gusts across the area. Convection forming over central Illinois formed gravity waves, which propagated away and towards the Quad Cities forecast area. This happened because the temperature inversion acted like the surface of a pond and when the thunderstorms broke that surface, like a rock being tossed into the pond, it created ripples that radiated out. The rapid pressure changes these ripples cause at the surface helps to accelerate winds. As a result several wind gusts were reported between 55 and 65 mph around 9 PM, including 56 mph at Mount Pleasant and Davenport, Iowa, and separate gusts of 57, 61 and 66 mph at Clinton, Iowa. With blizzard conditions already in full force, these winds only acted to create crippling, white out situations.

Figure: Radar reflectivity around 845 PM showing gravity waves over western Clinton County. These waves are the southwest to northeast parallel lines over the western half of the county.

Figure: Radar velocity from the same time showing the gravity waves over Clinton County. The waves show up again as southwest to northeast parallel lines alternating light blue (higher winds) and green (lighter winds). Though it becomes difficult to see, you can trace these lines southwest into Muscatine County where they show up faintly as alternating light and dark red.
At the same time reports were streaming in of thundersnow across eastern Iowa and northwest Illinois. There were two concentrated areas of lightning, one around and southeast of the Quad Cities and another in a band of heavy snow running from near Washington, Iowa to Freeport, Illinois. A strong jet streak surging northeast over the storm system helped transport dry air aloft (creating a dry slot). Already cooling temperatures aloft dropped even faster due to evaporative effects and coupled with continued transport of warmer air into the low to mid levels to create steep lapse rates (temperature change with height). Similar to the spring and summer time, these large lapse rates increased the instability that fuels thunderstorms. The result was occasional lightning over the area, becoming frequent in and around Chicago where the forcing remained the strongest.

Figure: Water vapor satellite imagery showing the dry slot punching into Illinois and Indiana and the RUC forecast wind speeds at jet stream level (showing 150+ mph).

Figure: RUC cross section near Springfield, Illinois to near Cedar Rapids, Iowa, through the Quad Cities at 9 PM. Yellow lines show vertical motion (concentrated in two main bands), red lines show temperature (note temperatures rising with height near and southeast of the Quad Cities), and the image shows negative EPV (a measure of instability). The rising air combined with instability suggested two main areas of convection (and possible lightning) south and east of the Quad Cities and in a band between the Quad Cities and Cedar Rapids.

Figure: Regional infrared satellite imagery with 1 hour lightning valid at 9 PM Tuesday evening. Note the abundance of lightning strikes in northern Illinois and in eastern Iowa.
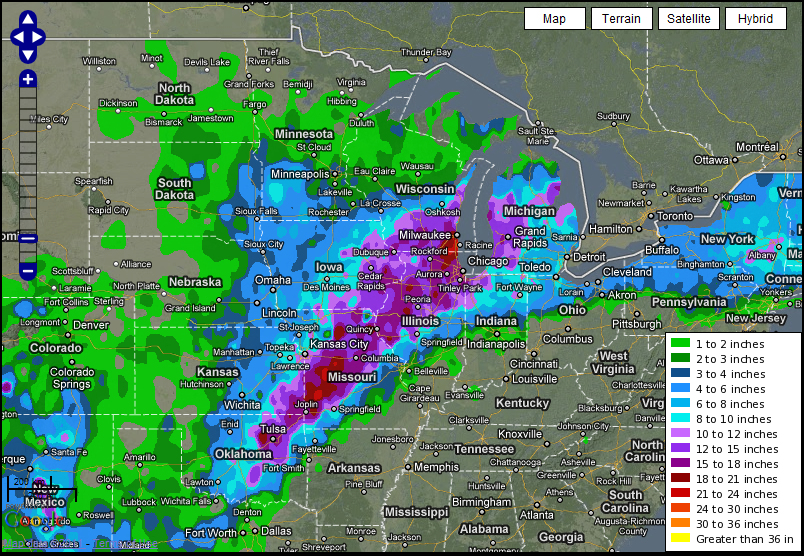
The overall strength of the system produced widespread 1 to 2 inch per hour snowfall rates, with thundersnow only serving to enhance those rates further. Three day snowfall totals ranged from around 10 inches in Buchanan County, to as much as 19 to 20 inches in parts of western Illinois and northeast Missouri, with significant blowing and drifting widespread. Moline, Illinois observed 16.7 inches of snow from the evening of February 1st to the morning of February 2nd, setting a new 24 hour snowfall record by topping January 3, 1971 by 0.3 inches. The Moline three day total of 18.4 inches also tied the record for a single storm that was set back in January of 1979. For more area snowfall totals and the Moline record snow statement click here.

Figure: High resolution satellite imagery of the deep snow cover across the region on February 3rd.


 Follow us on YouTube