North and Central Georgia
2018 Annual Climate Summary
Overall, 2018 was both warmer and wetter for all of North and Central Georgia.
Jump to:
| Average Temperatures | Precipitation Totals | Snowfall Totals | Narrative Summary |
Annual Top 10 Rankings:
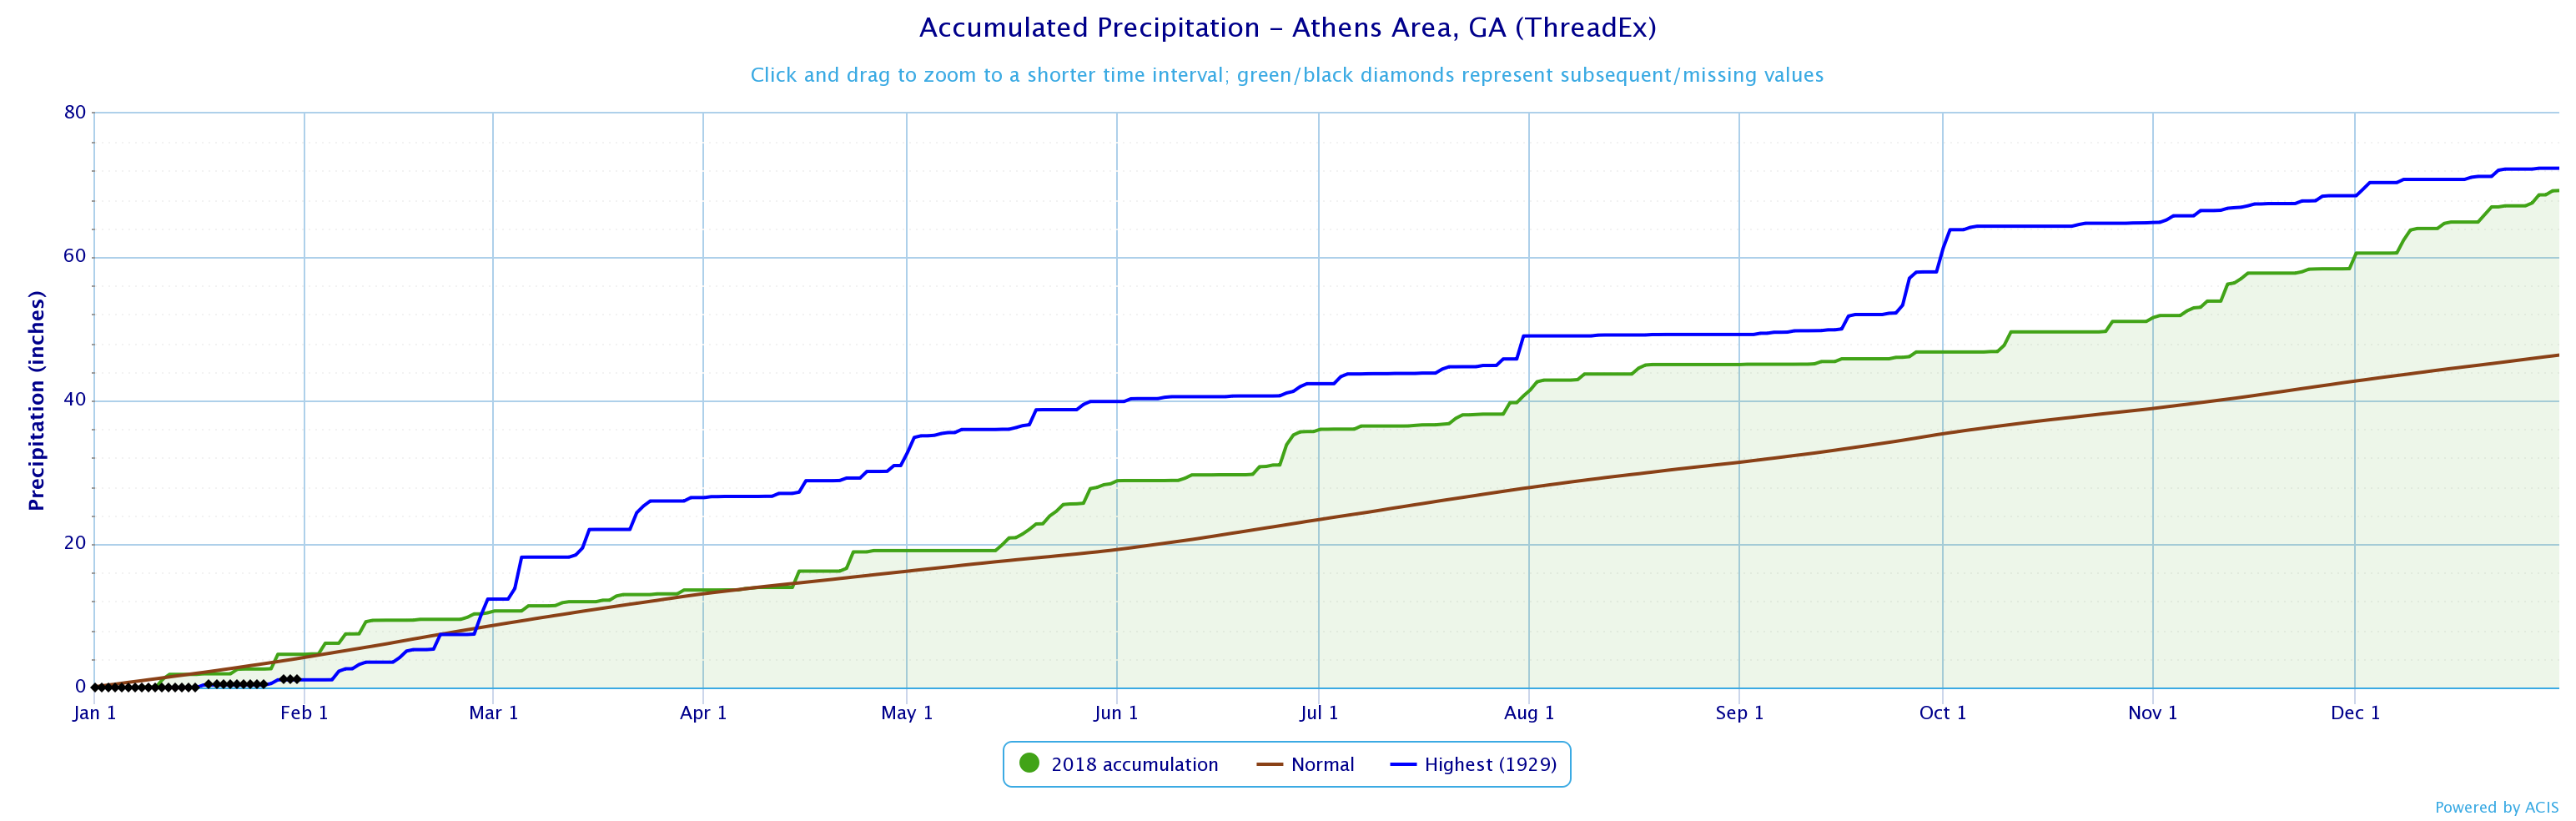
Athens
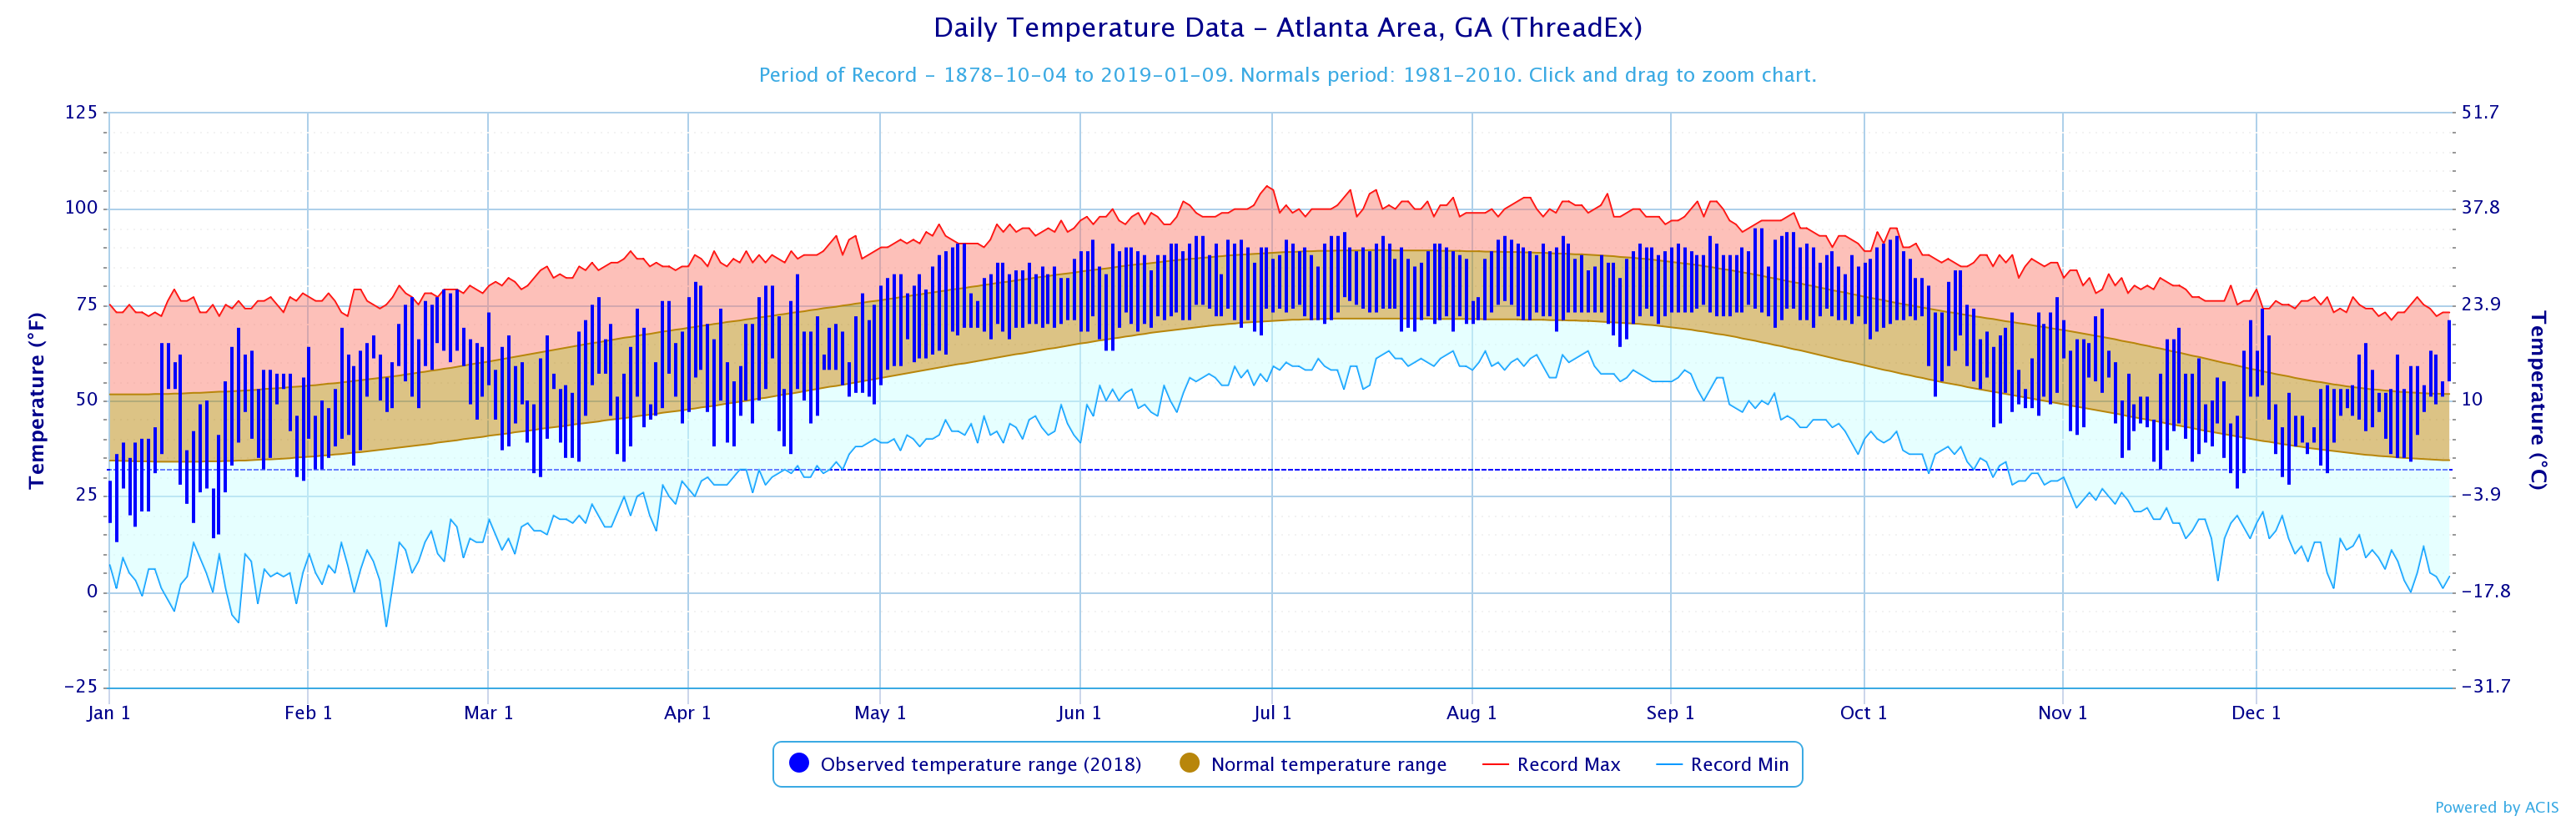
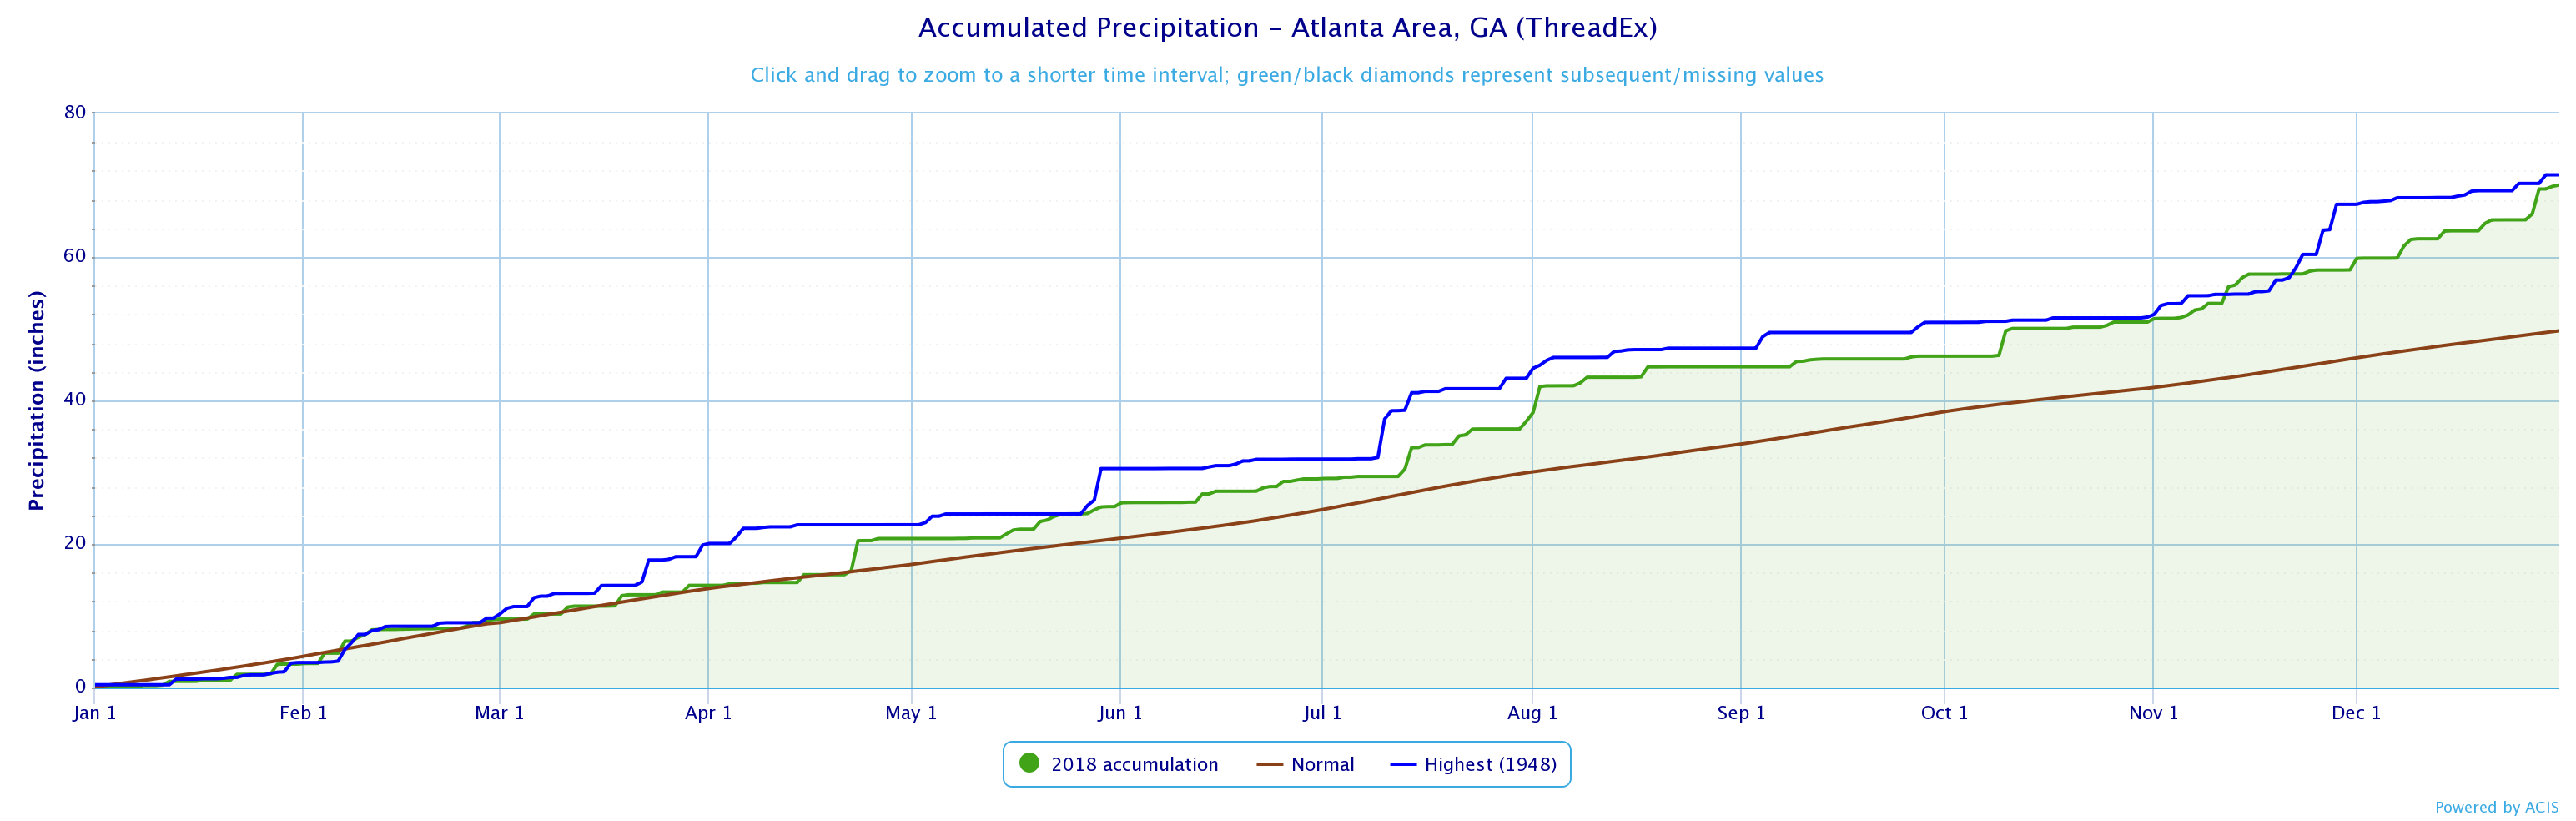
Atlanta
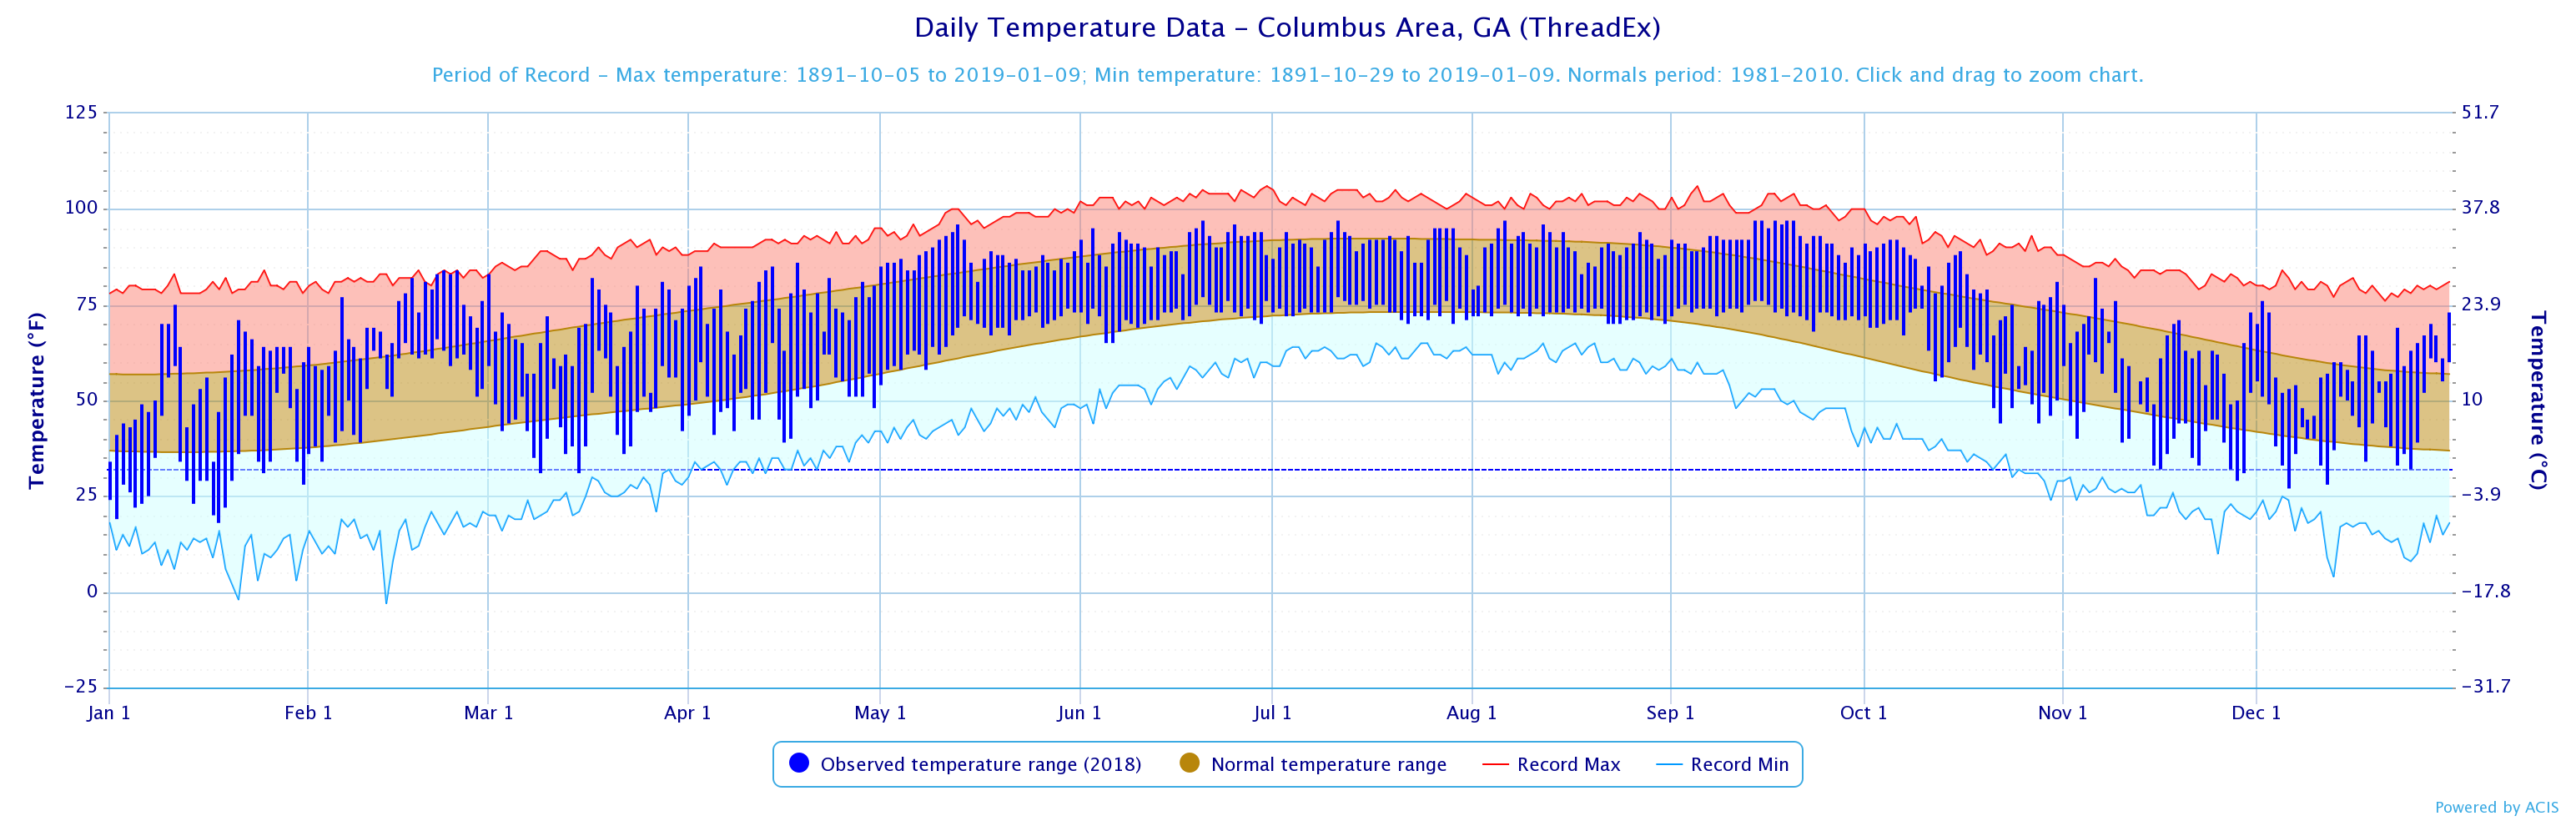
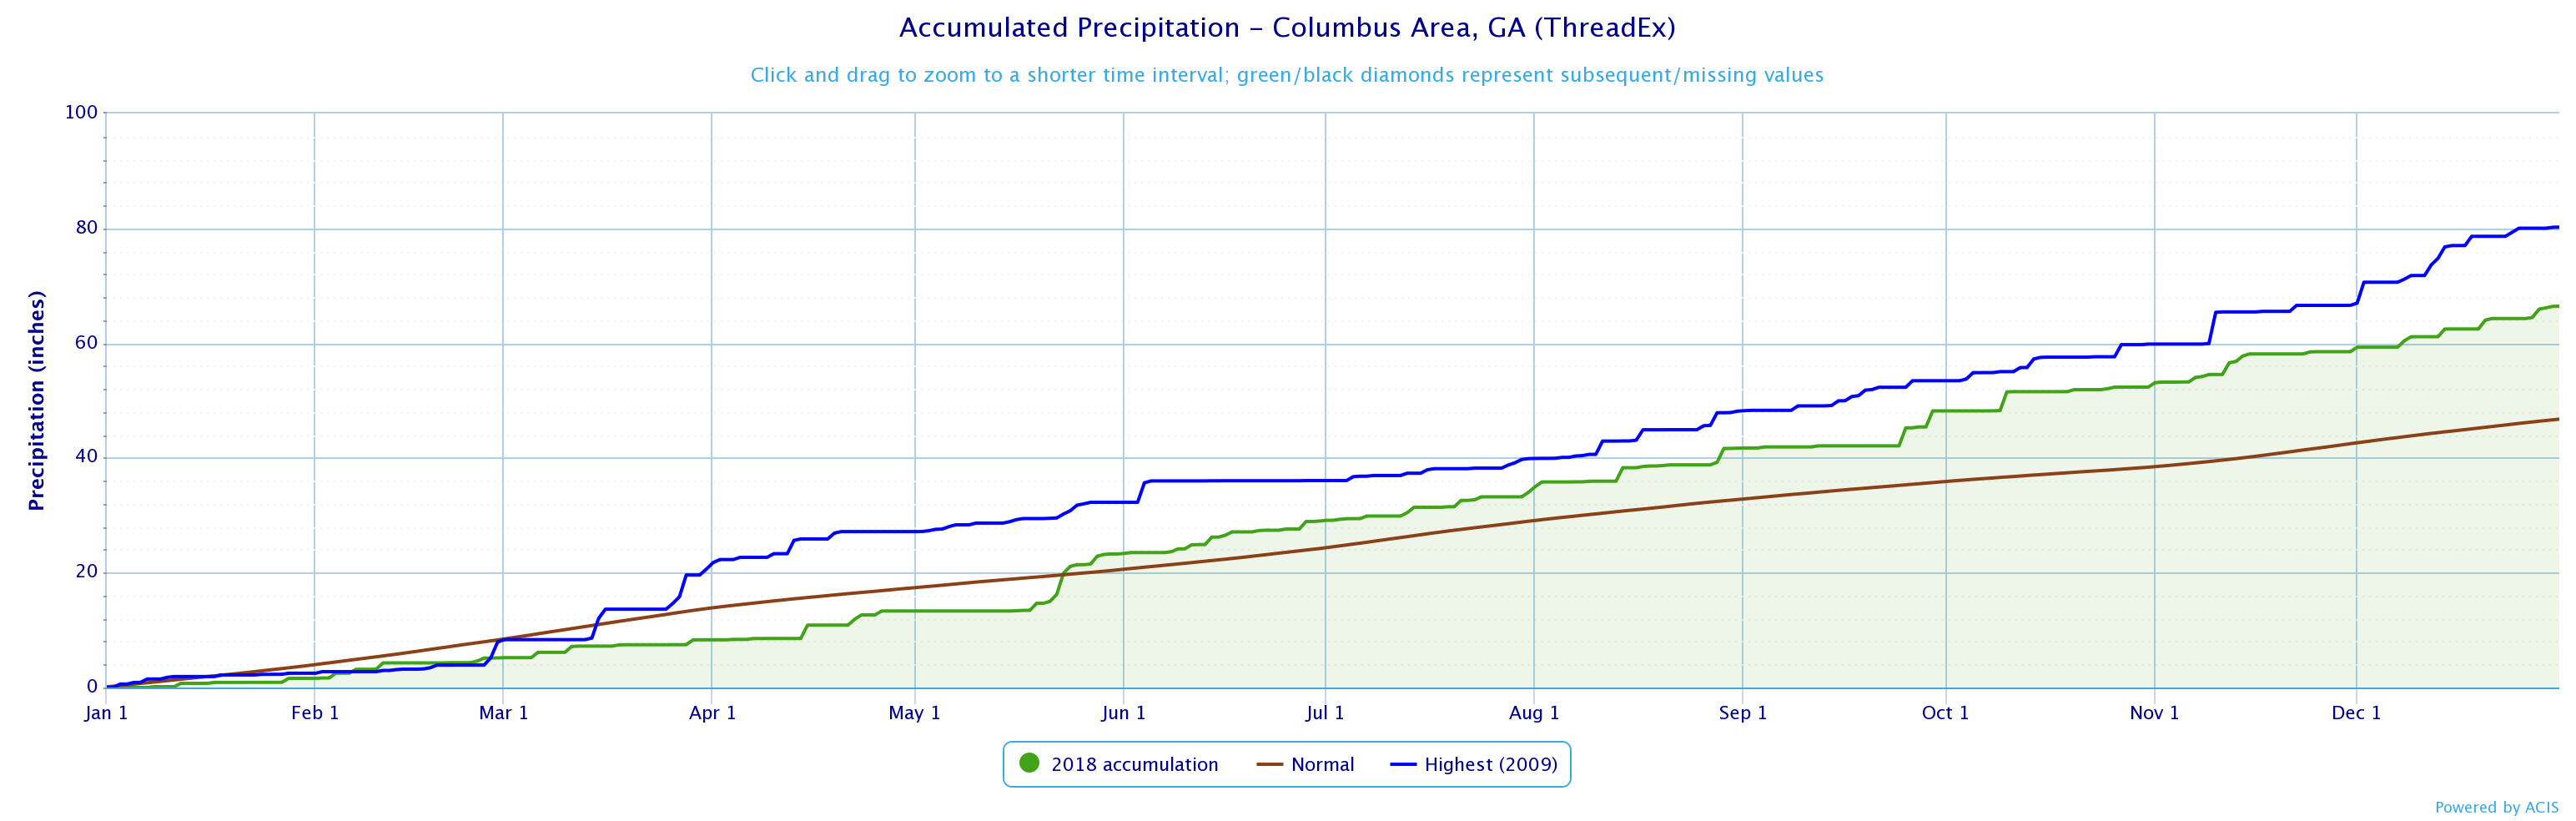
Columbus
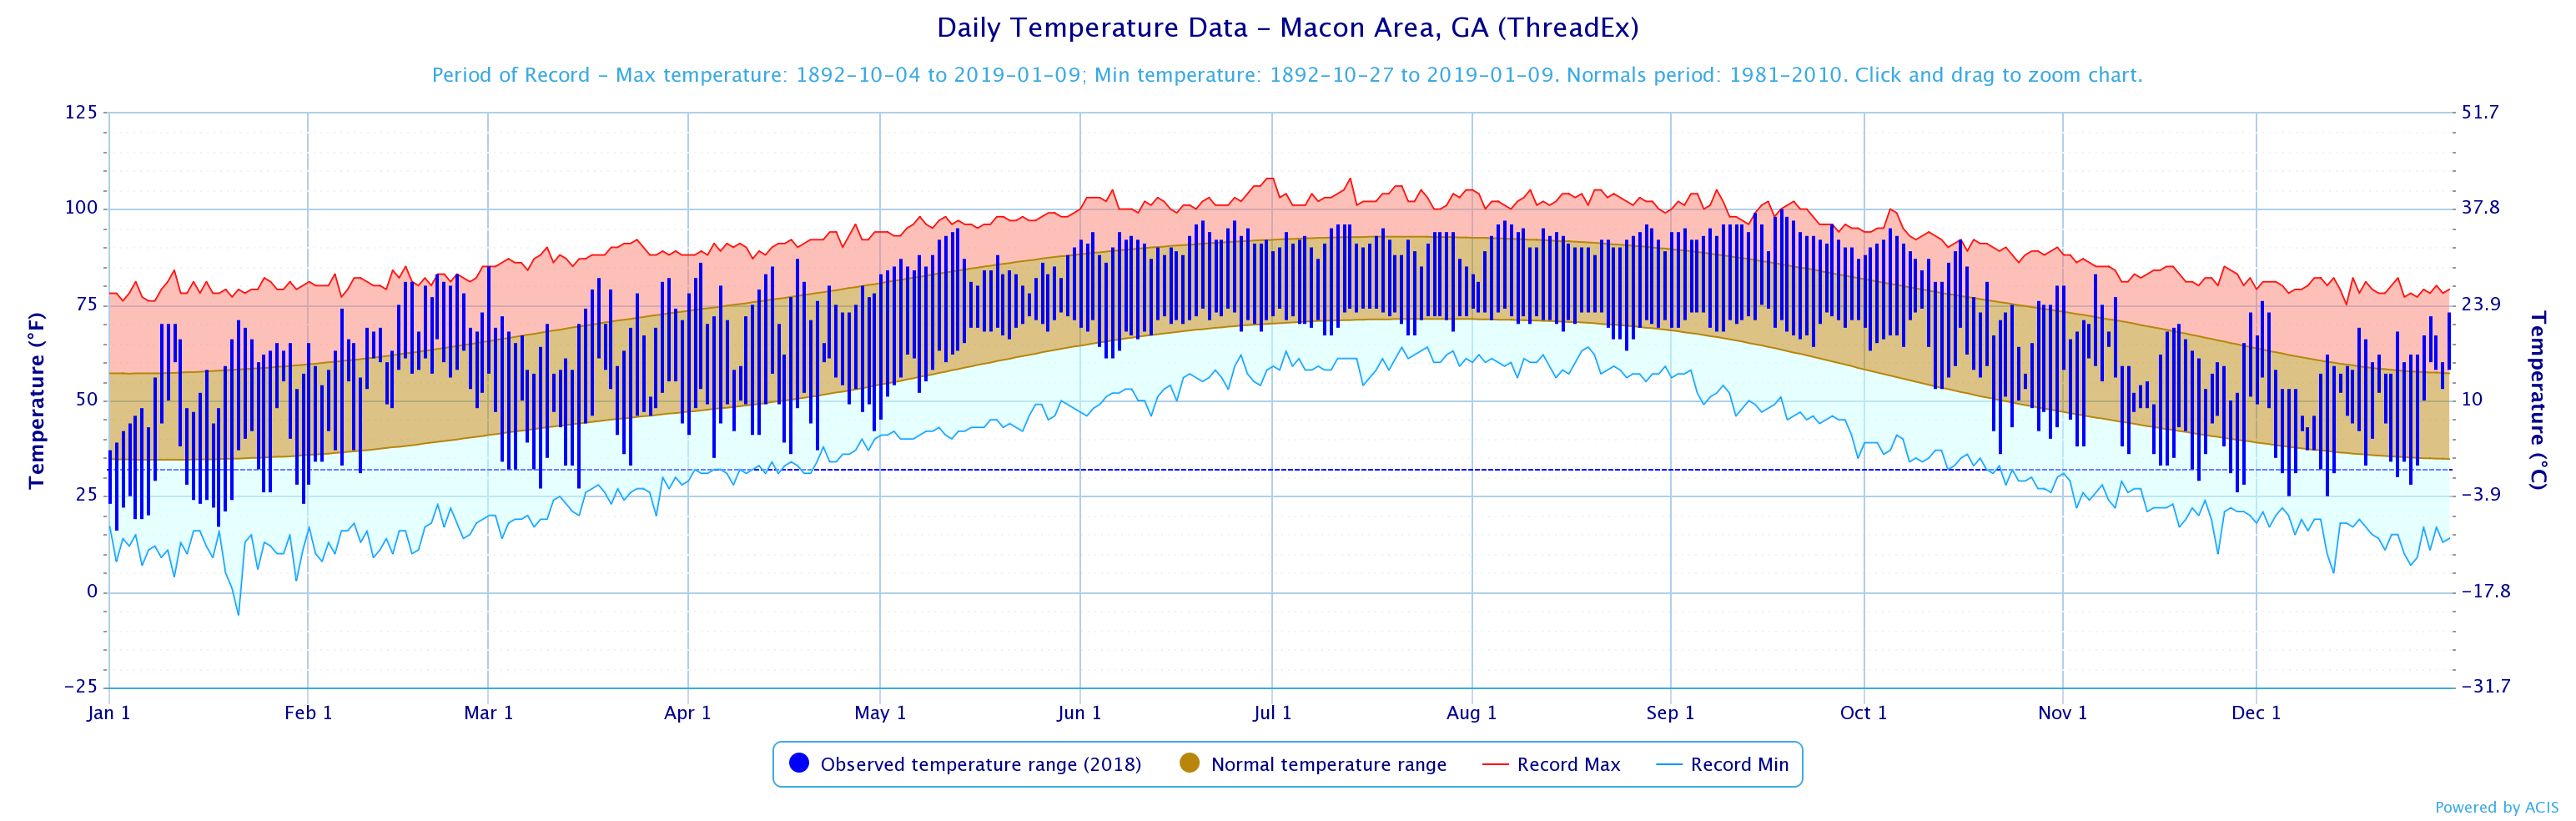
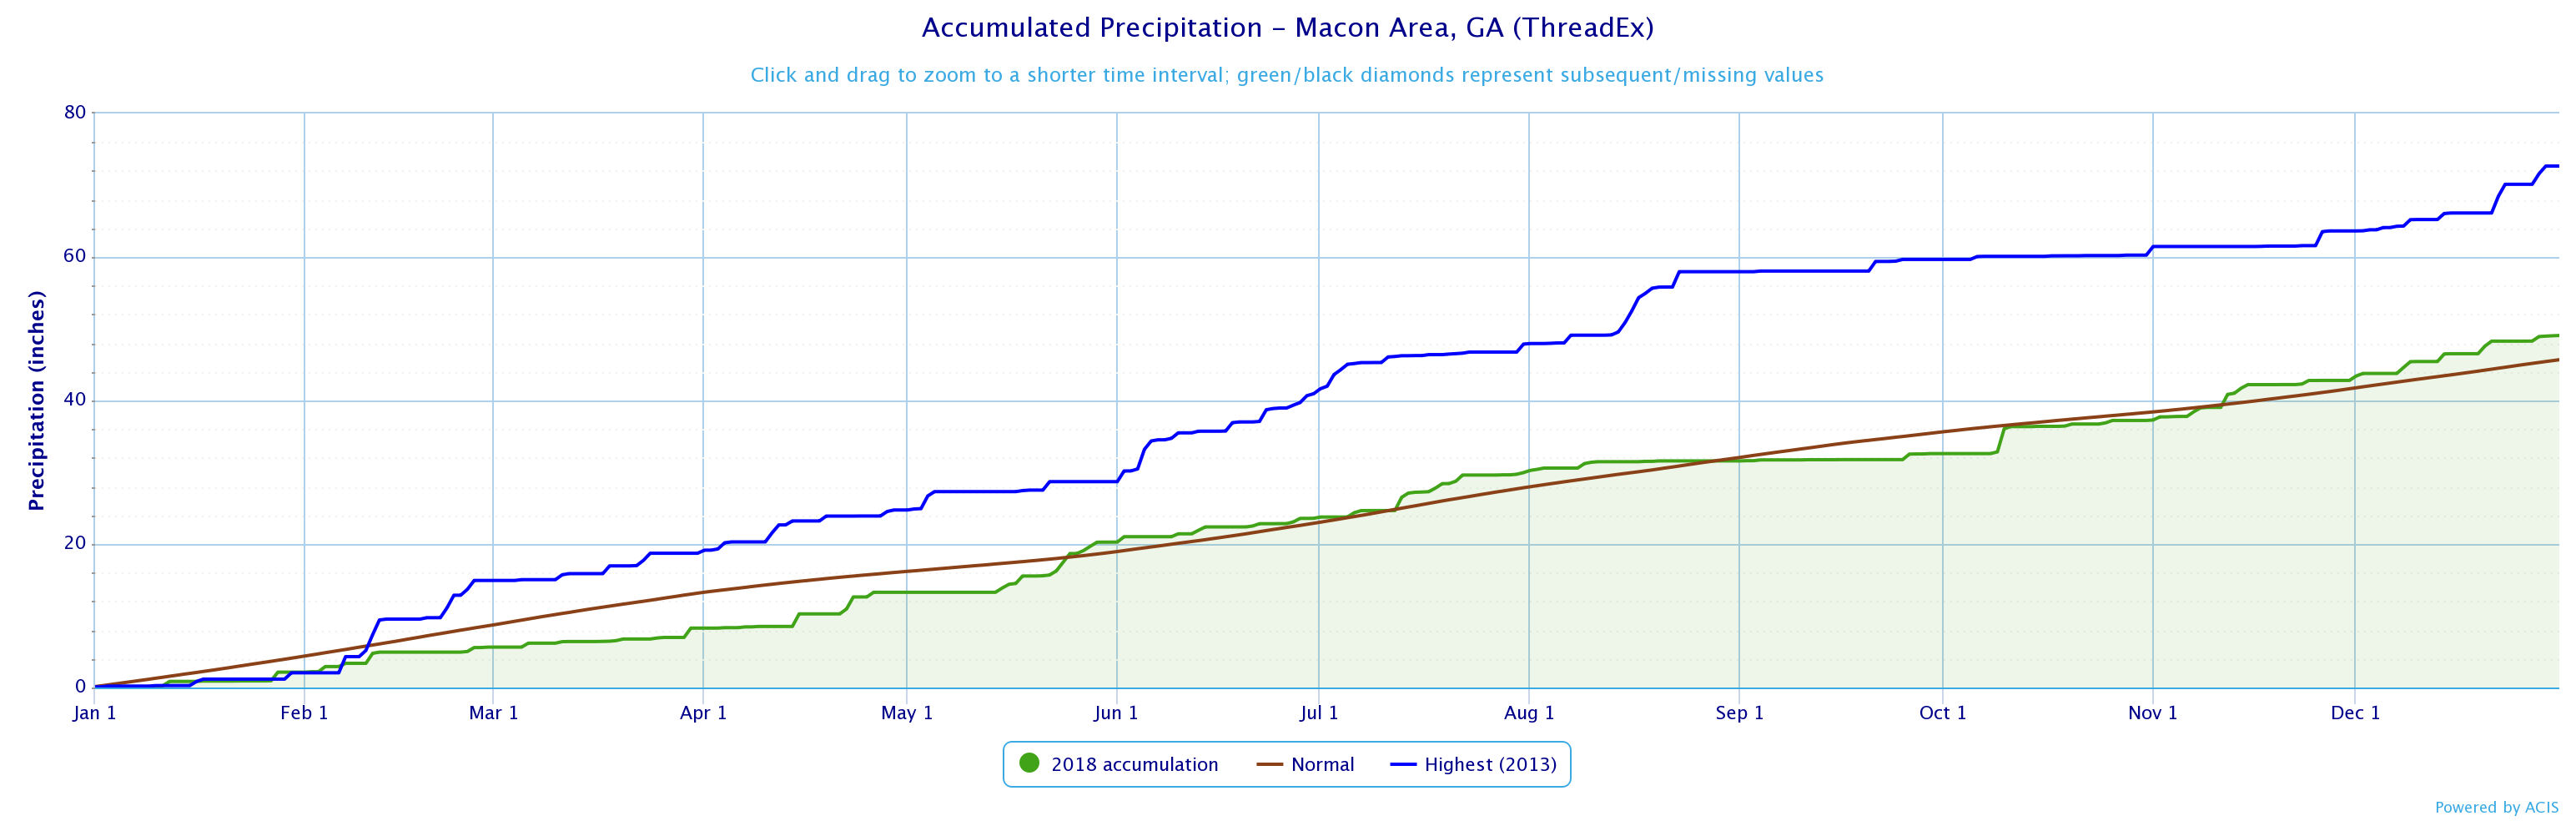
Macon
Annual Avg. Temperature (ºF) and Rankings
* Click on site name below to view a graph with additional data
|
Site |
Avg. Temp. and Current Ranking |
Normal |
Dep. from Normal |
Previous Records |
|
63.7 (16th Warmest) |
62.5 |
+1.2 |
65.6 (1933) |
|
|
64.5 (5th Warmest) |
62.5 |
+2.0 |
65.8 (2016) |
|
|
67.4 (12th Warmest) |
65.6 |
+1.8 |
69.3 (1927) |
|
|
66.1 (8th Warmest) |
64.5 |
+1.6 |
67.0 (1990) |
|
|
Cartersville |
61.7 |
60.1 |
+1.6 |
|
|
DeKalb Peachtree Arpt |
62.5 |
61.7 |
+0.8 |
|
|
Fulton Co. Arpt |
63.2 |
61.8 |
+1.4 |
|
|
Gainesville |
62.0 |
60.9 |
+1.1 |
|
|
Peachtree City |
64.0 |
61.4 |
+2.6 |
|
|
Rome |
63.0 |
60.5 |
+2.5 |
|
Monthly Avg. Temperature (ºF)
DFN = Departure from normal
Athens
|
Month |
Jan |
Feb |
Mar |
Apr |
May |
Jun |
Jul |
Aug |
Sep |
Oct |
Nov |
Dec |
|
Temp. |
40.9 |
57.4 |
52.5 |
58.8 |
73.5 |
79.3 |
79.7 |
78.9 |
79.9 |
66.3 |
49.4 |
47.4 |
|
Normal |
43.5 |
47.2 |
54.3 |
61.7 |
70.0 |
77.5 |
80.6 |
79.6 |
73.3 |
63.0 |
53.8 |
45.4 |
|
DFN |
-2.6 |
+10.2 |
-1.8 |
-2.9 |
+3.5 |
+1.8 |
-0.9 |
-0.7 |
+6.6 |
+3.3 |
-4.4 |
+2.0 |
Atlanta
|
Month |
Jan |
Feb |
Mar |
Apr |
May |
Jun |
Jul |
Aug |
Sep |
Oct |
Nov |
Dec |
|
Temp. |
40.4 |
57.3 |
53.5 |
59.8 |
74.8 |
79.8 |
80.8 |
79.7 |
81.0 |
67.4 |
50.3 |
48.6 |
|
Normal |
43.3 |
47.2 |
54.3 |
62.0 |
70.1 |
77.3 |
80.2 |
79.4 |
73.5 |
63.3 |
54.0 |
45.3 |
|
DFN |
-2.9 |
+10.1 |
-0.8 |
-2.2 |
+4.7 |
+2.5 |
+0.6 |
+0.3 |
+7.5 |
+4.1 |
-3.7 |
+3.3 |
Columbus
|
Month |
Jan |
Feb |
Mar |
Apr |
May |
Jun |
Jul |
Aug |
Sep |
Oct |
Nov |
Dec |
|
Temp. |
44.7 |
62.3 |
57.5 |
63.3 |
77.1 |
81.5 |
82.4 |
81.2 |
82.6 |
70.3 |
54.0 |
51.9 |
|
Normal |
47.2 |
51.1 |
57.8 |
64.6 |
73.0 |
79.8 |
82.5 |
81.9 |
76.6 |
66.5 |
57.3 |
49.1 |
|
DFN |
-2.5 |
+11.2 |
-0.3 |
-1.3 |
+4.1 |
+1.7 |
-0.1 |
-0.7 |
+6.0 |
+3.8 |
-3.3 |
+2.8 |
Macon
|
Month |
Jan |
Feb |
Mar |
Apr |
May |
Jun |
Jul |
Aug |
Sep |
Oct |
Nov |
Dec |
|
Temp. |
43.4 |
60.3 |
55.8 |
61.2 |
74.9 |
80.5 |
81.3 |
81.1 |
82.1 |
68.9 |
53.1 |
50.8 |
|
Normal |
46.3 |
50.0 |
56.8 |
63.4 |
71.9 |
78.9 |
81.8 |
80.9 |
75.0 |
64.9 |
55.9 |
48.0 |
|
DFN |
-2.9 |
+10.3 |
-1.0 |
-2.2 |
+3.0 |
+1.6 |
-0.5 |
+0.2 |
+7.1 |
+4.0 |
-2.8 |
+2.8 |
Cartersville
|
Month |
Jan |
Feb |
Mar |
Apr |
May |
Jun |
Jul |
Aug |
Sep |
Oct |
Nov |
Dec |
|
Temp. |
37.0 |
54.5 |
50.4 |
56.9 |
72.8 |
77.4 |
78.6 |
77.9 |
78.6 |
64.2 |
47.2 |
45.0 |
|
Normal |
41.1 |
44.6 |
51.7 |
59.2 |
67.6 |
74.8 |
78.3 |
78.2 |
71.3 |
60.6 |
51.3 |
42.6 |
|
DFN |
-4.1 |
+9.9 |
-1.3 |
-2.3 |
+5.2 |
+2.6 |
+0.3 |
-0.3 |
+7.3 |
+3.6 |
-4.1 |
+2.4 |
DeKalb Peachtree Arpt
|
Month |
Jan |
Feb |
Mar |
Apr |
May |
Jun |
Jul |
Aug |
Sep |
Oct |
Nov |
Dec |
|
Temp. |
38.1 |
55.0 |
51.1 |
57.4 |
73.3 |
78.4 |
79.4 |
78.3 |
79.3 |
65.7 |
48.0 |
45.6 |
|
Normal |
42.2 |
46.1 |
53.3 |
61.6 |
69.4 |
76.8 |
79.8 |
79 |
72.9 |
61.9 |
52.7 |
44.3 |
|
DFN |
-4.1 |
+8.9 |
-2.2 |
-4.2 |
+3.9 |
+1.6 |
-0.4 |
-0.7 |
+6.4 |
+3.8 |
-4.7 |
+1.3 |
Fulton Co. Arpt
|
Month |
Jan |
Feb |
Mar |
Apr |
May |
Jun |
Jul |
Aug |
Sep |
Oct |
Nov |
Dec |
|
Temp. |
39.1 |
56.3 |
52.3 |
58.7 |
73.6 |
78.8 |
79.8 |
78.6 |
79.5 |
65.5 |
48.7 |
47.0 |
|
Normal |
43.1 |
46.3 |
53.6 |
61.0 |
69.3 |
76.7 |
79.8 |
78.8 |
72.8 |
62.5 |
53.0 |
44.8 |
|
DFN |
-4.0 |
+10.0 |
-1.3 |
-2.3 |
+4.3 |
+2.1 |
0.0 |
-0.2 |
+6.7 |
+3.0 |
-4.3 |
+2.2 |
Gainesville
|
Month |
Jan |
Feb |
Mar |
Apr |
May |
Jun |
Jul |
Aug |
Sep |
Oct |
Nov |
Dec |
|
Temp. |
38.8 |
54.1 |
50.2 |
58.0 |
72.8 |
77.8 |
78.7 |
77.4 |
78.2 |
64.8 |
47.7 |
45.3 |
|
Normal |
41.7 |
45.5 |
52.7 |
60.4 |
68.2 |
75.6 |
78.8 |
78.1 |
71.7 |
61.7 |
52.6 |
43.7 |
|
DFN |
-2.9 |
+8.6 |
-2.5 |
-2.4 |
+4.6 |
+2.2 |
-0.1 |
-0.7 |
+6.5 |
+3.1 |
-4.9 |
+1.6 |
Peachtree City
|
Month |
Jan |
Feb |
Mar |
Apr |
May |
Jun |
Jul |
Aug |
Sep |
Oct |
Nov |
Dec |
|
Temp. |
40.4 |
57.9 |
53.3 |
59.2 |
74.0 |
79.3 |
80.2 |
79.1 |
79.9 |
66.3 |
50.3 |
48.0 |
|
Normal |
42.8 |
46.7 |
53.2 |
60.5 |
68.9 |
75.9 |
79.3 |
78.6 |
72.1 |
61.4 |
52.7 |
44.4 |
|
DFN |
-2.4 |
+11.2 |
+0.1 |
-1.3 |
+5.1 |
+3.4 |
+0.9 |
+0.5 |
+7.8 |
+4.9 |
-2.4 |
+3.6 |
Rome
|
Month |
Jan |
Feb |
Mar |
Apr |
May |
Jun |
Jul |
Aug |
Sep |
Oct |
Nov |
Dec |
|
Temp. |
37.8 |
55.4 |
52.0 |
58.0 |
74.1 |
79.0 |
80.5 |
79.4 |
79.5 |
65.6 |
48.0 |
46.2 |
|
Normal |
41.1 |
44.3 |
52.1 |
59.8 |
68.2 |
75.9 |
79.4 |
78.6 |
72.0 |
61.1 |
50.9 |
42.6 |
|
DFN |
-3.3 |
+11.1 |
-0.1 |
-1.8 |
+5.9 |
+3.1 |
+1.1 |
+0.8 |
+7.5 |
+4.5 |
-2.9 |
+3.6 |
Temp. Extremes (ºF)
|
Site |
Warmest Temp. |
Coldest Temp. |
|
Athens |
96 (6/19, 6/20, 9/9, 9/14) |
11 (1/2)* |
|
Atlanta |
95 (9/14, 9/15) |
13 (1/2) |
|
Columbus |
97 (6/20, 7/11, 8/6, 9/14, 9/15, 9/17, 9/19, 9/20) |
18 (1/18) |
|
Macon |
100 (9/18)* |
16 (1/2) |
|
Cartersville |
95 (9/19*, 9/20) |
9 (1/2)* |
|
DeKalb Peachtree Arpt |
95 (9/14)* |
11 (1/2)* |
|
Fulton Co. Arpt |
95 (9/20)* |
12 (1/2)* |
|
Gainesville |
94 (9/14)* |
12 (1/2)* |
|
Peachtree City |
96 (9/14*, 9/19*, 9/20*) |
14 (1/2)* |
|
Rome |
95 (6/16, 6/17, 7/11, 7/18, 8/6, 8/7, 9/7, 9/14, 9/20) |
13 (1/2, 1/5, 1/17) |
* Set record for day
Annual Precipitation Totals (inches) and Rankings
* Click on site name below to view a graph with additional data
|
Site |
Total Precip. and Current Ranking |
Normal |
Dep. from Normal |
Previous Records |
|
69.26 (3rd Wettest) |
46.33 |
+22.93 |
72.37 (1929) |
|
|
70.03 (2nd Wettest) |
49.71 |
+20.32 |
71.45 (1948) |
|
|
66.43 (6th Wettest) |
46.75 |
+19.68 |
80.20 (2009) |
|
|
49.06 (35th Wettest) |
45.68 |
+3.38 |
72.67 (2013) |
|
|
Cartersville |
59.51 |
49.93 |
+9.58 |
|
|
DeKalb Peachtree Arpt |
67.22 |
52.97 |
+14.25 |
|
|
Fulton Co. Arpt |
68.35 |
51.17 |
+17.18 |
|
|
Gainesville |
68.82 |
53.98 |
+14.84 |
|
|
Peachtree City |
61.86 |
49.99 |
+11.87 |
|
|
Rome |
67.07 |
51.92 |
+15.15 |
|
Monthly Precipitation Totals (inches)
DFN = Departure from normal
Athens
|
Month |
Jan |
Feb |
Mar |
Apr |
May |
Jun |
Jul |
Aug |
Sep |
Oct |
Nov |
Dec |
|
Total |
4.63 |
5.78 |
3.18 |
5.49 |
9.31 |
7.28 |
4.98 |
4.36 |
1.75 |
4.26 |
7.35 |
10.89 |
|
Normal |
4.05 |
4.48 |
4.43 |
3.15 |
3.00 |
4.18 |
4.47 |
3.53 |
3.94 |
3.55 |
3.82 |
3.73 |
|
DFN |
+0.58 |
+1.30 |
-1.25 |
+2.34 |
+6.31 |
+3.10 |
+0.51 |
+0.83 |
-2.19 |
+0.71 |
+3.53 |
+7.16 |
Atlanta
|
Month |
Jan |
Feb |
Mar |
Apr |
May |
Jun |
Jul |
Aug |
Sep |
Oct |
Nov |
Dec |
|
Total |
3.26 |
6.11 |
4.86 |
6.53 |
4.45 |
3.86 |
8.04 |
7.59 |
1.48 |
4.75 |
7.27 |
11.83 |
|
Normal |
4.20 |
4.67 |
4.81 |
3.36 |
3.67 |
3.95 |
5.27 |
3.90 |
4.47 |
3.41 |
4.10 |
3.90 |
|
DFN |
-0.94 |
+1.44 |
+0.05 |
+3.17 |
+0.78 |
-0.09 |
+2.77 |
+3.69 |
-2.99 |
+1.34 |
+3.17 |
+7.93 |
Columbus
|
Month |
Jan |
Feb |
Mar |
Apr |
May |
Jun |
Jul |
Aug |
Sep |
Oct |
Nov |
Dec |
|
Total |
1.60 |
3.56 |
3.15 |
5.02 |
9.93 |
5.74 |
5.00 |
7.69 |
6.50 |
4.14 |
6.17 |
7.93 |
|
Normal |
3.85 |
4.44 |
5.46 |
3.55 |
3.19 |
3.72 |
4.76 |
3.77 |
3.06 |
2.58 |
4.10 |
4.27 |
|
DFN |
-2.25 |
-0.88 |
-2.31 |
+1.47 |
+6.74 |
+2.02 |
+0.24 |
+3.92 |
+3.44 |
+1.56 |
+2.07 |
+3.66 |
Macon
|
Month |
Jan |
Feb |
Mar |
Apr |
May |
Jun |
Jul |
Aug |
Sep |
Oct |
Nov |
Dec |
|
Total |
2.14 |
3.49 |
2.65 |
4.99 |
6.99 |
3.32 |
6.37 |
1.63 |
1.02 |
4.62 |
5.58 |
6.26 |
|
Normal |
4.24 |
4.36 |
4.55 |
2.96 |
2.72 |
4.06 |
4.95 |
4.10 |
3.59 |
2.79 |
3.32 |
4.04 |
|
DFN |
-2.10 |
-0.87 |
-1.90 |
+2.03 |
+4.27 |
-0.74 |
+1.42 |
-2.47 |
-2.57 |
+1.83 |
+2.26 |
+2.22 |
Cartersville
|
Month |
Jan |
Feb |
Mar |
Apr |
May |
Jun |
Jul |
Aug |
Sep |
Oct |
Nov |
Dec |
|
Total |
1.68 |
8.34 |
5.30 |
4.55 |
2.51 |
4.03 |
3.29 |
3.62 |
3.40 |
4.80 |
8.26 |
9.73 |
|
Normal |
4.60 |
4.90 |
4.72 |
3.91 |
4.03 |
3.84 |
4.66 |
3.93 |
3.62 |
3.40 |
4.08 |
4.24 |
|
DFN |
-2.92 |
+3.44 |
+0.58 |
+0.64 |
-1.52 |
+0.19 |
-1.37 |
-0.31 |
-0.22 |
+1.40 |
+4.18 |
+5.49 |
DeKalb Peachtree Arpt
|
Month |
Jan |
Feb |
Mar |
Apr |
May |
Jun |
Jul |
Aug |
Sep |
Oct |
Nov |
Dec |
|
Total |
2.41 |
5.05 |
5.48 |
4.18 |
5.79 |
6.91 |
7.49 |
5.18 |
1.19 |
3.99 |
7.53 |
12.02 |
|
Normal |
4.80 |
5.01 |
4.98 |
3.65 |
4.05 |
4.76 |
5.02 |
4.31 |
4.56 |
3.45 |
4.22 |
4.16 |
|
DFN |
-2.39 |
+0.04 |
+0.50 |
+0.53 |
+1.74 |
+2.15 |
+2.47 |
+0.87 |
-3.37 |
+0.54 |
+3.31 |
+7.86 |
Fulton Co. Arpt
|
Month |
Jan |
Feb |
Mar |
Apr |
May |
Jun |
Jul |
Aug |
Sep |
Oct |
Nov |
Dec |
|
Total |
2.32 |
5.06 |
4.42 |
4.24 |
6.55 |
6.53 |
7.50 |
5.19 |
1.18 |
7.19 |
7.03 |
11.14 |
|
Normal |
4.27 |
4.90 |
4.81 |
3.74 |
3.77 |
4.13 |
5.06 |
4.74 |
3.98 |
3.61 |
4.17 |
3.99 |
|
DFN |
-1.95 |
+0.16 |
-0.39 |
+0.50 |
+2.78 |
+2.40 |
+2.44 |
+0.45 |
-2.80 |
+3.58 |
+2.86 |
+7.15 |
Gainesville
|
Month |
Jan |
Feb |
Mar |
Apr |
May |
Jun |
Jul |
Aug |
Sep |
Oct |
Nov |
Dec |
|
Total |
2.40 |
6.48 |
3.48 |
5.74 |
9.01 |
4.64 |
2.72 |
7.52 |
1.87 |
4.56 |
8.16 |
12.24 |
|
Normal |
5.03 |
4.87 |
5.42 |
3.56 |
4.04 |
4.39 |
4.51 |
4.43 |
4.68 |
4.08 |
4.47 |
4.50 |
|
DFN |
-2.63 |
+1.61 |
-1.94 |
+2.18 |
+4.97 |
+0.25 |
-1.79 |
+3.09 |
-2.81 |
+0.48 |
+3.69 |
+7.74 |
Peachtree City
|
Month |
Jan |
Feb |
Mar |
Apr |
May |
Jun |
Jul |
Aug |
Sep |
Oct |
Nov |
Dec |
|
Total |
4.09 |
4.69 |
4.23 |
5.01 |
4.61 |
5.87 |
6.37 |
4.70 |
1.31 |
4.79 |
5.53 |
10.66 |
|
Normal |
4.20 |
4.90 |
5.11 |
3.92 |
3.39 |
3.63 |
5.26 |
4.32 |
3.84 |
3.41 |
3.87 |
4.14 |
|
DFN |
-0.11 |
-0.21 |
-0.88 |
+1.09 |
+1.22 |
+2.24 |
+1.11 |
+0.38 |
-2.53 |
+1.38 |
+1.66 |
+6.52 |
Rome
|
Month |
Jan |
Feb |
Mar |
Apr |
May |
Jun |
Jul |
Aug |
Sep |
Oct |
Nov |
Dec |
|
Total |
1.22 |
7.61 |
3.74 |
4.50 |
2.80 |
4.71 |
3.22 |
7.66 |
9.08 |
3.60 |
8.60 |
10.33 |
|
Normal |
4.82 |
4.87 |
4.95 |
4.05 |
4.18 |
4.1 |
4.32 |
4.13 |
3.41 |
3.86 |
4.85 |
4.38 |
|
DFN |
-3.60 |
+2.74 |
-1.21 |
+0.45 |
-1.38 |
+0.39 |
-0.91 |
+4.25 |
+5.22 |
-1.25 |
+4.22 |
+5.95 |
Annual Precip. Extremes (in)
|
Site |
Highest Daily Amount |
|
Athens |
2.83 (6/26) |
|
Atlanta |
4.16 (4/23) |
|
Columbus |
3.70 (5/23) |
|
Macon |
3.22 (10/10) |
|
Cartersville |
3.52 (11/12) |
|
DeKalb Peachtree Arpt |
3.12 (12/28) |
|
Fulton Co. Arpt |
4.34 (10/10) |
|
Gainesville |
3.44 (11/12) |
|
Peachtree City |
3.09 (10/10) |
|
Rome |
4.02 (8/1) |
Annual Snowfall Totals (inches) – (Jan to Dec)
|
Site |
Total |
Normal |
Dep. from Normal |
Records |
|
Athens |
1.1 |
2.9 |
-1.80 |
10.6 (1983) |
|
Atlanta |
2.4 |
2.9 |
-0.50 |
10.5 (1936) |
|
Columbus |
2.0 |
0.4 |
+1.60 |
14.0 (1973) |
|
Macon |
1.0 |
0.7 |
+0.30 |
16.5 (1973) |
2018 Narrative Climate Summary For North and Central Georgia
2018 was definitely a year of extremes for north and central Georgia as well as multiple other parts of the country. From several snow storms to hurricanes to record-breaking temperatures to severe storms and flooding, we experienced many different weather events locally.
January began with well below average temperatures across all of north and central Georgia. Wind chills January 1st dipped down into the teens and single digits across the whole area! Athens even broke a record low temperature by reaching a frigid 11 degrees on January 2nd. Then, just a day later on the 3rd, a snow storm dumped 1 to 3 inches of snow across portions of east central Georgia. Two weeks later on the 16th, another system moved across the area leaving up to 4 inches of snow across portions of west central Georgia.
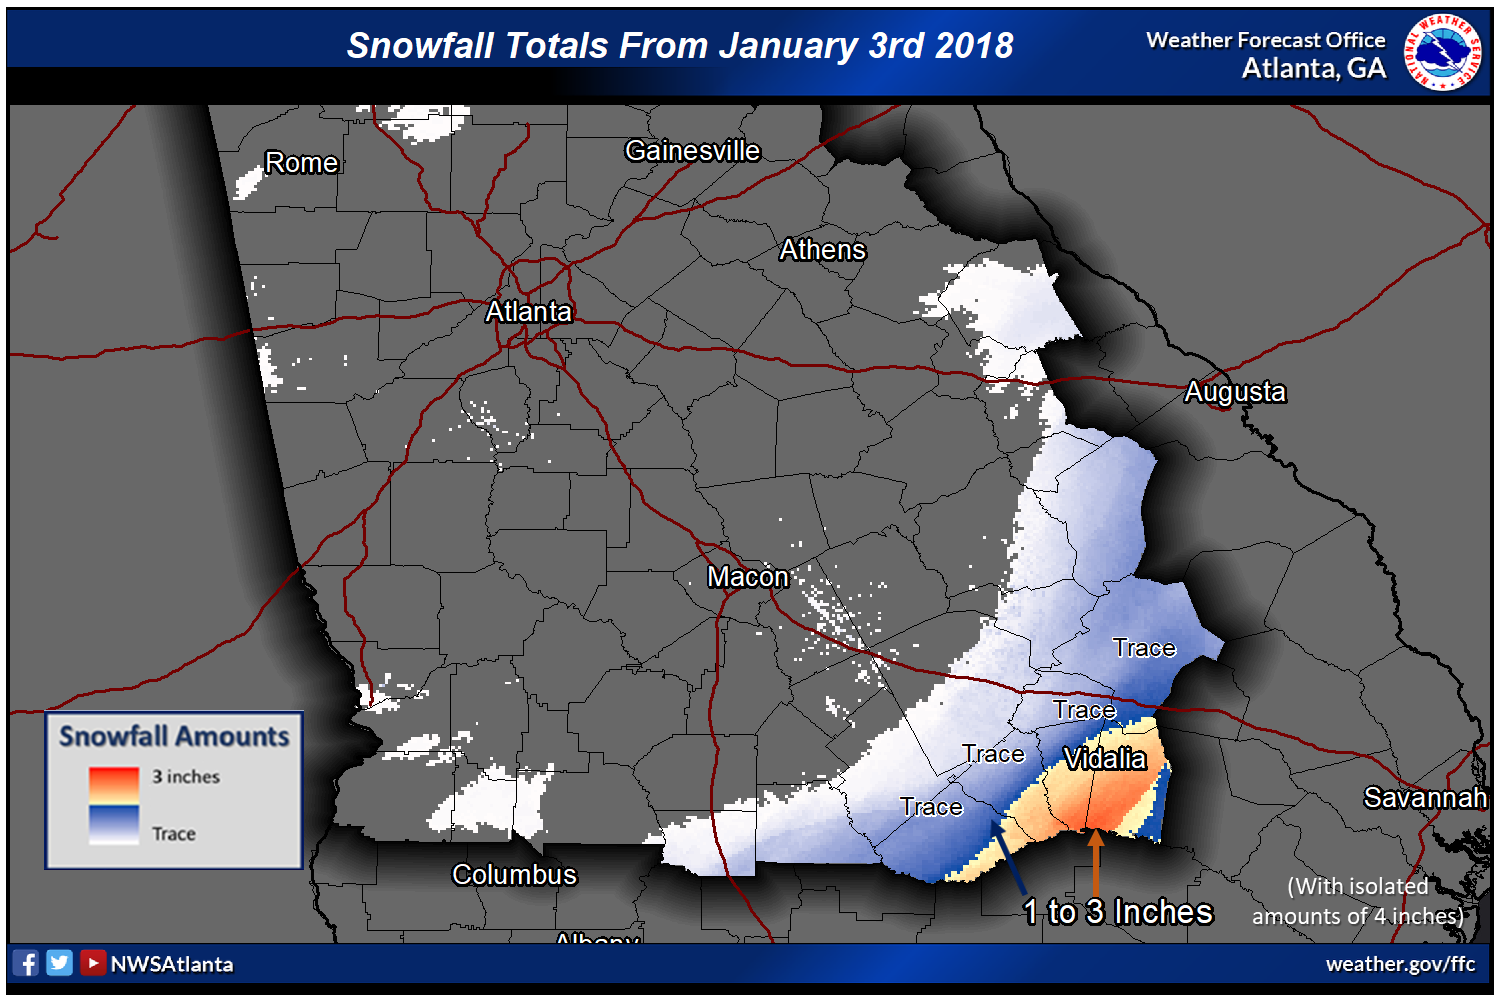 |
| January 3rd Snowfall Totals |
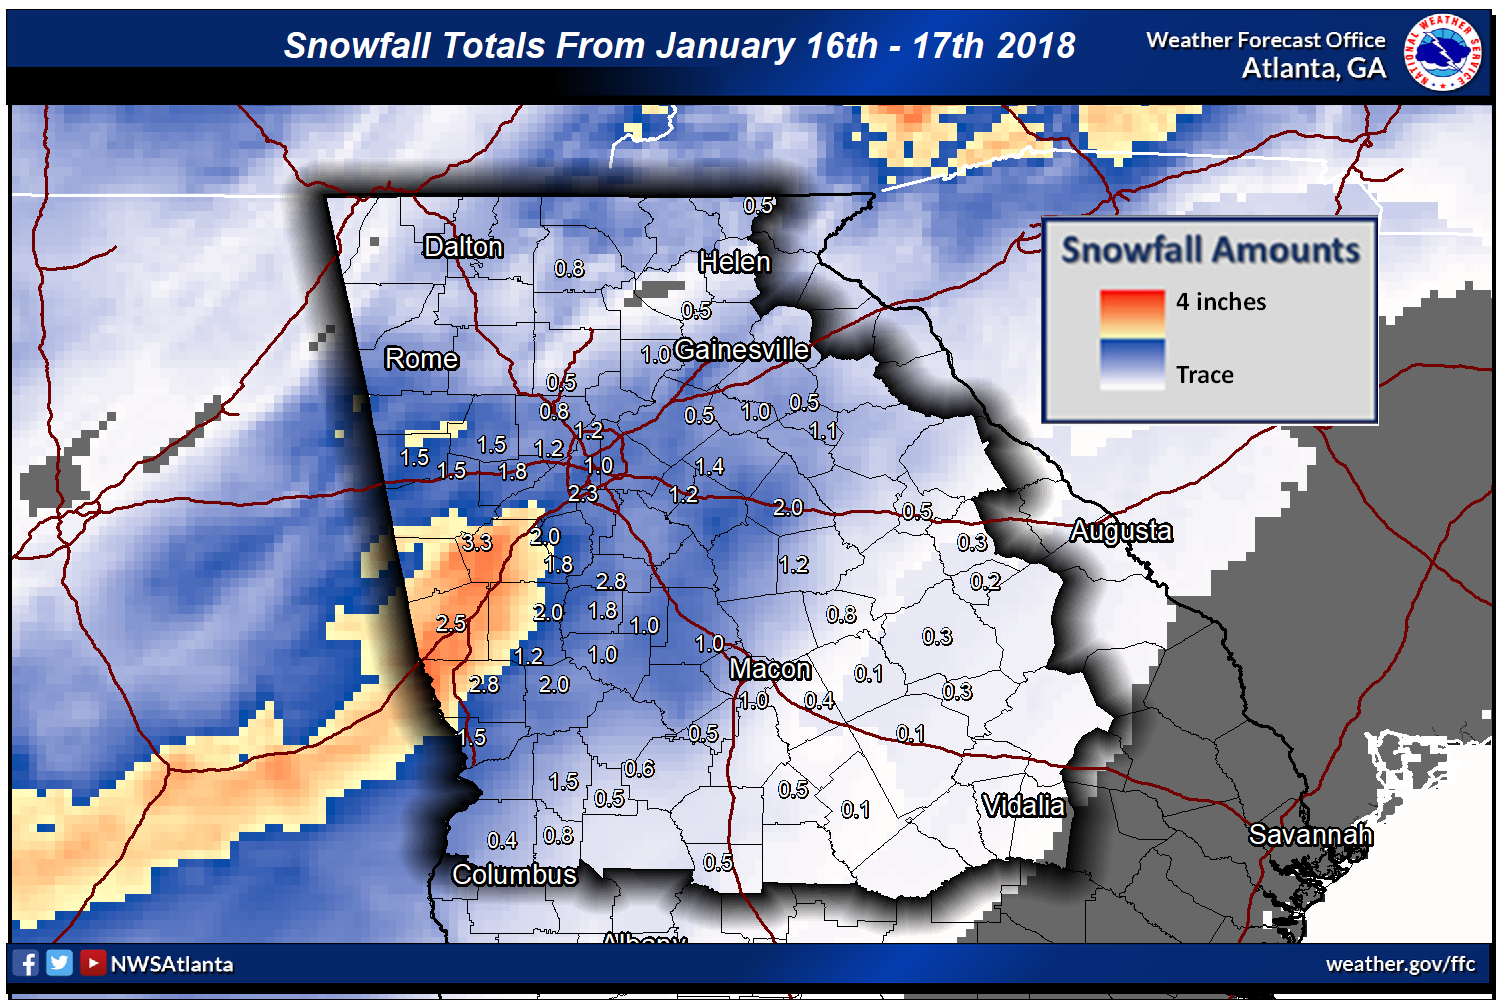 |
| January 16th -17th Snowfall Totals |
February continued to be cold and wet as a wedge set up on the 3rd, bringing freezing rain to northeast Georgia. The wintry precipitation was followed by severe weather just days later when three tornadoes (two EF-0s, one EF-1) moved through Haralson, Heard, and Talbot counties the morning the 7th. The rest of February was fairly quiet aside from the well above average temperatures, especially in the second half of the month. Temperatures soared to record high temperatures in Atlanta on the 17th, 21st, 22nd, and 24th, in Athens on the 16th and the 21st through the 24th, in Columbus on the 17th, 19th, and the 21st through the 24th, and in Macon on the 17th, 21st, and the 24th. Overall, February was the warmest February on record (using average temperature) for Athens (57.4 deg), Atlanta (57.3 deg), Columbus (62.3 deg), and Macon (60.3 deg).
The beginning of March, while quiet weather-wise, also experienced a few days of well above average temperatures and multiple broken high temperature records. Columbus and Macon both broke high temperature records on March 1st at 83 deg and 85 deg, respectively. The second half of March included an EF-1 tornado that snapped numerous trees on a hillside as it moved through White county on the night of the 17th. Just two days later on the evening of the 19th, a low pressure system crossed the area prompting a ‘Moderate Risk’ severe weather outlook from the Storm Prediction Center. Numerous severe thunderstorms crossed the area, downing trees with straight line winds and spawning three tornadoes. Two tornadoes were reported in Haralson County (EF-1s) and another in South Fulton (EF-2). The South Fulton tornado crossed between Fairburn and Campbellton causing significant damage to houses in the path of the storm.
 |
|
Damage to homes in a neighborhood in South Fulton |
April was a cooler month overall and as such was slightly calmer as far as severe weather. Athens and Macon had the 13th coldest (58.8 deg) and 12th coldest (61.2 deg) Aprils on record, respectively.
After slightly cooler temperatures in April, temperatures rebounded, bringing a record-breaking May. Overall, Athens was the 7th warmest May on record (73.5 deg), Atlanta recorded its warmest May ever (74.8 deg), and Columbus had the 5th warmest May on record (77.1 deg). High temperature records were broken in Athens on the 12th when the high temperature reached 93 degrees. Atlanta also broke two high temperature records on the 13th and 14th when temperatures soared to 91 degrees. May was also a very wet month across the area, leading many creeks and rivers to reach flood stage as well as multiple flash flooding events. On the 23rd, 3 to 7 inches of rain fell over Harris County, Muscogee, Talbot, and Upson counties which led to flash flooding. Several homes were damaged and roads were damaged, closed, and washed out all around the aforementioned counties. Subtropical Storm Alberto made landfall in Florida on the 28th of the month. Alberto enhanced moisture across our area, leading to periods of heavy rainfall. One of these instances of heavy rainfall was on the 29th through the 31st when White County experienced multiple days with 2 to 5 inches of heavy rainfall, causing extreme flooding across the county. Significant flooding occurred in Helen on the 31st, sending the Chattahoochee River raging over its banks and leaving standing water all over downtown Helen. Overall, Athens had the 5th wettest May on record with 9.31 inches recorded. Columbus recorded its 2nd wettest May on record with 9.93 inches. Macon also recorded its 4th wettest May on record with 6.99 inches.
 |
| Flooding in downtown Helen |
Temperatures in June were generally just slightly above average across much of the area. Meanwhile, Atlanta had the 12th warmest June on record. Several episodes of severe weather threatened portions of north and central Georgia through the month. The most notable was June 1st. This day was outlooked by the Storm Prediction Center to have an ‘Enhanced Risk’ of severe weather. Later that day, a downburst occurred in Lilburn with 85 to 90 mph winds that downed a 6-mile swath of trees onto houses and into the streets. Towards the end of the month on the 22nd, an EF-0 tornado moved through Walker County near the city of Ringgold downing trees and causing damage to several structures. On the 28th of June, a derecho crossed the area causing significant tree damage across portions of north and central Georgia. Some of the highest winds from the derecho event were recorded in Peachtree City (53 mph), at the Atlanta airport (49 mph), at Fort Benning (49 mph), and in Coosa (42 mph).
 |
| Damage to property in Ringgold |
Similar to May, July also saw several flooding events across north and central Georgia. On the 6th, heavy rainfall fell near the downtown connector causing water to pool on the highway and creating delays. The 21st also included a derecho in addition to flooding. Very intense thunderstorms moved through northern Georgia on this day with damaging winds and torrential rainfall. Gilmer County was one area with significant damage. A storm survey identified strong winds estimated at 80 to 85 mph in a 2.5 to 3-mile wide swath of damage that extended almost 5 miles. Additionally, 2 to 4 inches of precipitation fell across portions of northern Georgia leading to flooding issues and rises in rivers and streams in north Georgia. On the last day of the month, Polk County received several inches of rainfall, causing flooding of yards, homes, and roadways.
 |
| Flooding in the roadway and a partially submerged car in Cedartown |
 |
| A pool submerged in floodwaters in a backyard in Cedartown |
Severe weather returned at the start of August when an EF-1 tornado moved through the city of Social Circle on August 1st, damaging multiple homes and downing many trees. From the last day in July through the morning of August 3rd, nearly 2 to 6+ inches fell across portions of north and central Georgia. This rainfall led to flooding issues across the area, especially in a portion of Clayton County where overwhelmed drains backed up and led to standing water in the roadway as well as damaged roads.
 |
| Flooded roadway in Clayton County |
September turned out to be very hot and dry. Most locations across north and central Georgia were 2 to 3 inches drier than normal, except the areas impacted by Hurricane Florence. According to average temperatures, Athens experienced the 5th warmest September on record with 79.9 deg (normal value is 73.3 deg), Atlanta had the 2nd warmest September on record with 81.0 deg (normal value is 73.5 deg), Columbus had the 3rd warmest September on record with 82.6 deg (normal value is 76.6 deg), and Macon had the 2nd warmest September on record with 82.1 deg (normal value is 75.0 deg). Macon set multiple high temperature records including 99 degrees on the 14th, 98 degrees on the 17th, 100 degrees on the 18th, and 96 degrees on the 26th.
The heat continued across north and central Georgia for the month of October. Overall, Athens had the 10th warmest October on record (66.3 deg), Atlanta had the 6th warmest October on record (67.4 deg), Columbus had the 11th warmest October on record (70.3 deg), and Macon had the 10th warmest October on record (68.9). A couple of high temperature records were broken in October—one in Athens on the 4th (91 deg) and another in Macon on the 16th (92 deg). October was also the month that the record was broken for the number of consecutive days at 60 degrees or higher at Atlanta, Athens, Columbus, and Macon. The previous records were 136 days (2002), 130 days (1978), 144 days (1921), and 151 days (1911), respectively. The new records are 159 days for Atlanta (ending on the 10th), 153 days for Athens (ending on the 11th), 156 days for Columbus (ending on the 11th), and 155 days for Macon (ending on the 11th).
Another very significant event in October was record-breaking Hurricane Michael. Hurricane Michael made landfall along the Florida panhandle near Panama City on the afternoon of October 10th as a high-end Category 4 hurricane. This hurricane was the first Major Hurricane to directly impact Georgia since the 1890s. After landfall, the storm crossed Georgia through October 11th, bringing wind gusts from 50 to 76+ mph to portions of central GA. Some of the highest gusts across central Georgia were reported in Crisp County (76 mph, 69 mph, 63 mph), Dodge County (63 mph), Laurens County (61 mph), Jefferson County (60 mph), Telfair County (59 mph), and Dooly County (58 mph). Even higher wind speeds were reported in southwest Georgia where the hurricane moved inland just after landfall. In addition to high winds, Michael brought heavy rainfall to much of the area with totals in excess of 5 inches in some locations. Three tornadoes were also reported from Michael in Peach County (EF-0), Crawford County (EF-1), and Fulton County (EF-0). November saw just a few days of severe weather, including a QLCS that passed through the area and spawned an EF-0 tornado that passed south of Macon, near the city of Byron. This tornado caused damage to several trees as well as a few structures. November was also a below average month for temperatures, which was a welcome relief after a well above average September and October. Temperatures were generally 2 to 5 degrees below average across the area.
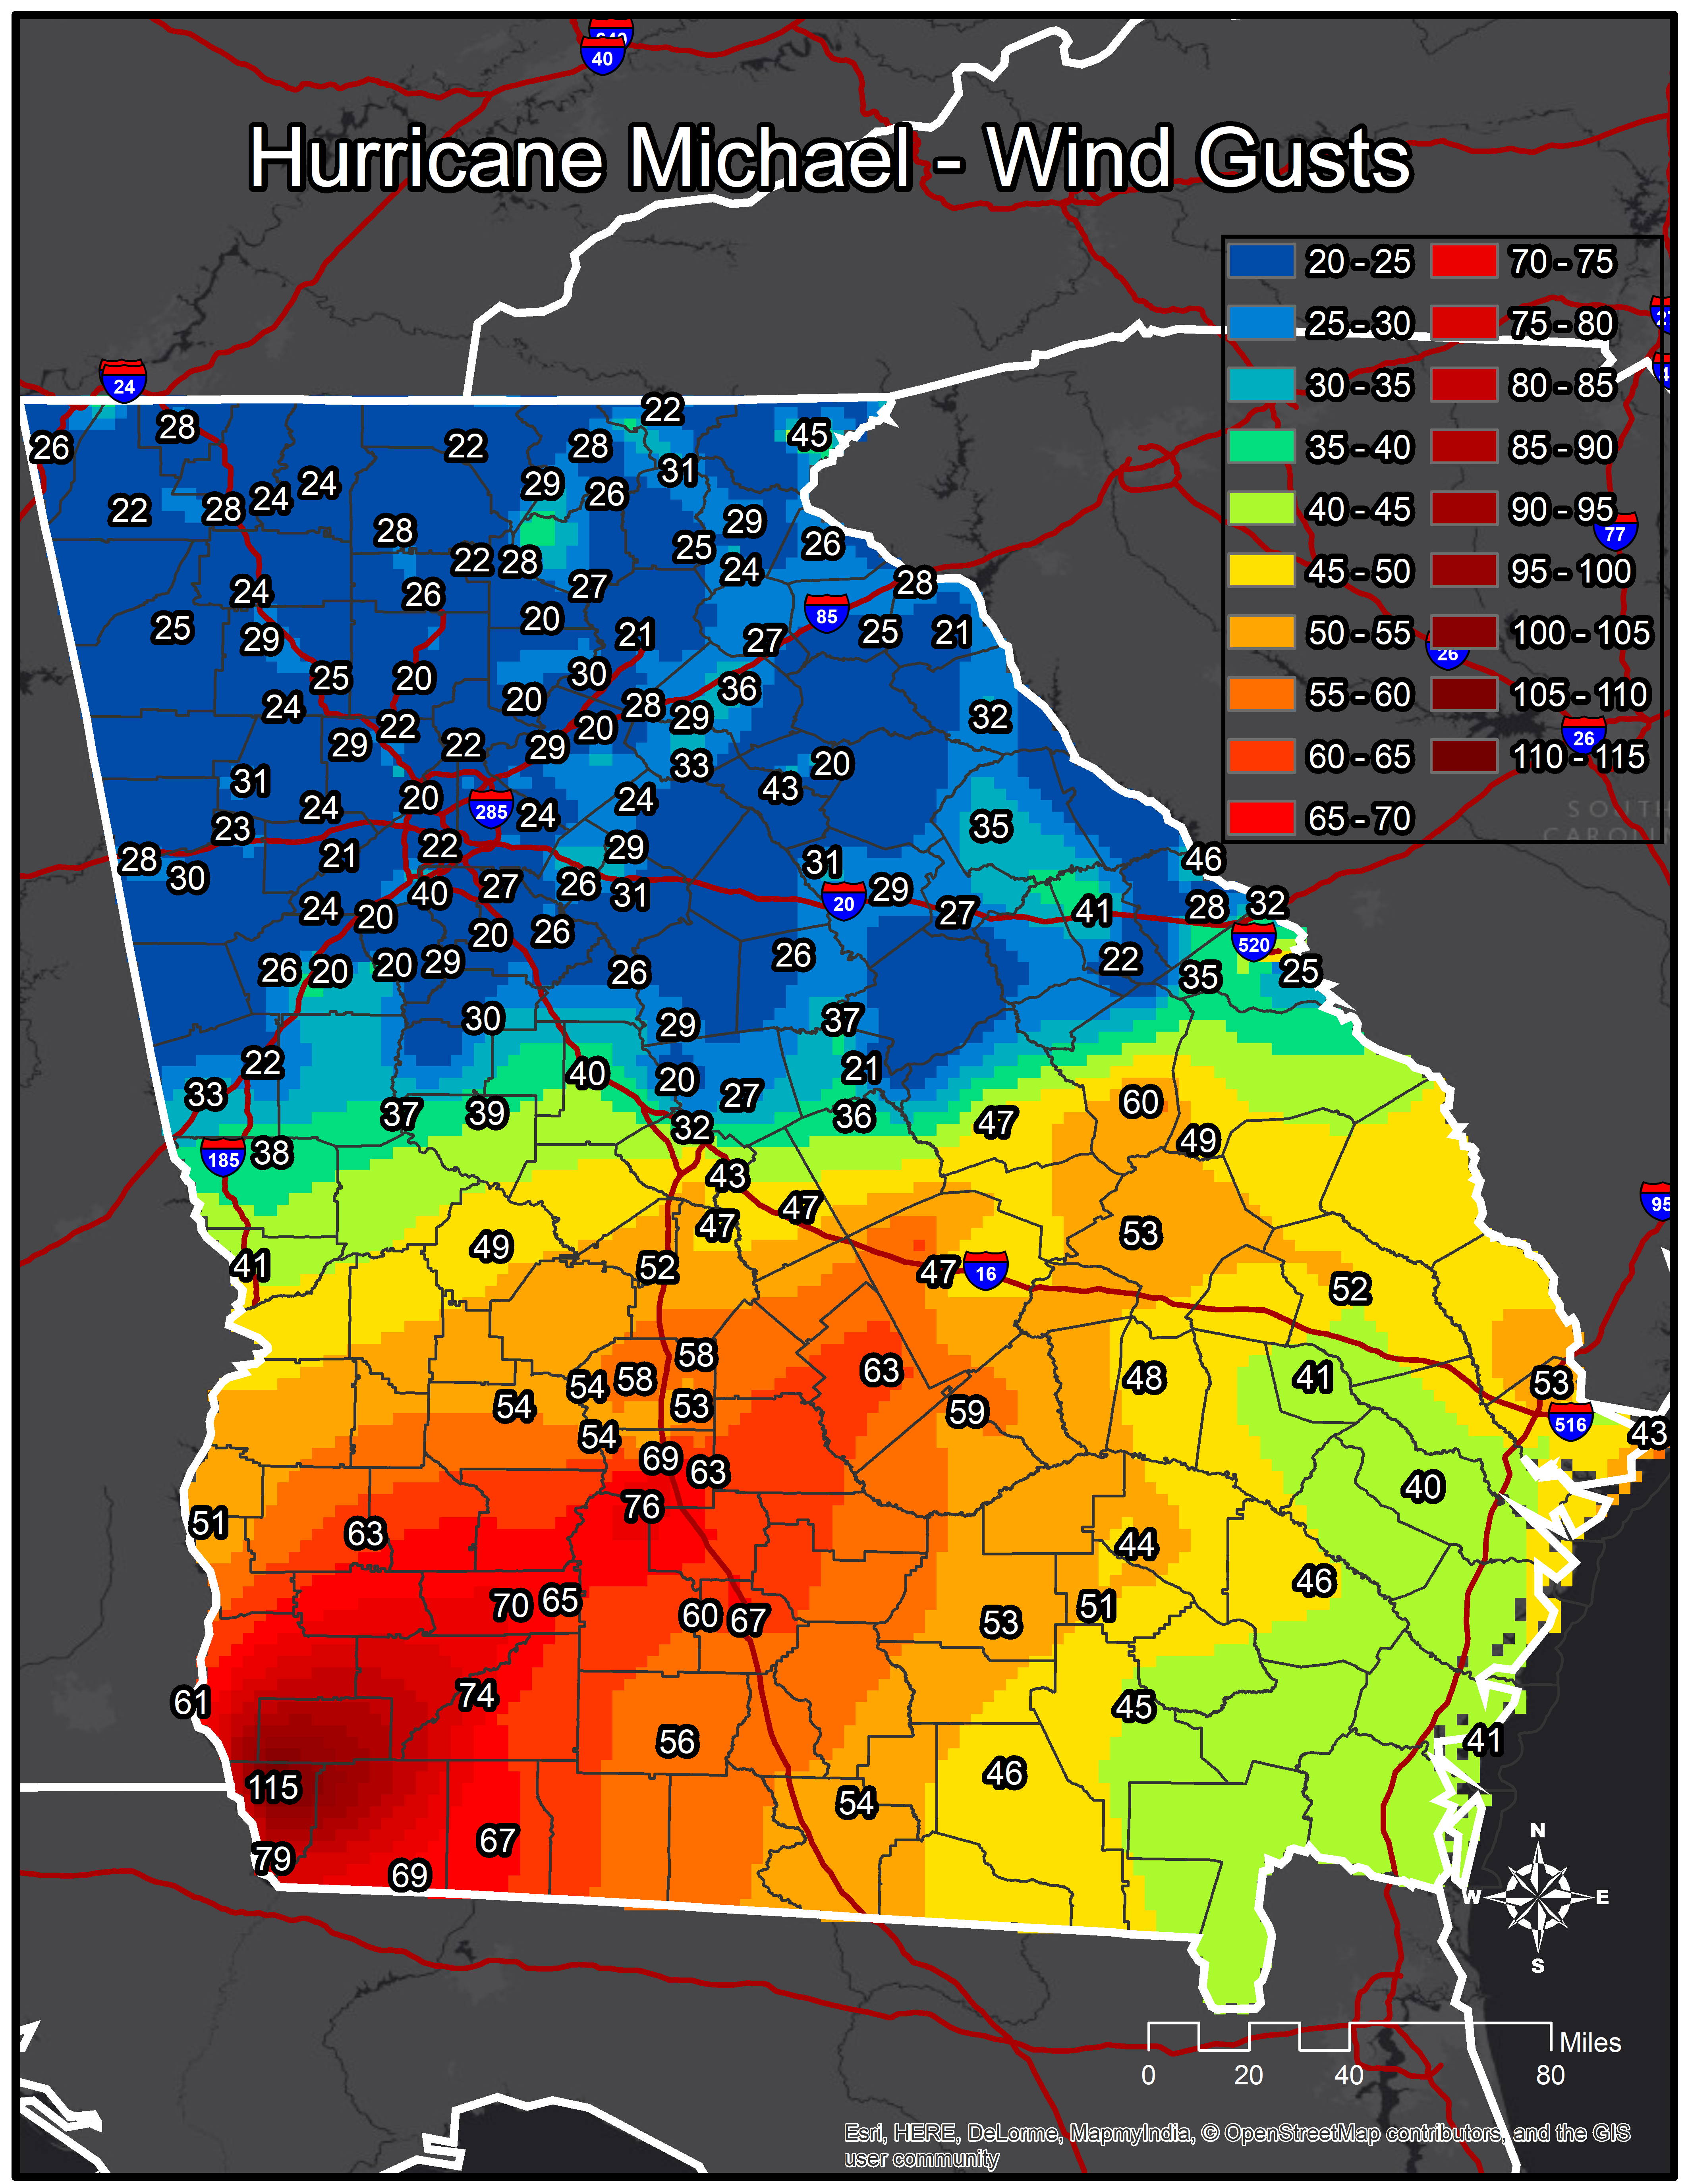 |
| Strongest Wind Gusts from Hurricane Michael for the state of Georgia |
November saw just a few days of severe weather, including a QLCS that passed through the area and spawned an EF-0 tornado that passed south of Macon, near the city of Byron. This tornado caused damage to several trees as well as a few structures. November was also a below average month for temperatures, which was a welcome relief after a well above average September and October. Temperatures were generally 2 to 5 degrees below average across the area.
December rainfall followed an already wet/above normal fall for the state. Heavy rain continued and wintry precipitation arrived in the area on the weekend of the 8th. Snow showers and ice fell in parts of northern Georgia. Ice accumulations even measured three quarters to one inch in portions of Dawson County.
 |
| Ice accumulations near Burnt Mountain |
Overall, temperatures for 2018 were about 1 to 3 degrees above average, and precipitation was about 4 to 22 inches above average across all of north and central Georgia. As evidenced above, 2018 shaped up to be a very eventful weather year across north and central Georgia.
Data prepared by the Atlanta Forecast Office. Normal values provided are from the 1981-2010 period.


 Follow us on YouTube