As anyone who lives in the area probably knows, 2010 was a very wet year across southeastern South Dakota, southwestern Minnesota, and northwestern Iowa. Looking at the available data, 45 National Weather Service observation locations (Airports, Cooperative Observers) in the area saw precipitation totals in 2010 that ranked in the top 5 on record, including 16 sites that established new record high yearly precipitaiton totals.
The following table shows these locations. Note that these values include preliminary data that could be subject to change, and that there are some missing reports for several sites in 2010. Also, most sites have missing data for some days, months, or years in the historical period of record (POR).
|
LOCATION |
2010 |
Record |
Record |
P.O.R. |
2010 |
P.O.R. |
2010 % |
Notes |
|
Spencer, IA |
45.16 |
42.51 |
1951 |
1895- |
1st |
27.99 |
161.3% |
|
|
Hawarden, IA |
44.28 |
40.17 |
1983 |
1926- |
1st |
26.52 |
167.0% |
|
|
Marshall, MN |
43.86 |
39.83 |
1993 |
1935- |
1st |
26.25 |
167.1% |
|
|
Sioux Center, IA |
42.96 |
39.74 |
1983 |
1899- |
1st |
27.70 |
155.1% |
|
|
Akron, IA |
42.95 |
42.95 |
1951 |
1927- |
1st (tie) |
27.10 |
158.5% |
|
|
Wessington Springs, SD |
41.36 |
34.13 |
1995 |
1893- |
1st |
22.68 |
182.4% |
|
|
Rock Valley, IA |
40.96 |
39.38 |
1983 |
1978- |
1st |
28.49 |
143.8% |
|
|
Brookings, SD |
39.80 |
33.12 |
2005 |
1894- |
1st |
21.52 |
184.9% |
|
|
Flandreau, SD |
39.47 |
37.65 |
2005 |
1893- |
1st |
23.78 |
166.0% |
|
|
Pipestone, MN |
38.99 |
38.60 |
1993 |
1898- |
1st |
25.09 |
155.4% |
|
|
Minneota, MN |
38.97 |
37.22 |
1993 |
1948- |
1st |
25.29 |
154.1% |
|
|
Yankton, SD |
38.84 |
38.20 |
1944 |
1932- |
1st |
24.54 |
158.3% |
|
|
Sioux Falls, SD |
38.26 |
36.11 |
1993 |
1893- |
1st |
25.53 |
149.9% |
|
|
Howard, SD |
38.15 |
36.00 |
1942 |
1893- |
1st |
22.38 |
170.5% |
|
|
Forestburg, SD |
37.04 |
36.41 |
1914 |
1893- |
1st |
21.47 |
172.5% |
Missing 11/2010 and 12/2010 |
|
Wessington, SD |
35.10 |
33.09 |
2007 |
1929- |
1st |
19.14 |
183.4% |
Missing 11/2010 |
|
Sanborn, IA |
45.76 |
46.02 |
1951 |
1914- |
2nd |
28.55 |
160.3% |
|
|
Sioux Rapids, IA |
42.34 |
43.25 |
1993 |
1941- |
2nd |
30.16 |
140.4% |
|
|
Primghar, IA |
41.21 |
42.49 |
1951 |
1895- |
2nd |
28.91 |
142.5% |
Missing 23 days |
|
Rock Rapids, IA |
40.60 |
41.69 |
1944 |
1893- |
2nd |
26.72 |
151.9% |
|
|
Marion, SD |
39.10 |
39.74 |
1944 |
1901- |
2nd |
25.29 |
154.6% |
|
|
Tracy, MN |
38.12 |
40.64 |
1968 |
1912- |
2nd |
24.88 |
153.2% |
Missing 2/2010 |
|
Lakefield, MN |
37.59 |
39.06 |
2005 |
1996- |
2nd |
27.67 |
135.9% |
|
|
Montrose, SD |
35.47 |
36.90 |
1993 |
1963- |
2nd |
24.39 |
145.4% |
|
|
Huron, SD |
30.89 |
31.71 |
1962 |
1882- |
2nd |
20.06 |
154.0% |
|
|
Windom, MN |
41.03 |
44.84 |
2005 |
1905- |
3rd |
28.27 |
145.1% |
Missing 15 days |
|
Cherokee, IA |
40.89 |
42.86 |
1938 |
1922- |
3rd |
28.56 |
143.2% |
|
|
Lake Park, IA |
37.22 |
50.16 |
1993 |
1912- |
3rd |
28.05 |
132.7% |
|
|
Ocheyedan, IA |
36.36 |
49.12 |
1993 |
1971- |
3rd-tie |
29.15 |
124.7% |
|
|
Centerville, SD |
35.61 |
42.53 |
1944 |
1897- |
3rd |
25.23 |
141.1% |
|
|
Tyndall, SD |
35.48 |
38.27 |
1944 |
1893- |
3rd |
23.97 |
148.0% |
|
|
Canton, SD |
35.41 |
37.09 |
1951 |
1896- |
3rd |
24.81 |
142.7% |
Missing 17 days |
|
Menno, SD |
35.34 |
38.46 |
1944 |
1896- |
3rd |
23.86 |
148.1% |
|
|
DeSmet, SD |
35.07 |
36.85 |
1914 |
1893- |
3rd |
22.94 |
152.9% |
|
|
Iroquois, SD |
32.63 |
33.22 |
1972 |
1951- |
3rd |
20.97 |
155.6% |
|
|
White Lake, SD |
31.11 |
38.86 |
1962 |
1909- |
3rd |
20.28 |
153.4% |
|
|
Chamberlain, SD |
29.50 |
32.60 |
2007 |
1980- |
3rd |
23.28 |
126.7% |
|
|
Sheldon, IA |
41.53 |
46.02 |
1951 |
1899- |
4th |
28.57 |
145.4% |
|
|
Lake Wilson, MN |
34.95 |
46.90 |
1993 |
1973- |
4th |
27.26 |
140.1% |
|
|
Colton, SD |
36.21 |
41.01 |
1982 |
1978- |
4th |
27.60 |
131.2% |
|
|
Alexandria, SD |
33.81 |
34.80 |
193 |
1893- |
4th |
22.48 |
150.4% |
|
|
Arlington, SD |
33.21 |
35.11 |
1995 |
1929- |
4th |
23.83 |
139.4% |
|
|
Mitchell, SD |
33.10 |
36.14 |
1908 |
1896- |
4th |
22.26 |
148.7% |
|
|
Sibley, IA |
37.92 |
47.83 |
1979 |
1893- |
5th |
28.60 |
132.6% |
Missing 16 days |
|
Worthington, MN |
35.92 |
43.45 |
1993 |
1971- |
5th |
28.95 |
124.1% |
|


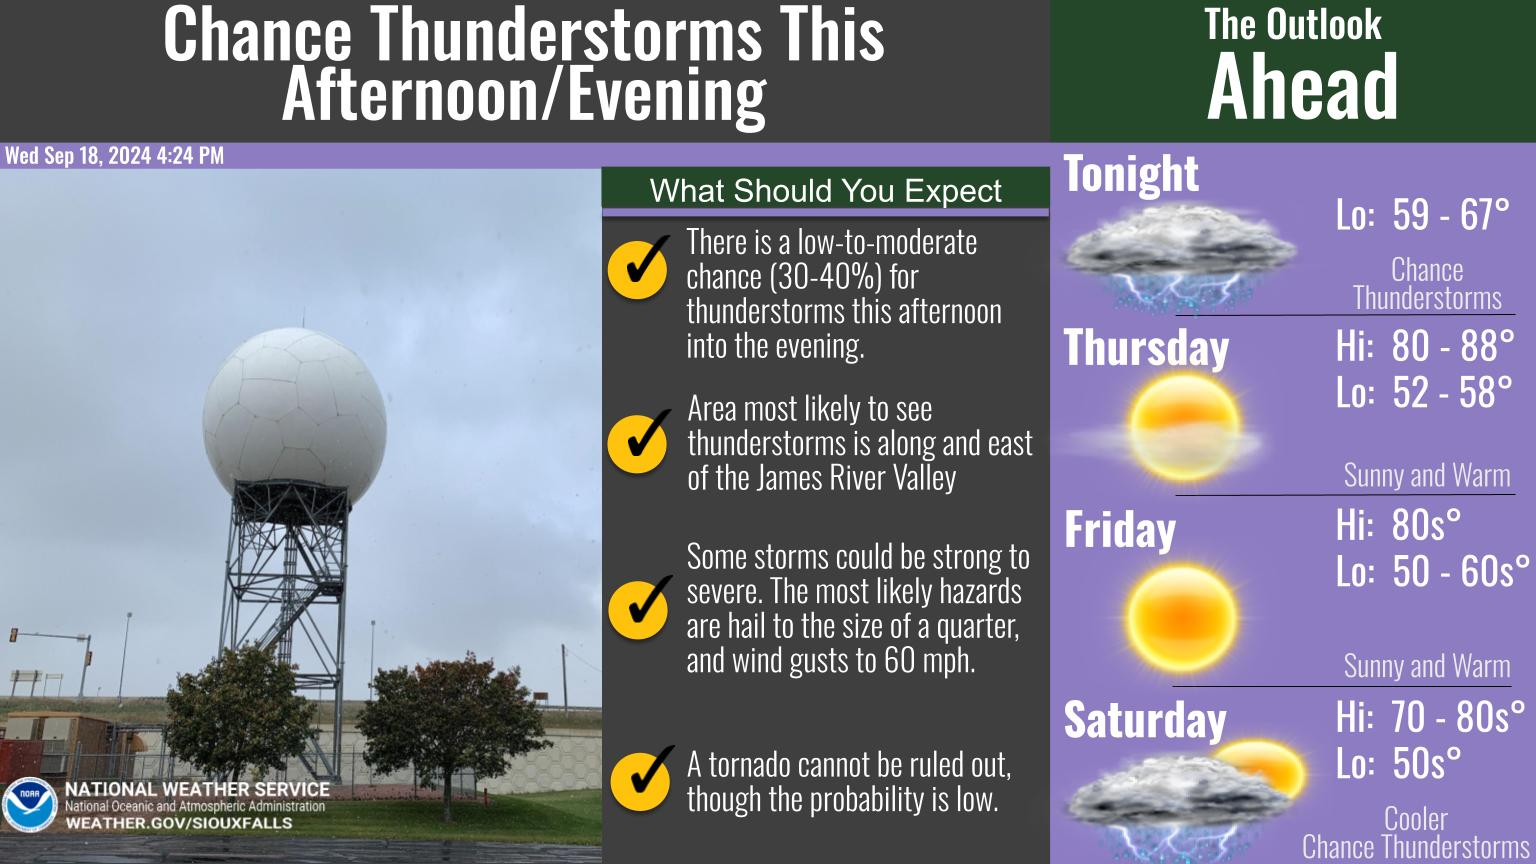 Weather Story
 Weather Map
 Local Radar
 Follow us on YouTube