If you have any weather photos/videos to share, please feel free to post them to our Facebook or Twitter pages, or send them to our webmaster e-mail account at: w-gid.webmaster@noaa.gov. Please let us know where the photo/video was taken, and at least an approximate time. Thanks!
°(Click on the links in the gray box below to quickly jump to sections located farther down the page)
| Tri-Cities & Ord Details & Monthly Extremes |
Graphs, Tables, Maps | Drought Monitor Graphics |
Monthly Precipitation & |
* Please Note: All climate data presented here are preliminary and have not undergone final quality control by the National Climatic Data Center (NCDC). Therefore, these data are subject to revision. Final and certified climate data can be accessed at: WWW.NCDC.NOAA.GOV.
July 2015 Weather/Climate Web Stories
(Click HERE for archive to all web stories)
| July 4: | Independence Day Climatology for Grand Island, NE |
July 2015 Climate And Weather Review For South Central Nebraska
And Portions Of North Central Kansas
The following narrative focuses on climate and weather highlights for the month of July 2015 across the NWS Hastings coverage area, encompassing 24 counties in south central and central Nebraska, and 6 counties in north central Kansas. Click here for a map of this coverage area. The temperature and precipitation data presented here are largely based on the NWS Cooperative Observer network, along with data from a handful of automated airport sites. All climate averages and "normals" presented here are based on the official NCDC 1981-2010 normals.
- TEMPERATURES...Unfortunately, due to time constraints, no Temperature narrative was written for July 2015
(Please look farther down the page for more information on July 2015 temperatures and extremes, including detailed breakdowns for Grand Island, Hastings, Kearney and Ord.)
- PRECIPITATION/FLOODING...Unfortunately, due to time constraints, no Precipitaton/Flooding narrative was written for July 2015
(Please look farther down the page for more information on July 2015 precipitation/snowfall and extremes, including rankings of wettest and driest locations, percent-of-normal plots, and a detailed breakdown for Grand Island, Hastings, Kearney and Ord. In addition, the link on the far upper right of this page contains an archive of monthly/annual precipitation and snowfall totals for around 70 locations.)
- DROUGHT STATUS (see images at bottom of page)...Unfortunately, due to time constraints, no Drought Status narrative was written for July 2015
- SEVERE THUNDERSTORMS/HIGH WINDS (for all official/finalized storm reports please refer to NCDC Storm Data)...Unfortunately, due to time constraints, no Severe Thunderstorm narrative was written for July 2015
- Number of Severe Thunderstorm Warning polygons issued by NWS Hastings in July 2015: 43 (11 less than July 2014)
- Number of Tornado Warning polygons issued by NWS Hastings in July 2015: 1 (Same as July 2014)
- Number of confirmed tornadoes within the NWS Hastings coverage area in July 2015: 0 (Same as July 2014)
|
...A FEW OF THE HOTTEST HIGH TEMPERATURES DURING JULY 2015 |
Various graphs and tables depicting July 2015 climate data for
South Central Nebraska and North Central Kansas:
* Please Note: These data are preliminary and have not undergone final quality control by the National Climatic Data Center (NCDC). Therefore, these data are subject to revision. Final and certified climate data can be accessed at WWW.NCDC.NOAA.GOV
 |
 |
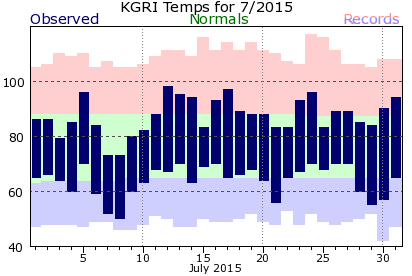
| Grand Island Temperature Summary: Observed daily maximum and minimum temperatures are connected by blue bars. Area between normal maximum and minimum temperatures is shaded green. Red bars connect record high temperatures. Blue bars connect record low temperatures. |
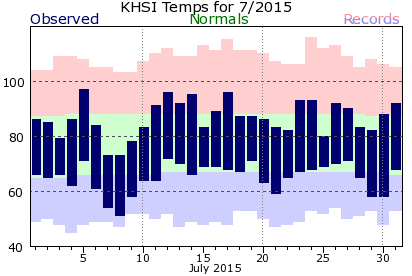
Hastings Temperature Summary: Observed daily maximum and minimum temperatures are connected by blue bars. Area between normal maximum and minimum temperatures is shaded green. Red bars connect record high temperatures. Blue bars connect record low temperatures. |
 |
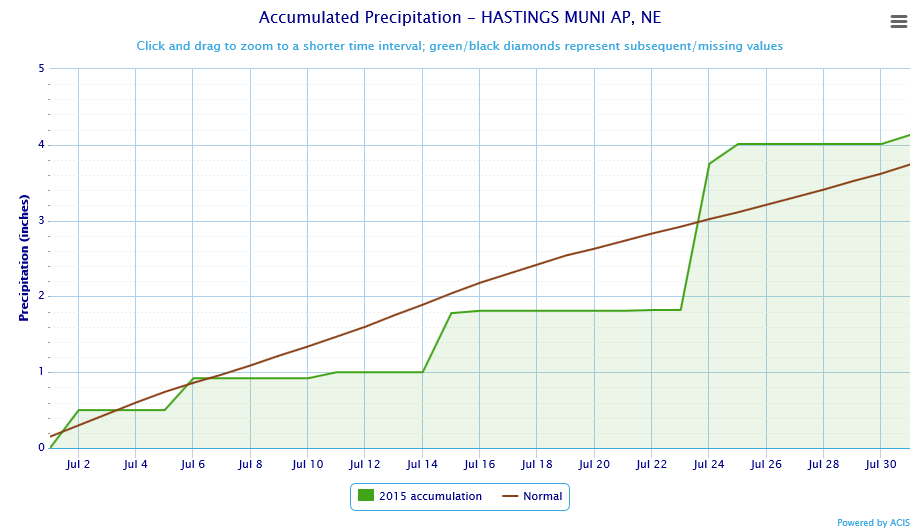 |
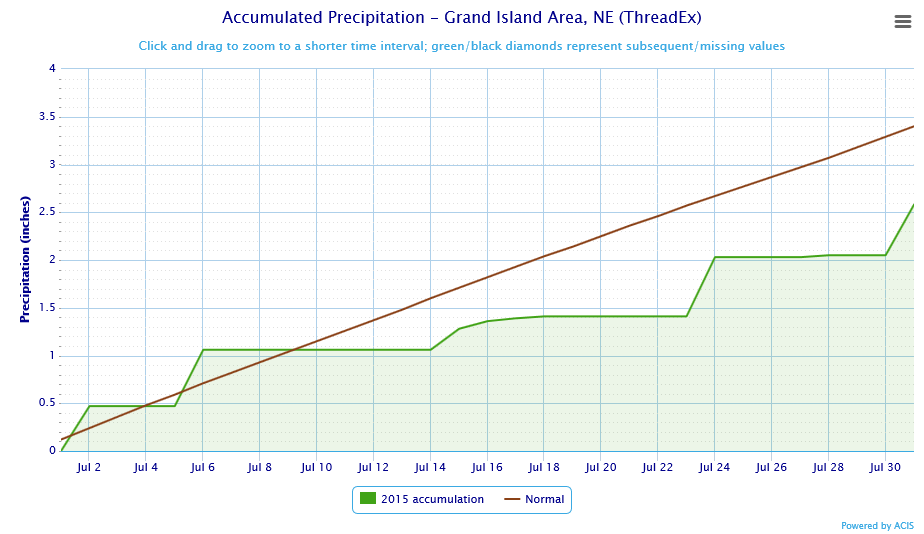
| Grand Island Precipitation Summary: Green line indicates cumulative observed precipitation for July 2015. Brown line indicates "normal" July precipitation based on 30-year data from 1981-2010. | Hastings Precipitation Summary: Green line indicates cumulative observed precipitation for July 2015. Brown line indicates "normal" July precipitation based on 30-year data from 1981-2010. |
| Grand Island (Regional Airport) - July 2014 - July 2015 | |||||||||||||||||||||||||
| July 2014 | Aug. | Sep. | Oct. | Nov. | Dec. | Jan. | Feb. | Mar. | Apr. | May | June | July | |||||||||||||
| Average High (F) | 84.9 | 84.5 | 76.3 | 68.7 | 47.3 | 37.1 | 40.1 | 36.3 | 60.4 | 64.8 | 69.4 | 82.6 | 87.3 | ||||||||||||
| Average Low (F) | 61.9 | 63.8 | 52.9 | 41.1 | 21.0 | 21.1 | 15.1 | 11.4 | 27.2 | 39.8 | 48.8 | 60.4 | 63.9 | ||||||||||||
| Average Temperature (F) | 73.4 | 74.1 | 64.6 | 54.9 | 34.2 | 29.1 | 27.6 | 23.8 | 43.8 | 52.3 | 59.1 | 71.5 | 75.6 | ||||||||||||
| Departure from Normal (F) | -2.8 | +0.1 | -0.5 | +2.7 | -3.9 | +2.4 | +2.5 | -5.3 | +4.4 | +1.7 | -2.1 | +0.2 | -0.6 | ||||||||||||
| Precipitation (inches) | 2.19 | 5.87 | 3.03 | 1.28 | 0.29 | 0.76 | 0.47 | 0.70 | 0.16 | 2.14 | 3.69 | 5.67 | 2.58 | ||||||||||||
| Departure from Normal | -1.21 | +2.75 | +0.80 | -0.58 | -0.88 | +0.13 | -0.06 | +0.02 | -1.64 | -0.39 | -0.72 | +1.37 | -0.82 | ||||||||||||
| Snowfall (inches) | 0.0 | 0.0 | 0.0 | 0.0 | 2.2 | 5.9 | 3.7 | 11.1 | 0.6 | 0.8 | 0.0 | 0.0 | 0.0 | ||||||||||||
| Departure from Normal | 0.0 | 0.0 | -0.1 | -1.0 | -0.9 | +0.8 | -2.8 | +4.8 | -4.8 | -0.7 | 0.0 | 0.0 | 0.0 | ||||||||||||
| Hastings (Municipal Airport) - July 2014 - July 2015 | |||||||||||||||||||||||||
| July 2014 | Aug. | Sep. | Oct. | Nov. | Dec. | Jan. | Feb. | Mar. | Apr. | May | June | July | |||||||||||||
| Average High (F) | 84.8 | 84.5 | 75.2 | 67.9 | 47.7 | 37.9 | 41.7 | 37.7 | 61.0 | 64.8 | 69.3 | 82.3 | 86.6 | ||||||||||||
| Average Low (F) | 62.4 | 63.7 | 53.5 | 41.6 | 21.2 | 22.4 | 16.3 | 12.9 | 27.8 | 41.3 | 50.0 | 61.7 | 65.0 | ||||||||||||
| Average Temperature (F) | 73.6 | 74.1 | 64.3 | 54.8 | 34.4 | 30.1 | 29.0 | 25.3 | 44.4 | 53.1 | 59.6 | 72.0 | 75.8 | ||||||||||||
| Departure from Normal (F) | -3.5 | -0.2 | -1.3 | +2.2 | -4.3 | +2.5 | +3.0 | -4.6 | +4.5 | +2.4 | -1.7 | +0.2 | -1.3 | ||||||||||||
| Precipitation (inches) | 1.48 | 7.79 | 1.78 | 1.76 | 0.23 | 0.54 | 0.77 | 0.34 | 0.20 | 3.55 | 3.86 | 8.05 | 4.13 | ||||||||||||
| Departure from Normal | -2.26 | +4.49 | -0.78 | -0.23 | -1.06 | -0.07 | +0.36 | -0.15 | -1.59 | +0.99 | -0.71 | +4.25 | +0.39 | ||||||||||||
| Snowfall NWS Office (inches) | 0.0 | 0.0 | 0.0 | 0.0 | 1.7 | 3.4 | 5.7 | 5.4 | 0.8 | Trace | 0.0 | 0.0 | 0.0 | ||||||||||||
| Departure from Normal | 0.0 | 0.0 | -0.2 | -1.0 | -0.9 | -2.7 | -0.3 | -1.1 | -4.4 | -1.2 | 0.0 | 0.0 | 0.0 | ||||||||||||
| Kearney (Regional Airport) - July 2014 - July 2015 (*All data from NWS coop observer with daily 24-hour obs taken around 7 AM. As a result, data may vary slightly from true "calendar day" averages) |
|||||||||||||||||||||||||
| July 2014 | Aug. | Sep. | Oct. | Nov. | Dec. | Jan. | Feb. | Mar. | Apr. | May | June | July | |||||||||||||
| Average High (F)* | 84.4 | 85.1 | 74.5 | 68.3 | 47.5 | 37.0 | 40.5 | 38.6 | 59.7 | 63.5 | 69.1 | 80.6 | 87.0 | ||||||||||||
| Average Low (F)* | 59.2 | 61.4 | 51.1 | 38.5 | 19.2 | 19.1 | 14.6 | 11.6 | 23.9 | 38.1 | 47.1 | 59.1 | 62.1 | ||||||||||||
| Average Temperature (F)* | 71.8 | 73.2 | 62.8 | 53.4 | 33.4 | 28.0 | 27.6 | 25.1 | 31.4 | 50.8 | 58.1 | 69.9 | 74.6 | ||||||||||||
| Departure from Normal (F)* | -2.9 | +0.6 | -0.7 | +2.5 | -3.6 | +2.1 | -3.0 | -3.0 | -6.3 | +2.1 | -1.4 | +0.1 | -0.1 | ||||||||||||
| Precipitation (inches) | 0.17 | 7.60 | 2.40 | 0.99 | 0.06 | 0.69 | 0.05 | 0.49 | 0.07 | 3.14 | 2.85 | 7.08 | 2.36 | ||||||||||||
| Departure from Normal | -3.11 | +4.52 | +0.33 | -1.05 | -0.96 | +0.12 | -0.44 | -0.06 | -1.72 | +0.91 | -1.33 | +3.15 | -0.92 | ||||||||||||
| Snowfall (inches) | 0.0 | 0.0 | 0.0 | 0.0 | 1.7 | 4.0 | 0.8 | 5.6 | 0.5 | Trace | 0.0 | 0.0 | 0.0 | ||||||||||||
| Departure from Normal | 0.0 | 0.0 | -0.2 | -0.7 | -1.4 | +0.5 | -3.6 | +0.5 | -4.1 | -1.8 | 0.0 | 0.0 | 0.0 | ||||||||||||
| Ord (Evelyn Sharp Field Airport) - July 2014 - July 2015 (*Winter precipitation data may include coop observer reports due to automated airport equipment under-measuring snowfall liquid equivalent) |
|||||||||||||||||||||||||
| July 2014 | Aug. | Sep. | Oct. | Nov. | Dec. | Jan. | Feb. | Mar. | Apr. | May | June | July | |||||||||||||
| Average High (F) | 82.9 | 83.8 | 75.2 | 66.8 | 45.6 | 35.9 | 39.5 | 37.5 | 60.7 | 64.3 | 67.8 | 81.9 | 88.0 | ||||||||||||
| Average Low (F) | 57.4 | 60.9 | 49.0 | 36.0 | 16.0 | 17.5 | 12.2 | 9.2 | 21.9 | 37.3 | 45.9 | 57.9 | 60.6 | ||||||||||||
| Average Temperature (F) | 70.1 | 72.4 | 62.1 | 51.4 | 30.8 | 26.7 | 25.8 | 23.4 | 41.3 | 50.8 | 56.9 | 69.9 | 74.3 | ||||||||||||
| Departure from Normal (F) | -4.3 | -0.6 | -1.5 | +1.8 | -5.5 | +1.8 | +1.2 | -4.4 | +3.6 | +2.0 | -2.4 | +0.7 | -0.1 | ||||||||||||
| Precipitation (inches)* | 2.07 | 5.27 | 1.68 | 1.14 | 0.06 | 1.56 | 0.17 | 0.57 | 0.03 | 2.71 | 2.98 | 3.27 | 2.68 | ||||||||||||
| Departure from Normal | -0.90 | +2.11 | -0.76 | -0.79 | -1.01 | +0.97 | -0.20 | +0.13 | -1.42 | +0.12 | -0.83 | -0.85 | -0.29 | ||||||||||||
| Snowfall (Coop Observer) | 0.0 | 0.0 | 0.0 | 0.0 | 4.0 | 10.8 | 1.5 | 8.3 | Trace | 1.0 | 0.0 | 0.0 | 0.0 | ||||||||||||
| Departure from Normal | 0.0 | 0.0 | 0.0 | -1.1 | -1.3 | +3.4 | -5.3 | +2.3 | -5.9 | -1.5 | 0.0 | 0.0 | 0.0 | ||||||||||||
| Smith Center, KS (Cooperative Observer) - July 2014 - July 2015 (*All data from NWS coop observer with daily 24-hour obs taken around 7 AM. As a result, data may vary slightly from true "calendar day" averages) |
||||||||||||||||||||||||||
| June 2014 | July | Aug. | Sep. | Oct. | Nov. | Dec. | Jan. | Feb. | Mar. | Apr. | May | June | July | |||||||||||||
| Average High (F)* | 85.4 | 89.9 | 91.3 | 80.2 | 71.8 | 51.3 | 40.5 | 43.5 | 40.9 | 61.8 | 68.0 | 71.6 | 86.2 | 90.6 | ||||||||||||
| Average Low (F)* | 61.7 | 61.9 | 63.3 | 52.1 | 42.2 | 20.7 | 21.3 | 14.5 | 13.7 | 28.6 | 40.4 | 48.7 | 61.2 | 64.7 | ||||||||||||
| Average Temperature (F)* | 73.6 | 75.9 | 77.3 | 66.1 | 57.0 | 36.0 | 30.9 | 29.0 | 27.3 | 45.2 | 54.2 | 60.2 | 73.7 | 77.7 | ||||||||||||
| Departure from Normal (F)* | -0.4 | -3.8 | +0.1 | -2.1 | +2.2 | -4.4 | +2.1 | -1.3 | -4.7 | +3.6 | +1.7 | -3.5 | -0.3 | -2.0 | ||||||||||||
| Precipitation (inches) | 8.59 | 2.72 | 6.42 | 1.11 | 0.54 | 0.08 | 0.54 | 0.42 | 0.58 | 0.57 | 0.89 | 6.34 | 2.68 | 4.80 | ||||||||||||
| Departure from Normal | +4.98 | -1.15 | +3.12 | -0.93 | -1.34 | -1.14 | -0.12 | -0.07 | 0.0 | -1.30 | -1.38 | +2.42 | -0.93 | +0.93 | ||||||||||||
| Snowfall (inches) | 0.0 | 0.0 | 0.0 | 0.0 | 0.0 | 1.3 | 2.7 | 2.2 | 1.7 | 2.5 | 0.0 | 0.0 | 0.0 | 0.0 | ||||||||||||
| Departure from Normal | 0.0 | 0.0 | 0.0 | -0.2 | -0.4 | -0.5 | -0.5 | -1.5 | -2.4 | -0.1 | -0.6 | 0.0 | 0.0 | 0.0 | ||||||||||||
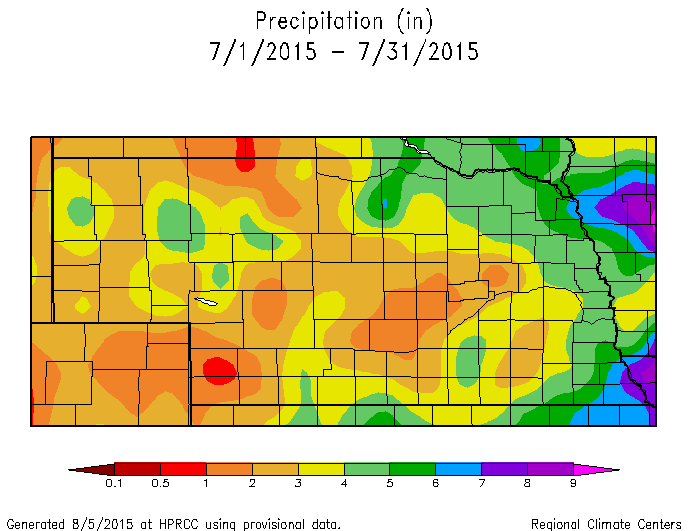
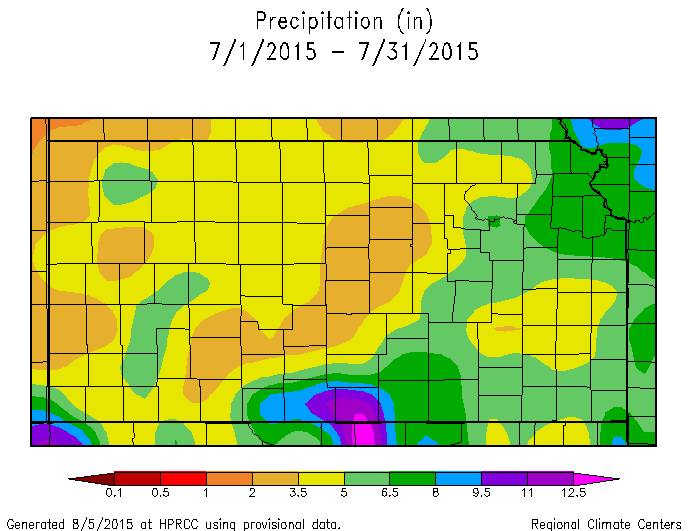
Most of the following images depicting July 2015 Precipitation and Temperatures are courtesy of the High Plains Regional Climate Center:
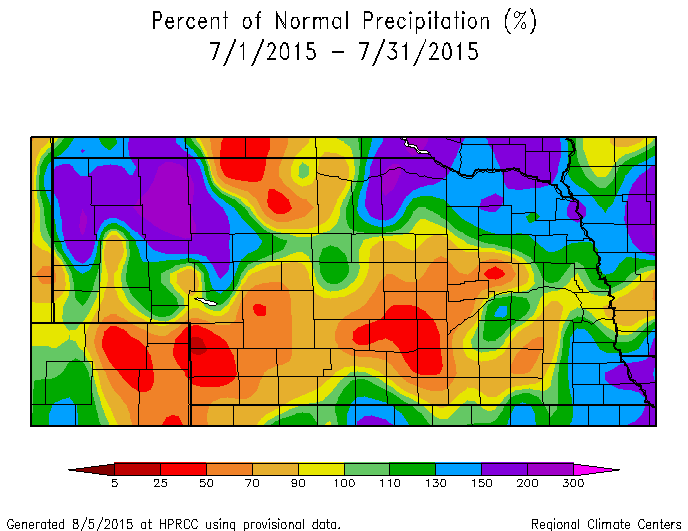
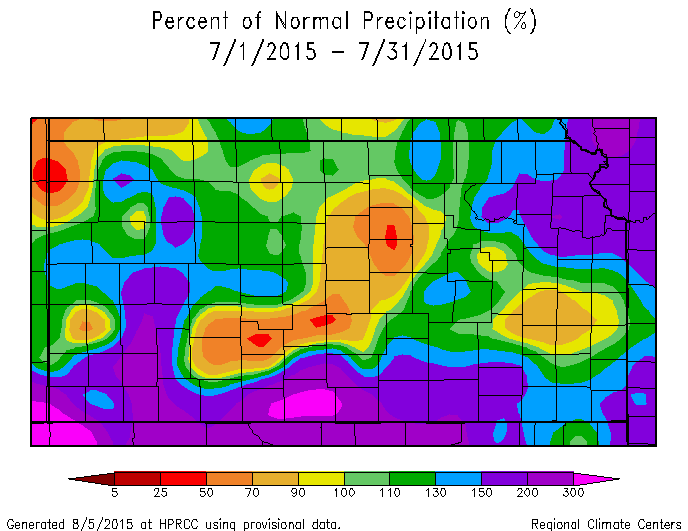
* Please note: These maps are a "best-approximation" of actual measured values, and data reflected on these maps may not exactly match actual values due to the effects of interpolation and "smoothing" used to create the maps. In addition, some "bullseyes" may be a result of missing data.
Click Images For Larger Version
| Nebraska: July 2015 Measured Precipitation (Inches) |
Kansas: July 2015 Measured Precipitation (Inches) |
 |
 |
| Nebraska: July 2015 Percent of Normal Measured Precip. |
Kansas: July 2015 Percent of Normal Measured Precip. |
 |
 |
| NWS Hastings Area: July 2015 Total "Observed" Precipitation Based On AHPS Precipitation Analysis Including Radar Data |
|
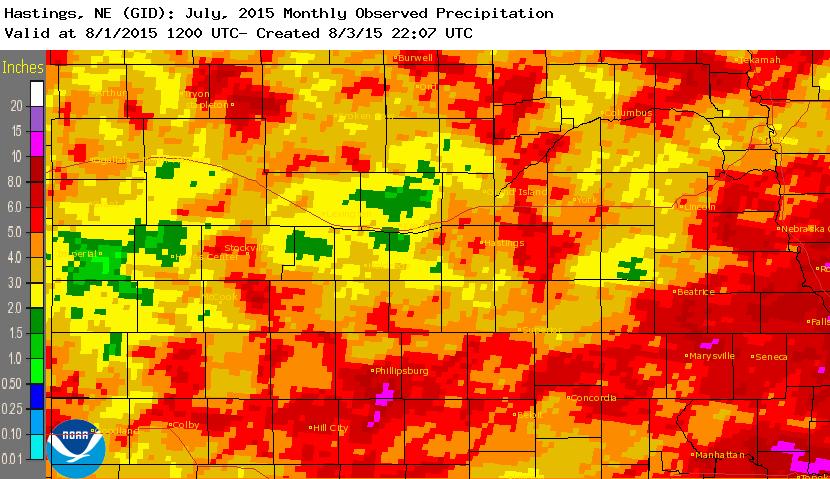 |
While the precipitation images above are based strictly on gauge-measured data, this image on the left utilizes an "Observed" multisensor approach created by River Forecast Centers. Hourly precipitation estimates from WSR-88D NEXRAD radar are compared to ground rainfall gauge reports, and a bias (correction factor) is calculated and applied to the radar field. For much more information on these types of images, and to create your own precipitation maps, please visit the following site: https://water.weather.gov/precip/ |
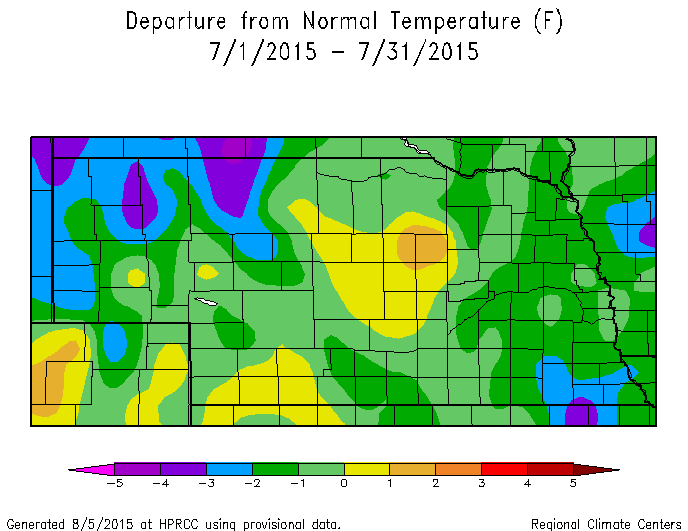
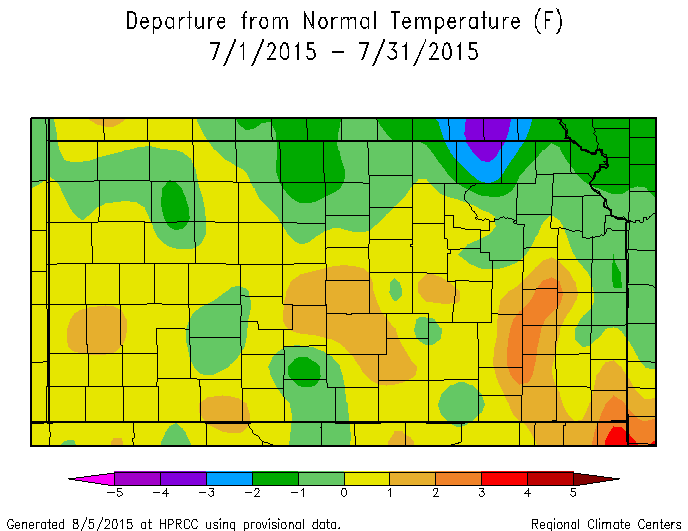
| Nebraska: July 2015 Temperature Departure from Normal (F) |
Kansas: July 2015 Temperature Departure from Normal (F) |
 |
 |
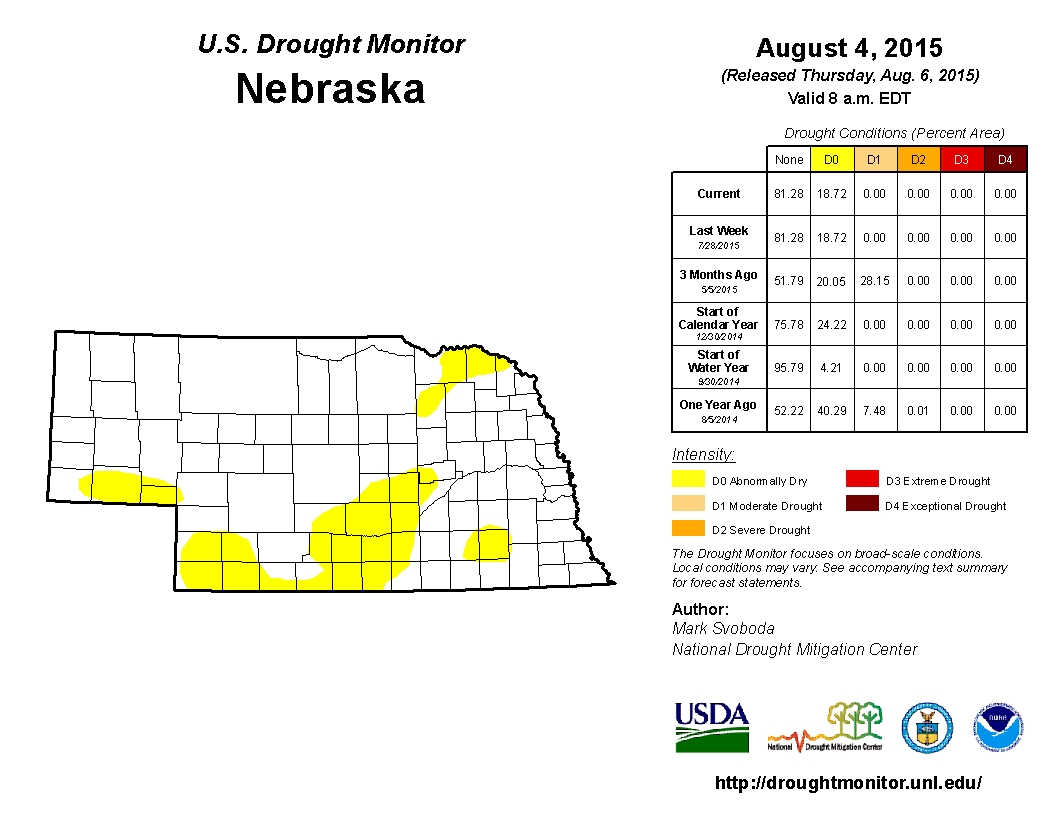
The following drought category images, current as of August 4, 2015, are courtesy of the
U.S. Drought Monitor (see narrative above for more details):
Click Images For Larger Version
 |
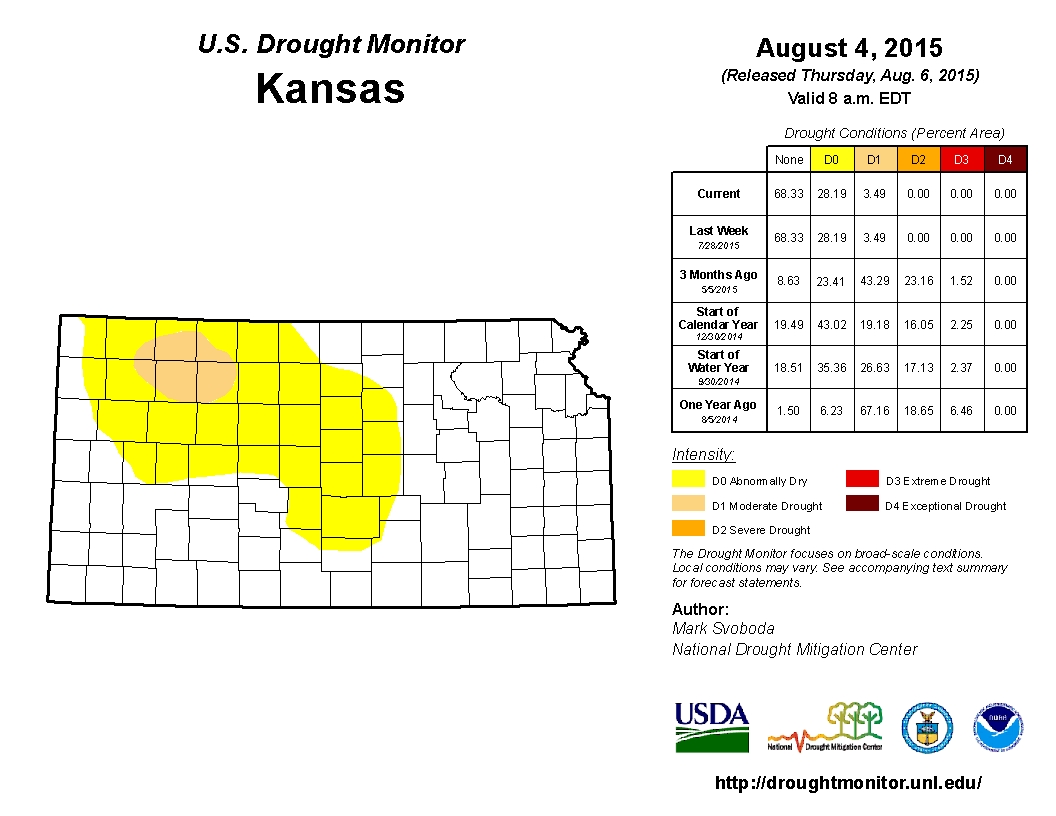 |
| Nebraska - U.S. Drought Monitor as of August 4, 2015 | Kansas - U.S. Drought Monitor as of August 4, 2015 |
For more climate related information, check out the following websites:
 |
This page was composed by the staff at the National Weather Service in Hastings, Nebraska. |
 |


 Follow us on YouTube