|
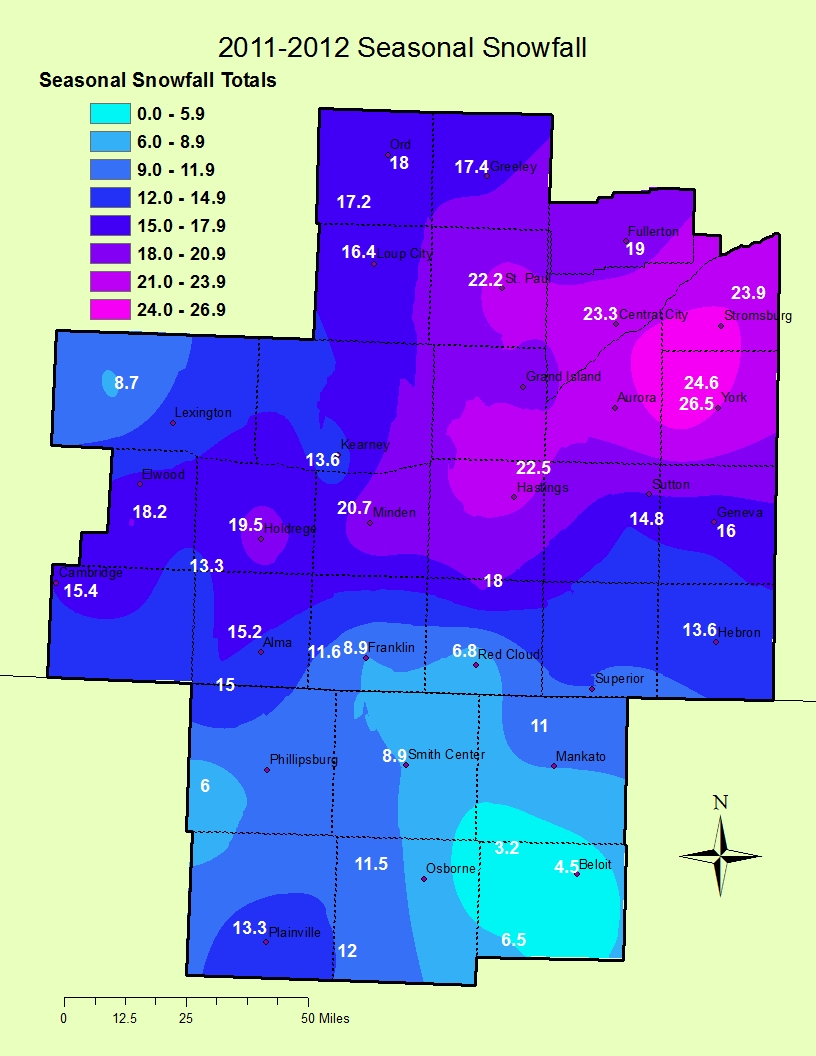
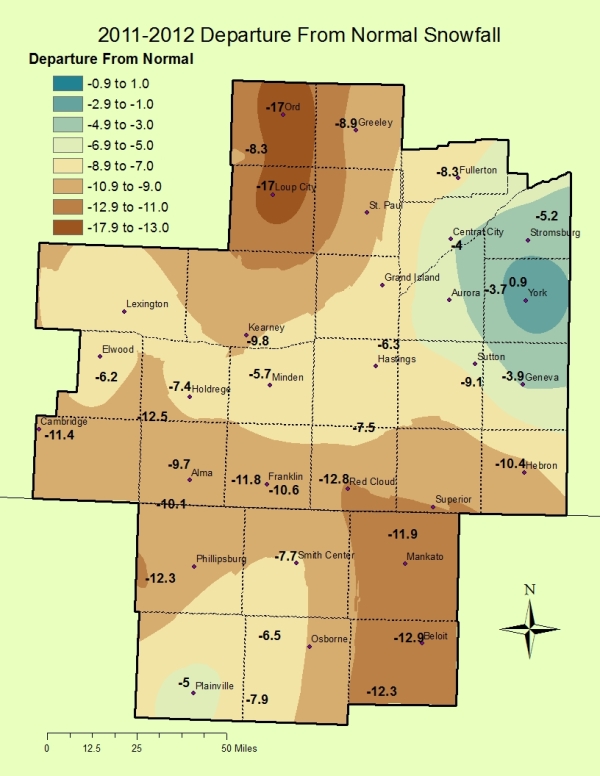
Now that a notably hot stretch of early-summer weather has settled into South Central Nebraska and North Central Kansas, it's time to "chill out" and take a look back at the 2011-2012 snowfall season, which officially comes to an end on June 30th (for climatological purposes, the annual snowfall season runs from July 1st through June 30th of the following year)... |
Click on images for larger version.
 |
 |
|
2011-12 Seasonal Snowfall |
2011-12 Departure from Normal Snowfall |
WINTER 2011-2012 SOUTH CENTRAL NEBRASKA
COOPERATIVE OBSERVER SNOWFALL
* The highest reported amount under each month indicated in blue BOLD, lowest amount in red BOLD
|
Station
|
Sep
|
Oct
|
Nov
|
Dec
|
Jan
|
Feb
|
Mar
|
Apr
|
May
|
Season
|
|
Arcadia
|
0.0
|
0.0 | 0.0 | 7.7 | 0.5 | 9.0 | 0.0 | 0.0 | 0.0 |
17.2
|
|
Beaver City
|
0.0
|
0.0 | 3.0 | 7.5 | 0.5 | 7.0 | 0.0 | 0.0 | 0.0 |
18.0
|
|
Belgrade
|
0.0
|
0.0 | 0.0 | 7.7 | 1.5 | 8.0 | 0.0 | 0.0 | 0.0 |
17.2
|
|
Blue Hill 4SW
|
0.0
|
0.0 | Trace | 5.5 | 1.1 | 11.4 | 0.0 | 0.0 | 0.0 |
18.0
|
|
Bradshaw
|
0.0
|
0.0 | 0.0 | 9.5 | 1.5 | 15.5 | 0.0 | 0.0 | 0.0 |
26.5
|
|
Bruning
|
0.0
|
0.0 | 0.0 | 2.5 | 4.0 | 12.2 | 0.0 | 0.0 | 0.0 |
18.7
|
|
Cambridge
|
0.0
|
0.0 | 2.7 | 10.0 | 1.5 | 1.2 | 0.0 | 0.0 | 0.0 |
15.4
|
|
Lexington 6SSE (Canaday)
|
0.0
|
0.0 |
0.0
|
10.5 | 0.5 | 6.5 | 0.0 | 0.0 | 0.0 |
17.5
|
|
Central City
|
0.0
|
0.0 |
0.1
|
9.3 | 2.3 | 11.6 | 0.0 | 0.0 | 0.0 |
23.3
|
|
Clay Center 6ESE
|
0.0
|
0.0 |
Trace
|
5.8 | 2.0 | 7.0 | 0.0 | 0.0 | 0.0 |
14.8
|
|
Clay Center
|
0.0
|
0.0 |
0.0
|
5.5 | 2.0 | 9.0 | 0.0 | 0.0 | 0.0 |
16.5
|
|
Cozad
|
0.0
|
0.0 |
Trace
|
6.7 | Trace | 2.0 | 0.0 | 0.0 | 0.0 |
8.7
|
|
Dannebrog 4NW
|
0.0
|
0.0 |
Trace
|
11.0 | 3.0 | 9.0 | 0.0 | 0.0 | 0.0 |
23.0
|
|
Edison
|
0.0
|
0.0 |
1.0
|
5.0 | 1.0 | 4.0 | 0.0 | 0.0 | 0.0 |
11.0
|
|
Elwood 8S
|
0.0
|
0.0 |
0.5
|
10.5 | 2.2 | 5.0 | 0.0 | 0.0 | 0.0 |
18.2
|
|
Fairmont
|
0.0
|
0.0 |
0.0
|
5.5 | MSG | MSG | MSG | MSG | MSG |
MSG
|
|
Franklin
|
0.0
|
0.0 |
Trace
|
3.9 | Trace | 5.0 | 0.0 | 0.0 | 0.0 |
8.9
|
|
Fullerton
|
0.0
|
0.0 |
0.0
|
8.0 | 1.0 | 10.0 | 0.0 | 0.0 | 0.0 |
19.0
|
|
Geneva
|
0.0
|
0.0 |
0.0
|
4.0 | 2.0 | 10.0 | 0.0 | 0.0 | 0.0 |
16.0
|
|
Genoa 2W
|
0.0
|
0.0 |
0.0
|
8.6 | 1.4 | 11.7 | 0.0 | 0.0 | 0.0 |
21.7
|
|
Gothenburg
|
0.0
|
0.0 |
0.0
|
MSG | MSG | MSG | 0.0 | 0.0 | 0.0 |
MSG
|
|
Grand Island
|
0.0 | 0.0 | Trace | 8.3 | 1.6 | 10.2 | Trace | 0.0 | 0.0 |
20.1
|
|
Greeley
|
0.0
|
0.0 |
0.0
|
8.0 | 2.0 | 7.4 | Trace | 0.0 | 0.0 |
17.4
|
|
Gresham 3W
|
0.0
|
0.0 |
0.0
|
9.0 | 1.2 | 10.0 | 0.0 | 0.0 | 0.0 |
20.2
|
|
Harlan Lake
|
0.0
|
0.0 |
MSG
|
4.0 | Trace | 4.5 | 0.0 | 0.0 | 0.0 |
MSG
|
|
Hastings NWS
|
0.0
|
0.0 |
Trace
|
9.4 | 1.7 | 11.4 | 0.0 | 0.0 | 0.0 |
22.5
|
|
Hebron
|
0.0
|
0.0 |
0.4
|
2.5 | 4.3 | 6.4 | 0.0 | 0.0 | 0.0 |
13.6
|
|
Holdrege
|
0.0
|
0.0 |
Trace
|
6.5 | 1.0 | 12.0 | 0.0 | 0.0 | 0.0 |
19.5
|
|
Hubbell
|
0.0
|
0.0 |
Trace
|
Trace | 4.0 | 4.0 | 0.0 | 0.0 | 0.0 |
8.0
|
|
Kearney Airport
|
0.0
|
0.0 |
Trace
|
6.6 | Trace | 7.0 | 0.0 | 0.0 | 0.0 |
13.6
|
|
Loup City
|
0.0
|
0.0 |
Trace
|
7.4 | 0.5 | 8.5 | 0.0 | 0.0 | 0.0 |
16.4
|
|
Miller
|
0.0
|
0.0 |
0.0
|
9.0 | 1.0 | 5.4 | 0.0 | 0.0 | 0.0 |
15.4
|
|
Minden
|
0.0
|
0.0 |
0.0
|
7.9 | Trace | 12.8 | 0.0 | 0.0 | 0.0 |
20.7
|
|
Naponee
|
0.0
|
0.0 |
0.5
|
3.9 | Trace | 5.0 | 0.0 | 0.0 | 0.0 |
9.4
|
|
Nelson
|
0.0
|
0.0 |
Trace
|
2.4 | 2.1 | 7.1 | 0.0 | 0.0 | 0.0 |
11.6
|
|
Ord
|
0.0
|
0.0 |
Trace
|
8.5 | 1.5 | 8.0 | 0.0 | 0.0 | 0.0 |
18.0
|
|
Orleans 2W
|
0.0
|
0.0 |
3.0
|
7.0 | 1.2 | 4.0 | 0.0 | 0.0 | 0.0 |
15.2
|
|
Osceola
|
0.0
|
0.0 |
0.0
|
9.1 | 2.0 | 12.8 | 0.0 | 0.0 | 0.0 |
23.9
|
|
Oxford 6NNW
|
0.0
|
0.0 |
1.1
|
5.2 | 1.4 | 5.6 | 0.0 | 0.0 | 0.0 |
13.3
|
|
Polk
|
0.0
|
0.0 |
Trace
|
8.0 | 2.0 | 13.0 | 0.0 | 0.0 | 0.0 |
23.0
|
|
Ravenna
|
0.0
|
0.0 |
0.0
|
9.9 | Trace | 11.0 | 0.0 | 0.0 | 0.0 |
20.9
|
|
Red Cloud
|
0.0
|
0.0 |
0.0
|
2.8 | 1.5 | 2.5 | 0.0 | 0.0 | 0.0 |
6.8
|
|
St. Paul
|
0.0 | 0.0 | 0.0 | 9.2 | 2.0 | 11.0 | 0.0 | 0.0 | 0.0 | 22.2 |
|
Shelby 3NE
|
0.0
|
0.0 |
Trace
|
10.5 | 2.4 | 11.8 | 0.0 | 0.0 | 0.0 |
24.7
|
|
Shickley 4S
|
0.0
|
0.0 |
Trace
|
4.2 | 1.0 | 9.5 | 0.0 | 0.0 | 0.0 |
14.7
|
|
Superior 4E
|
0.0
|
0.0 |
Trace
|
3.1 | MSG | MSG | MSG | 0.0 | 0.0 |
MSG
|
|
Upland 2NE
|
0.0
|
0.0 |
0.0
|
5.0 | 0.0 | 10.0 | 0.0 | 0.0 | 0.0 |
15.0
|
|
Wilsonville
|
0.0
|
0.0 |
1.0
|
8.0 | 1.0 | 7.0 | 0.0 | 0.0 | 0.0 |
17.0
|
|
Wolbach
|
0.0
|
0.0 |
0.0
|
8.3 | 2.4 | 8.4 | 0.0 | 0.0 | 0.0 |
19.1
|
|
York 3N
|
0.0
|
0.0 |
0.0
|
9.2 | 2.0 | 13.4 | Trace | 0.0 | 0.0 | 24.6 |
WINTER 2011-2012 NORTH CENTRAL KANSAS
COOPERATIVE OBSERVER SNOWFALL
* The highest reported amount for the month indicated in blue BOLD, lowest amount in red BOLD
|
Station
|
Sep
|
Oct
|
Nov
|
Dec
|
Jan
|
Feb
|
Mar
|
Apr
|
May
|
Season
|
|
Alton 2SW
|
0.0
|
0.0 | 1.5 | 7.0 | Trace | 3.0 | 0.0 | 0.0 | 0.0 |
11.5
|
|
Beloit
|
0.0
|
0.0 | 1.0 | 2.0 | 1.0 | 0.5 | 0.0 | 0.0 | 0.0 |
4.0
|
|
Burr Oak 1N
|
0.0
|
0.0 | 0.5 | 5.2 | 1.6 | 3.7 | 0.0 | 0.0 | 0.0 |
11.0
|
|
Cawker City
|
0.0
|
0.0 | 1.0 | 1.5 | 0.2 | 0.5 | 0.0 | 0.0 | 0.0 |
3.2
|
|
Covert Rural
|
0.0
|
0.0 | 0.0 | 9.0 | Trace | 2.5 | 0.0 | 0.0 | 0.0 |
11.5
|
|
Damar
|
0.0
|
0.0 | Trace | 4.0 | Trace | 4.0 | 0.0 | 0.0 | 0.0 |
8.0
|
|
Glen Elder Dam
|
0.0
|
0.0 | 0.0 | 0.5 | 0.5 | MSG | 0.0 | 0.0 | 0.0 |
MSG
|
|
Hunter
|
0.0
|
0.0 |
Trace
|
6.0 | 0.5 | Trace | 0.0 | 0.0 | 0.0 |
6.5
|
|
Ionia
|
0.0
|
0.0 |
0.5
|
4.0 | 0.4 | 0.9 | 0.0 | 0.0 | 0.0 |
5.8
|
|
Jewell
|
0.0
|
0.0 |
0.3
|
4.2 | 3.3 | 3.8 | 0.0 | 0.0 | 0.0 |
11.6
|
|
Kirwin Dam
|
0.0
|
0.0 |
0.0
|
3.0 | MSG | MSG | 0.0 | 0.0 | 0.0 |
MSG
|
|
Lebanon
|
0.0
|
0.0 |
1.0
|
4.6 | 0.5 | 4.0 | 0.0 | 0.0 | 0.0 |
10.1
|
|
Logan
|
0.0
|
0.0 |
0.5
|
3.0 | Trace | 2.5 | 0.0 | 0.0 | 0.0 |
6.0
|
|
Long Island 1 N
|
0.0
|
0.0 |
Trace
|
6.0 | 0.0 | 9.0 | 0.0 | 0.0 | 0.0 |
15.0
|
|
Mankato
|
0.0
|
0.0 |
Trace
|
4.5 | 3.5 | 3.0 | 0.0 | 0.0 | 0.0 |
11.0
|
|
Natoma
|
0.0
|
0.0 |
1.0
|
9.0 | Trace | 2.0 | 0.0 | 0.0 | 0.0 |
12.0
|
|
Palco
|
0.0
|
0.0 |
2.0
|
9.0 | 0.0 | 4.5 | 0.0 | 0.0 | 0.0 |
15.5
|
|
Plainville 4 WNW
|
0.0
|
0.0 |
1.0
|
6.8 | 0.3 | 5.2 | 0.0 | 0.0 | 0.0 |
13.3
|
|
Smith Center
|
0.0
|
0.0 |
0.6
|
3.7 | Trace | 4.6 | 0.0 | 0.0 | 0.0 |
8.9
|
|
Webster Dam
|
0.0
|
0.0 |
Trace
|
4.5 | 0.0 | 4.1 | 0.0 | 0.0 | 0.0 |
8.6
|


 Follow us on YouTube