°(Click on the links in gray boxes below to quickly jump to information located farther down the page)
| Tri-Cities & Ord Details & Monthly Extremes |
Graphs, Tables, Maps | Drought Monitor Graphics |
Monthly Precipitation & Snowfall Tables & Archive of These Monthly Reviews |
* Please Note: All climate data presented here are preliminary and have not undergone final quality control by the National Climatic Data Center (NCDC). Therefore, these data are subject to revision. Final and certified climate data can be accessed at: WWW.NCDC.NOAA.GOV.
December 2014 Climate And Weather Review For South Central Nebraska
And Portions Of North Central Kansas
...Near-to-Slightly Above Normal Precipitation/Snowfall In Most Areas...Temperatures Rather Mild Through the First 25 Days Before Plunging Downward at Month's End...
The following narrative focuses on climate and weather highlights for the month of December 2014 across the NWS Hastings coverage area, encompassing 24 counties in south central and central Nebraska, and 6 counties in north central Kansas. Click here for a map of this coverage area. The temperature and precipitation data presented here are largely based on the NWS Cooperative Observer network, along with data from a handful of automated airport sites. All climate averages and "normals" presented here are based on the official NCDC 1981-2010 normals.
- TEMPERATURES...(According to 30-year averages, "normal" December high temperatures in South Central Nebraska gradually decrease from the lower-mid 40s early in the month to the mid-30s by the end of the month, while highs in North Central Kansas gradually decrease from the mid-40s to near-40. "Normal" December low temperatures across most of the 30-county area gradually decrease from the 17-23° range early in the month to between 12-16° by month's end....)
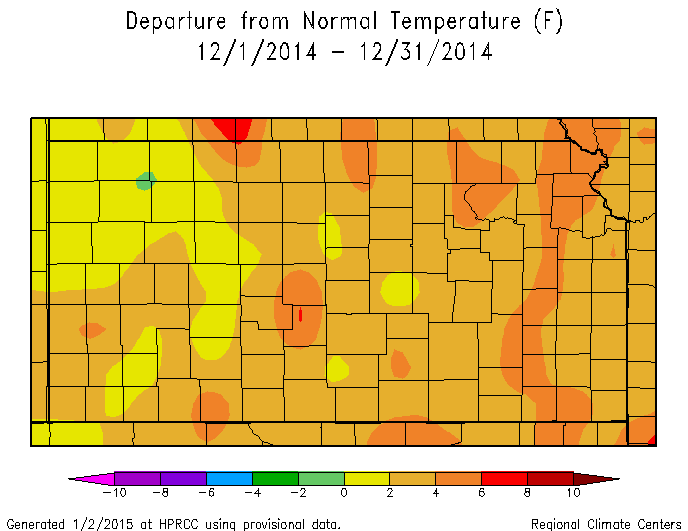
Based on the monthly average temperature (resulting from averaging together the daily highs and lows), temperatures for the month of December 2014 as a whole across the local 30-county area generally finished between 2-3° warmer than the 30-year normal, with some localized deviations slightly cooler or warmer than this. Although this slightly-warmer-than-normal departure for the month was not all that significant, it does not paint the full picture of a December that was well on its way to being one of the Top-15 warmest on record through the first 25 days, before a significant cool-down during the final six days brought the overall monthly average back "down to earth." In fact, prior to this late-month cold snap, much of the area was averaging around 6° above normal for the month. At Hastings airport, where temperature trends were generally representative of much of the 30-county area as a whole, 20 of 31 December days featured an above normal average temperature, 10 were below normal (including each of the last five) and one day matched its normal value. Following below are several temperature highlights/details for the month of December 2014:
The overall-biggest temperature story during December was probably the overall-mild pattern that dominated the area through the first 25 days. Through these first 25 days, Hastings airport saw highs of at least 40° on 15 days and highs in the 50s on six days. Farther south at the cooperative observer site 4WNW Plainville KS, 17 of these first 25 days reached at least 40°, eight days topped out in the 50s and two days even tagged the 60s. Even in the far northern part of the local area at Ord airport, 12 December days reached at least 40° and six days were in the 50s. For most of the area, the overall warmest week was centered between the 8th-14th. During this week, Hastings airport reached at least 51° on four days and the cooperative observer site 2SW Alton KS reached at least 55° on four days.
Three days in particular, the 12th-14th, featured notably mild low temperatures, as a cloudy and unusually moist airmass for mid-December kept readings from dropping below the mid-30s to mid-40s range. The mildest, record-breaking lows of all occurred on the 13th, as nearly the entire area dropped no lower than the 46-48° range. In fact, Grand Island's low of 47° set a new record warm minimum temperature for ANY DAY IN DECEMBER, breaking the previous mark of 46° established back on Dec. 3-4, 1913, and Dec. 1, 1998! At Hastings, the low of 47° tied the existing December record.
By far the coldest stretch of the month across the entire area was the final six days from the 26th-31st, and especially the 30th-31st as Arctic air arrived with a vengeance. On the 30th, the majority of the area only topped out between 3-10°, marking the coldest daytime high temperatures of 2014 for many sites including Grand Island, Hastings and Ord. That night and into the early morning of the 31st, low temperatures plunged into the -4 to -12° range across most of the area.
Per dozens of NWS cooperative observers and a few automated airport sites, most of the 30-county area observed its mildest readings of the month on the 2nd, 5th or 14th. A few of these warmest monthly highs featured: 65° at 4WNW Plainville KS on the 5th, 64° at Beaver City on the 2nd and the 5th, and 63° at Cambridge (on the 2nd) and at Webster Dam KS (on the 5th). (please refer to the extremes section below for a longer list of warmest/coldest temperatures)
Per dozens of NWS cooperative observers and a few automated airport sites, the coldest low temperatures of the month across the entire 30-county area occurred on the 31st, highlighted by frigid values of: -14° at Ord airport and Gothenburg, -12° at Lexington airport and Cambridge, and -11° at Greeley and Ravenna. In the North Central Kansas portion of the area, the coldest reading reported that morning was -8° at 2SW Alton. (please refer to the extremes section below for a longer list of warmest/coldest temperatures)
Among the official Nebraska Tri-Cities airport temperature stations, the warmest December high temperature at each site occurred on the 14th, featuring 58° at Grand Island and Kearney, and 57° at Hastings. The coldest Tri-Cities low temperatures all occurred on the 31st, consisting of -8° at Grand Island and Kearney, and -5° at Hastings. (please refer to the story link farther down the page for much more Tri-Cities detail)
The most extreme day-to-day change in November high temperatures at Grand Island airport was 27°, consisting of a noticeable warm up from 25° on the 1st to 52° on the 2nd.
(Please look farther down the page for more information on December 2014 temperatures and extremes, including detailed breakdowns for Grand Island, Hastings, Kearney and Ord.)
- PRECIPITATION/SNOWFALL/FLOODING...(According to 30-year averages, "normal" December precipitation across most of the NWS Hastings coverage area (rainfall and snow liquid equivalent) ranges somewhere between 0.55" and 1.00", with the highest amounts favoring eastern areas closest to the Highway 81 corridor such as York, Hebron and Beloit. December snowfall normals range from range from 5-7" across most of South Central Nebraska, and 3-5" in North Central Kansas...)
Fortunately for possible drought concerns in the wake of a very dry November, precipitation during Dec. 2014 averaged near-to-slightly above the 30-year normal across the majority of the 30-county NWS Hastings coverage area, and well-above normal in some northern/western counties. The vast majority of December precipitation fell on or after the 14th, as the first few weeks continued the very dry trend from November. Snowfall-wise, although there were no "major" snow storms during the month, a series of fairly minor events during the latter half of the month pushed most places into near-to-slightly above normal territory in that department as well (see the snowfall summary below for more details) .
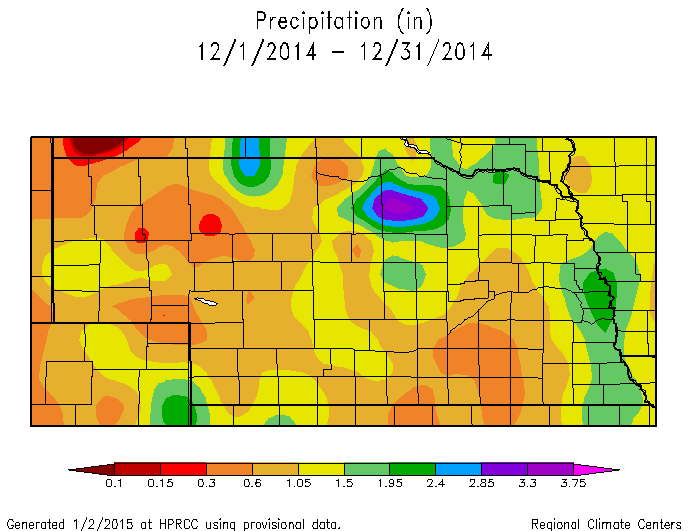
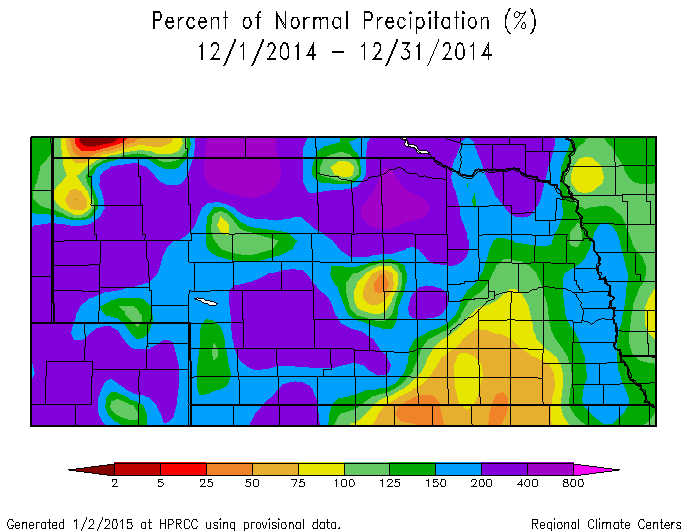
Based on reports from around 65 NWS Cooperative Observers and a few automated airport gauges, and also incorporating radar-derived estimation, the majority of the area received somewhere between 0.50-1.00" of liquid equivalent precipitation for the month, or generally between 70-140% of normal. Although no areas were "bone dry", there was a somewhat evident difference between many northern/western counties (wetter) and the majority of southern/eastern counties (drier). In fact, the majority of far northern and western counties such as Valley/Greeley/Nance/Sherman/Howard/Dawson/Furnas received 1.00-1.50" of precipitation for the month, which in some places exceeded twice the December normal. Per cooperative observers, the Ord total of 1.55" was a significant 238% of normal and marked the 4th-wettest December since 1977. For sites with longer periods of record, Cambridge (1.33") measured its 6th-wettest December out of 106 years and Holdrege (1.52") had its 9th-wettest December out of 121 years.
Although a decent percentage of monthly liquid precipitation fell in the form of snow, many areas received over half of their monthly precipitation total in the form of widespread rain (and even a few rare December thunderstorms) on the 14th into the early morning hours of the 15th (before rain eventually changed over to snow). For example, Holdrege received 1.31" during the 48-hours between the morning of the 14th and the morning of the 16th, accounting for 86% of its monthly total. Along these same lines, Ord measured 1.25" on these days, accounting for 81% of the monthly total.
As for monthly precipitation extremes within the 30-county area, a few of the highest-known December totals per a combination of NWS cooperative observers and the NeRAIN network are as follows: 2.00" three miles west of Sumner (NeRAIN), 1.88" seven miles south-southeast of Ord (NeRAIN), 1.66" thirteen miles southeast of Litchfield (NeRAIN), 1.62" five miles southwest of Arapahoe (NeRAIN) and 1.56" at Ord airport (NWS). (please refer to the extremes section below for a longer list of highest/lowest precipitation amounts)
On the noticeably drier, below-normal side of things during December, a few of the lowest monthly precipitation totals per NWS cooperative observers featured: 0.31" at Lebanon KS and Hebron, 0.37" at Natoma KS and Red Cloud, 0.44" at Kirwin Dam KS and 0.45" at Beloit KS. (please refer to the extremes section below for a longer list of highest/lowest precipitation amounts)
Among the official Nebraska Tri-Cities airport precipitation sites, Grand Island led the way with 0.76”, followed by Kearney (0.69”) and Hastings (0.54”). Snowfall in the Tri-Cities followed suit, as Grand Island tallied 5.9", followed by 4.0" at Kearney and 3.4" at Hastings. (please refer to the story link farther down the page for much more Tri-Cities details)
Snowfall: Although there were no "major" snow events during the month with widespread accumulations of 6+ inches, the latter half of the month featured several "fairly minor" events with accumulations primarily in the 1-3" range with some locally higher exceptions. For the month as a whole, the majority of the 30-county area measured near-normal snowfall between 3-6", but ranging from as low as around 1" in a few places to as much as 8-11" within a few counties in far northern and western portions of South Central Nebraska. Per NWS cooperative observers, a few of the highest monthly snowfall totals featured 10.8" at Ord and St. Paul, 8.9" at Greeley and 8.5" at Wilsonville (please refer to the extremes section below for a longer list of highest monthly snowfall amounts).
Focusing on individual snow events, there were primarily four during the month:
• Dec. 15: Starting during the pre-dawn hours and continuing into the day, rain steadily changed to snow within the area from west-to-east. By far the main snow accumulation zone affected counties in South Central Nebraska west of the Highway 281 corridor, where totals of 1-4" were common, including 1.5" at Holdrege, 2" at Wilsonville and 4" at Ord.
• Dec. 17-18: During the late evening of the 17th into the pre-dawn hours of the 18th, mainly far southeastern portions of the local area received generally 2-3" of snow, which primarily targeted Jewell and Mitchell counties in Kansas along with southern portions of Thayer and Nuckolls counties in Nebraska. A few official totals included 2.6" at 4E Superior, 2.5" at Beloit and 2.4" at Burr Oak.
• Dec. 26-27: During the afternoon and evening hours, a widespread area of generally light-to-moderate snow overspread the area from west-to-east. While nearly the entire 30-county area received at least a light dusting, the primary zone of 2-4" amounts focused northwest of a line from Cambridge-Hastings-Osceola, highlighted by totals of 4" at St. Paul and 3.5" at Grand Island and Ord. Even in eastern/southern counties that did not receive as much snow, a period of freezing drizzle that preceded the snow resulted in very slick roads and several car accidents during the evening.
• Dec. 29-30: Mainly between the early morning hours of the 29th into the early morning of the 30th, a few separate rounds of snow resulted in a fairly broad coverage of at least 1-2" across much of the local 30-county area, with several counties mainly north of Interstate 80 in Nebraska and also generally southwest of a line from Elwood Nebraska-Osborne Kansas receiving a greater coverage of 2-3" with locally higher amounts. A few of the highest NWS cooperative observer totals featured 4.1" at Wilsonville, 3.8" at St. Paul, and 3" at 3N York and Phillipsburg KS.
Flooding: NWS Hastings did not detect, nor receive any reports of "significant" flooding from within the 30-county local area during December 2014.
Now that 2014 is in the books, here is a brief recap of annual precipitation within the NWS Hastings coverage area:
- South Central Nebraska (24 counties): Probably the best way to describe precipitation during 2014 in this 24-county South Central Nebraska area was "reasonably normal but highly variable". Hardly any locations stood out as being "extremely dry" or "extremely wet", and in fact the majority of the area measured totals within 3-4" either side of the 30-year average/normal annual amount, meaning somewhere between 22-30". Put another way, most places tallied somewhere between 80-120% of normal annual precipitation. Geographically though, there was noticeable variability over short distances (even within the same county), and thus there were no distinct larger portions of the area that truly stood out as being notably above or below normal. That being said, one could argue that the most concentrated zone of slightly above normal precipitation focused along a fairly narrow, diagonal axis running from Furnas and Harlan counties in the southwest, then northeastward through the Grand Island /Hastings area and then into northeastern counties such as Polk and York. Also, despite exceptions, one could also make a case that some of the overall-driest counties within the local area during 2014 (versus their long-term normals) were Thayer (especially eastern), Webster, Valley and Greeley. As for extremes, the driest NWS cooperative observer site within the 24-county area during 2014 was Cozad with only 20.98" (approx. 2.60" below normal), while the wettest site was York 3N with 38.97" (8.74" above normal).
- North Central Kansas (6 counties): Although this 6-county area was not NEARLY as dry during 2014 as it was a few years during the notable drought of 2012, the majority of the area tended to fall at least a few inches short of the 30-year average/normal annual precipitation. That being said, there was also quite a bit of localized variability, even within the same county. Overall though, the majority of locations measured somewhere between 21-26", or generally between 80-100% of normal annual precipitation. As for extremes, the driest NWS cooperative observer site within the area during 2014 was Phillipsburg with only 18.24" (7.18" below normal), while the wettest site was Mankato with 31.20" (3.21" above normal).
(Please look farther down the page for more information on December 2014 precipitation/snowfall and extremes, including rankings of wettest and driest locations, percent-of-normal plots, and a detailed breakdown for Grand Island, Hastings, Kearney and Ord. In addition, the link on the far upper right of this page contains an archive of monthly/annual precipitation and snowfall totals for around 70 locations.)
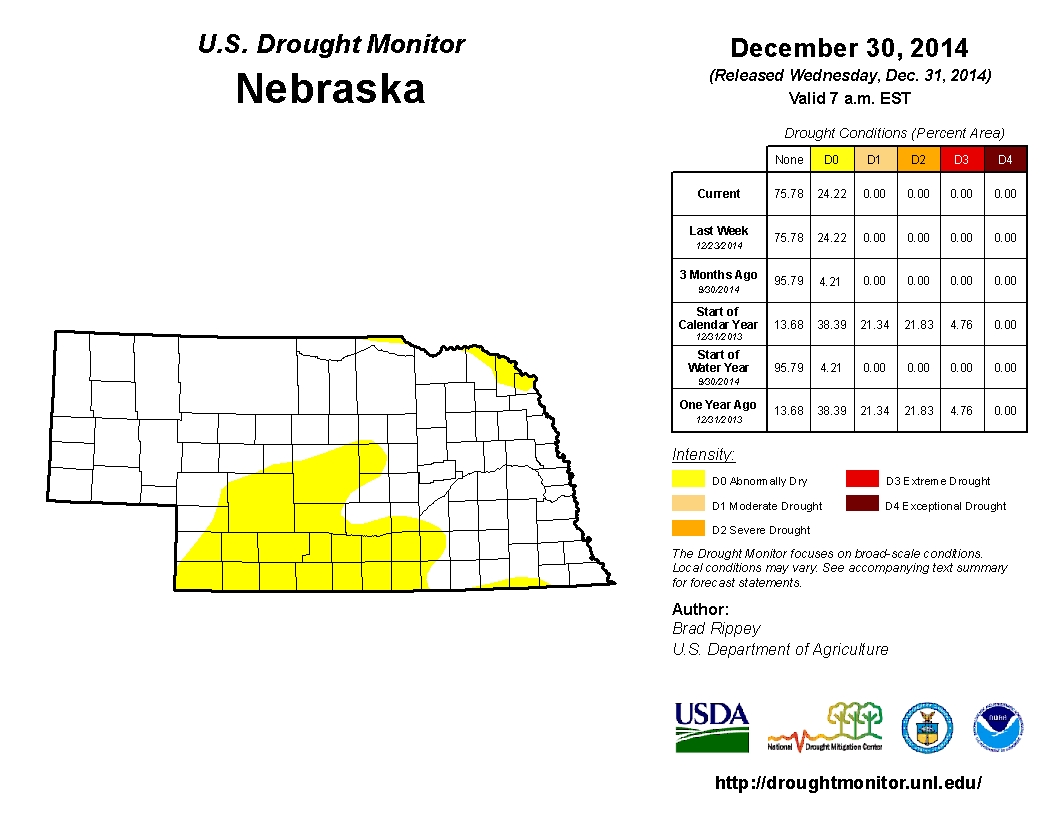
- DROUGHT STATUS (see images at bottom of page)...Given that December precipitation averaged near-to-above normal across most of the 30-county NWS Hastings coverage area , there was essentially no change whatsoever in drought classification over the course of the month, and most importantly no worsening of the situation in the wake of a very dry November. As a result, the weekly U.S. Drought Monitor as of Dec. 30th continued to indicate that roughly 65% of the local area remained in category D0 Abnormally Dry conditions (considered to be one category better than “true” drought). This included all of North Central Kansas, along with most (but not all) South Central Nebraska counties along and west of Highway 281. Meanwhile, most (but not all) counties east of the Highway 281 corridor in the Nebraska coverage area, along with a few other counties such as Greeley and Howard, still remained void of all drought classification whatsoever.
- SEVERE THUNDERSTORMS/HIGH WINDS (for all official/finalized storm reports please refer to NCDC Storm Data)...Although there were no severe thunderstorms within the local 30-county area during the month, many areas did observe at least a brief round of fairly rare, non-severe December thunderstorms on the afternoon and night of the 14th into the early morning of the 15th. A few of these storms reportedly even produced small hail. As for non-convective winds during the month, overall things were fairly quiet as only a few days featured peak gusts of 40+ MPH. For most of the area, the overall-windiest day of the month was the 15th as a low pressure system migrated from eastern KS into southern IA. This produced several hours of sustained northwest wind to around 30 MPH with higher gusts that slightly-exceeded 50 MPH in some spots. Peak gusts at a few automated airport sensors around the area on the 15th featured 51 MPH at Hastings, 50 MPH at Ord and 49 MPH at Grand Island.
- Number of Severe Thunderstorm Warning polygons issued by NWS Hastings in December 2014: 0 (Same as December 2013)
- Number of Tornado Warning polygons issued by NWS Hastings in December 2014: 0 (Same as December 2013)
- Number of confirmed tornadoes within the NWS Hastings coverage area in December 2014: 0 (same as December 2013)
Click on the link below for December 2014 climate summaries specifically for Grand Island, Hastings, Kearney and Ord
Grand Island - Hastings - Kearney - Ord
|
...A FEW OF THE WARMEST HIGH TEMPERATURES DURING DECEMBER 2014 |
Various graphs and tables depicting December 2014 climate data for
South Central Nebraska and North Central Kansas:
* Please Note: These data are preliminary and have not undergone final quality control by the National Climatic Data Center (NCDC). Therefore, these data are subject to revision. Final and certified climate data can be accessed at WWW.NCDC.NOAA.GOV
 |
 |
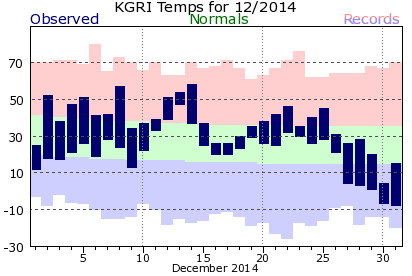
| Grand Island Temperature Summary: Observed daily maximum and minimum temperatures are connected by blue bars. Area between normal maximum and minimum temperatures is shaded green. Red bars connect record high temperatures. Blue bars connect record low temperatures. |
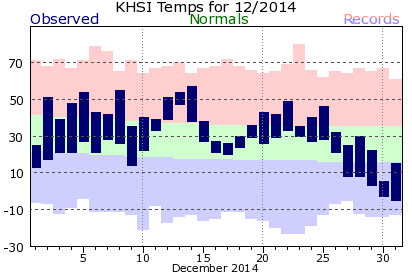
Hastings Temperature Summary: Observed daily maximum and minimum temperatures are connected by blue bars. Area between normal maximum and minimum temperatures is shaded green. Red bars connect record high temperatures. Blue bars connect record low temperatures. |
 |
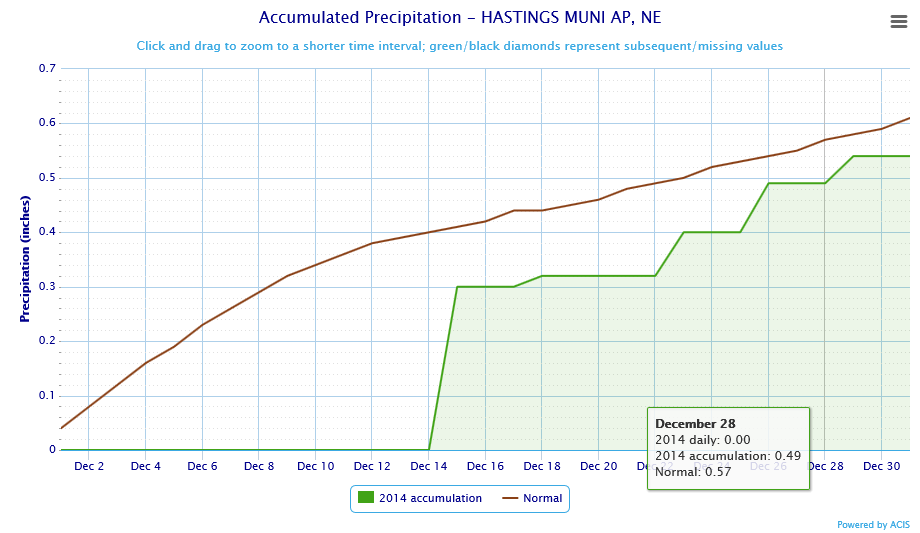 |
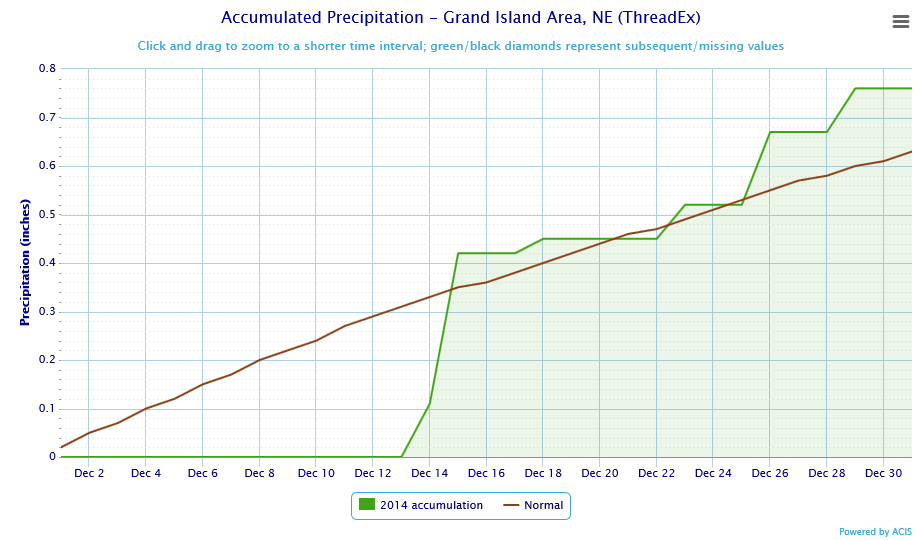
| Grand Island Precipitation Summary: Green line indicates cumulative observed precipitation for December 2014. Brown line indicates "normal" November precipitation based on 30-year data from 1981-2010. | Hastings Precipitation Summary: Green line indicates cumulative observed precipitation for December 2014. Brown line indicates "normal" November precipitation based on 30-year data from 1981-2010. |
| Grand Island (Regional Airport) - Dec. 2013 - Dec. 2014 | |||||||||||||||||||||||||
| Dec. 2013 | Jan. | Feb. | Mar. | Apr. | May | June | July | Aug. | Sep. | Oct. | Nov. | Dec. | |||||||||||||
| Average High (F) | 37.1 | 38.5 | 33.5 | 51.3 | 64.2 | 76.3 | 83.6 | 84.9 | 84.5 | 76.3 | 68.7 | 47.3 | 37.1 | ||||||||||||
| Average Low (F) | 12.6 | 12.7 | 13.4 | 23.3 | 39.0 | 49.6 | 61.8 | 61.9 | 63.8 | 52.9 | 41.1 | 21.0 | 21.1 | ||||||||||||
| Average Temperature (F) | 24.9 | 25.6 | 23.4 | 37.2 | 51.6 | 62.9 | 72.7 | 73.4 | 74.1 | 64.6 | 54.9 | 34.2 | 29.1 | ||||||||||||
| Departure from Normal (F) | -1.8 | +0.5 | -5.7 | -2.2 | +1.0 | +1.7 | +1.4 | -2.8 | +0.1 | -0.5 | +2.7 | -3.9 | +2.4 | ||||||||||||
| Precipitation (inches) | 0.11 | 0.32 | 0.33 | 0.19 | 2.91 | 0.74 | 9.65 | 2.19 | 5.87 | 3.03 | 1.28 | 0.29 | 0.76 | ||||||||||||
| Departure from Normal | -0.52 | -0.21 | -0.35 | -1.61 | +0.38 | -3.67 | +5.35 | -1.21 | +2.75 | +0.80 | -0.58 | -0.88 | +0.13 | ||||||||||||
| Snowfall (inches) | 2.2 | 4.5 | 6.6 | 1.2 | 1.7 | 0.0 | 0.0 | 0.0 | 0.0 | 0.0 | 0.0 | 2.2 | 5.9 | ||||||||||||
| Departure from Normal | -2.9 | -2.0 | +0.3 | -4.2 | +0.2 | 0.0 | 0.0 | 0.0 | 0.0 | -0.1 | -1.0 | -0.9 | +0.8 | ||||||||||||
| Hastings (Municipal Airport) - Dec. 2013 - Dec. 2014 | |||||||||||||||||||||||||
| Dec. 2014 | Jan. | Feb. | Mar. | Apr. | May | June | July | Aug. | Sep. | Oct. | Nov. | Dec. | |||||||||||||
| Average High (F) | 36.3 | 39.0 | 33.6 | 51.5 | 63.9 | 75.2 | 82.4 | 84.8 | 84.5 | 75.2 | 67.9 | 47.7 | 37.9 | ||||||||||||
| Average Low (F) | 12.4 | 12.8 | 13.2 | 22.5 | 39.2 | 50.3 | 61.9 | 62.4 | 63.7 | 53.5 | 41.6 | 21.2 | 22.4 | ||||||||||||
| Average Temperature (F) | 24.3 | 25.9 | 23.4 | 37.0 | 51.6 | 62.7 | 72.2 | 73.6 | 74.1 | 64.3 | 54.8 | 34.4 | 30.1 | ||||||||||||
| Departure from Normal (F) | -3.3 | -0.1 | -6.5 | -2.9 | +0.9 | +1.4 | +0.4 | -3.5 | -0.2 | -1.3 | +2.2 | -4.3 | +2.5 | ||||||||||||
| Precipitation (inches) | 0.14 | 0.37 | 0.34 | 0.15 | 3.93 | 2.15 | 8.69 | 1.48 | 7.79 | 1.78 | 1.76 | 0.23 | 0.54 | ||||||||||||
| Departure from Normal | -0.47 | -0.04 | -0.15 | -1.64 | +1.37 | -2.42 | +4.89 | -2.26 | +4.49 | -0.78 | -0.23 | -1.06 | -0.07 | ||||||||||||
| Snowfall NWS Office (inches) | 5.0 | 5.4 | 7.5 | 1.2 | 2.2 | 0.0 | 0.0 | 0.0 | 0.0 | 0.0 | 0.0 | 1.7 | 3.4 | ||||||||||||
| Departure from Normal | -1.1 | -0.6 | +1.0 | -4.0 | +1.0 | 0.0 | 0.0 | 0.0 | 0.0 | -0.2 | -1.0 | -0.9 | -2.7 | ||||||||||||
| Kearney (Regional Airport) - Dec. 2013 - Dec. 2014 (*All data from NWS coop observer with daily 24-hour obs taken around 7 AM. As a result, data may vary slightly from true "calendar day" averages) |
|||||||||||||||||||||||||
| Dec. 2014 | Jan. | Feb. | Mar. | Apr. | May | June | July | Aug. | Sep. | Oct. | Nov. | Dec. | |||||||||||||
| Average High (F)* | 36.9 | 39.0 | 33.2 | 49.1 | 62.0 | 73.5 | 82.0 | 84.4 | 85.1 | 74.5 | 68.3 | 47.5 | 37.0 | ||||||||||||
| Average Low (F)* | 12.6 | 12.6 | 13.2 | 19.7 | 35.7 | 46.1 | 59.7 | 59.2 | 61.4 | 51.1 | 38.5 | 19.2 | 19.1 | ||||||||||||
| Average Temperature (F)* | 24.7 | 25.8 | 23.2 | 34.4 | 48.8 | 59.8 | 70.9 | 71.8 | 73.2 | 62.8 | 53.4 | 33.4 | 28.0 | ||||||||||||
| Departure from Normal (F)* | -1.2 | +1.2 | -4.9 | -3.3 | +0.1 | +0.3 | +1.1 | -2.9 | +0.6 | -0.7 | +2.5 | -3.6 | +2.1 | ||||||||||||
| Precipitation (inches) | 0.10 | 0.28 | 0.36 | 0.11 | 3.35 | 0.71 | 8.53 | 0.17 | 7.60 | 2.40 | 0.99 | 0.06 | 0.69 | ||||||||||||
| Departure from Normal | -0.47 | -0.21 | -0.19 | -1.68 | +1.12 | -3.47 | +4.60 | -3.11 | +4.52 | +0.33 | -1.05 | -0.96 | +0.12 | ||||||||||||
| Snowfall (inches) | 2.7 | 2.8 | 5.8 | 1.3 | 0.7 | 0.0 | 0.0 | 0.0 | 0.0 | 0.0 | 0.0 | 1.7 | 4.0 | ||||||||||||
| Departure from Normal | -0.8 | -1.6 | +0.7 | -3.3 | -1.1 | 0.0 | 0.0 | 0.0 | 0.0 | -0.2 | -0.7 | -1.4 | +0.5 | ||||||||||||
| Ord (Evelyn Sharp Field Airport) - Dec. 2013 - Dec. 2014 (*Winter precipitation data may include coop observer reports due to automated airport equipment under-measuring snowfall liquid equivalent) |
|||||||||||||||||||||||||
| Dec. 2013 | Jan. | Feb. | Mar. | Apr. | May | June | July | Aug. | Sep. | Oct. | Nov. | Dec. | |||||||||||||
| Average High (F) | MSG | 38.3 | 33.1 | 49.8 | 62.7 | 73.1 | 80.3 | 82.9 | 83.8 | 75.2 | 66.8 | 45.6 | 35.9 | ||||||||||||
| Average Low (F) | MSG | 9.8 | 7.8 | 18.6 | 33.7 | 44.4 | 56.7 | 57.4 | 60.9 | 49.0 | 36.0 | 16.0 | 17.5 | ||||||||||||
| Average Temperature (F) | MSG | 24.0 | 20.4 | 34.2 | 48.2 | 58.7 | 68.5 | 70.1 | 72.4 | 62.1 | 51.4 | 30.8 | 26.7 | ||||||||||||
| Departure from Normal (F) | MSG | -0.6 | -7.4 | -3.5 | -0.6 | -0.6 | -0.7 | -4.3 | -0.6 | -1.5 | +1.8 | -5.5 | +1.8 | ||||||||||||
| Precipitation (inches)* | Trace | 0.06 | 0.19 | 0.20 | 1.26 | 0.51 | 8.08 | 2.07 | 5.27 | 1.68 | 1.14 | 0.06 | 1.56 | ||||||||||||
| Departure from Normal | -0.59 | -0.31 | -0.25 | -1.25 | -1.33 | -3.30 | +3.96 | -0.90 | +2.11 | -0.76 | -0.79 | -1.01 | +0.97 | ||||||||||||
| Snowfall (Coop Observer) | 0.5 | 2.5 | 5.5 | 4.0 | 2.5 | 0.0 | 0.0 | 0.0 | 0.0 | 0.0 | 0.0 | 4.0 | 10.8 | ||||||||||||
| Departure from Normal | -6.9 | -4.3 | -0.5 | -1.9 | 0.0 | 0.0 | 0.0 | 0.0 | 0.0 | 0.0 | -1.1 | -1.3 | +3.4 | ||||||||||||
| Smith Center, KS (Cooperative Observer) - Dec. 2013 - Dec. 2014 (*All data from NWS coop observer with daily 24-hour obs taken around 7 AM. As a result, data may vary slightly from true "calendar day" averages) |
|||||||||||||||||||||||||
| Dec. 2014 | Jan. | Feb. | Mar. | Apr. | May | June | July | Aug. | Sep. | Oct. | Nov. | Dec. | |||||||||||||
| Average High (F)* | 38.9 | 41.4 | 36.1 | 52.8 | 66.9 | 77.4 | 85.4 | 89.9 | 91.3 | 80.2 | 71.8 | 51.3 | 40.5 | ||||||||||||
| Average Low (F)* | 13.8 | 12.7 | 13.3 | 21.9 | 37.7 | 48.3 | 61.7 | 61.9 | 63.3 | 52.1 | 42.2 | 20.7 | 21.3 | ||||||||||||
| Average Temperature (F)* | 26.4 | 27.1 | 24.7 | 37.4 | 52.3 | 62.8 | 73.6 | 75.9 | 77.3 | 66.1 | 57.0 | 36.0 | 30.9 | ||||||||||||
| Departure from Normal (F)* | -2.4 | -0.6 | -7.3 | -4.2 | -0.2 | -0.9 | -0.4 | -3.8 | +0.1 | -2.1 | +2.2 | -4.4 | +2.1 | ||||||||||||
| Precipitation (inches) | 0.23 | 0.35 | 0.84 | 0.12 | 1.93 | 2.70 | 8.59 | 2.72 | 6.42 | 1.11 | 0.54 | 0.08 | 0.54 | ||||||||||||
| Departure from Normal | -0.43 | -0.14 | +0.26 | -1.75 | -0.34 | -1.22 | +4.98 | -1.15 | +3.12 | -0.93 | -1.34 | -1.14 | -0.12 | ||||||||||||
| Snowfall (inches) | 5.3 | 6.9 | 14.8 | 2.4 | 0.7 | 0.0 | 0.0 | 0.0 | 0.0 | 0.0 | 0.0 | 1.3 | 2.7 | ||||||||||||
| Departure from Normal | +2.1 | +3.2 | +10.7 | -0.2 | +0.1 | 0.0 | 0.0 | 0.0 | 0.0 | -0.2 | -0.4 | -0.5 | -0.5 | ||||||||||||
Most of the following images depicting December 2014 Precipitation and Temperatures are courtesy of the High Plains Regional Climate Center:
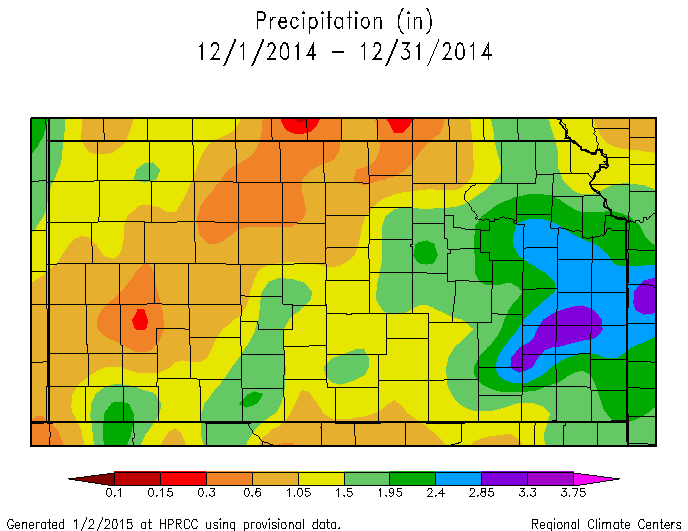
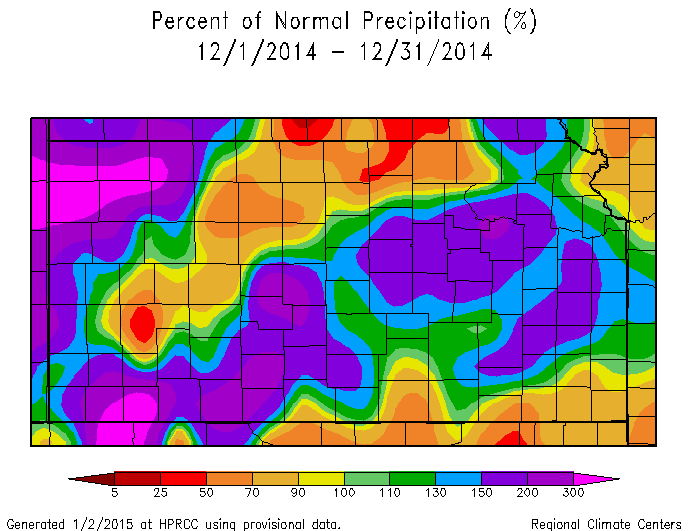
* Please note: These maps are a "best-approximation" of actual measured values, and data reflected on these maps may not exactly match actual values due to the effects of interpolation and "smoothing" used to create the maps. In addition, some "bullseyes" may be a result of missing data.
Click Images To Enlarge
| Nebraska: December 2014 Measured Precipitation (Inches) |
Kansas: December 2014 Measured Precipitation (Inches) |
 |
 |
| Nebraska: December 2014 Percent of Normal Measured Precip. |
Kansas: December 2014 Percent of Normal Measured Precip. |
 |
 |
| NWS Hastings Area: December 2014 Total "Observed" Precipitation Based On AHPS Precipitation Analysis Including Radar Data |
|
 |
While the precipitation images above are based strictly on gauge-measured data, this image on the left utilizes an "Observed" multisensor approach created by River Forecast Centers. Hourly precipitation estimates from WSR-88D NEXRAD radar are compared to ground rainfall gauge reports, and a bias (correction factor) is calculated and applied to the radar field. For much more information on these types of images, and to create your own precipitation maps, please visit the following site: https://www.srh.noaa.gov/ridge2/ |
| Nebraska: December 2014 Temperature Departure from Normal (F) |
Kansas: December 2014 Temperature Departure from Normal (F) |
 |
 |
The following drought category images, current as of December 30, 2014, are courtesy of the U.S. Drought Monitor (see narrative above for more details):
Click Images To Enlarge
 |
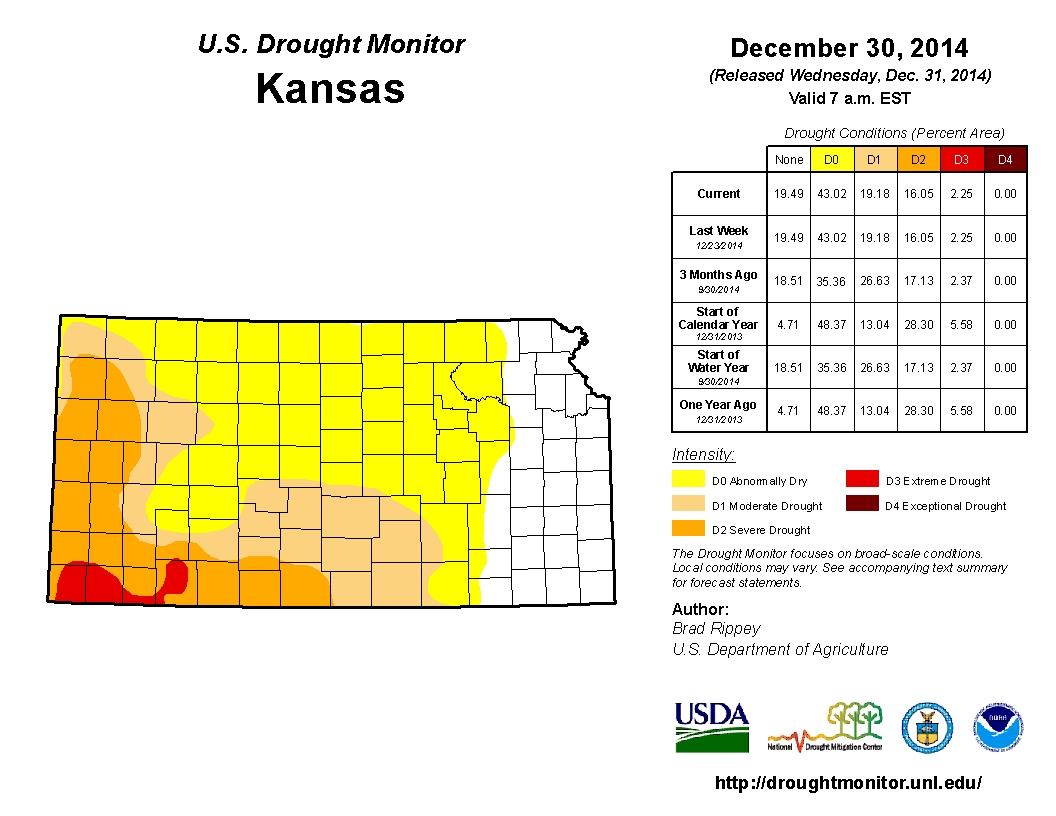 |
| Nebraska - U.S. Drought Monitor as of December 30, 2014 | Kansas - U.S. Drought Monitor as of December 30, 2014 |
For more climate related information, check out the following websites:
| This page was composed by the staff at the National Weather Service in Hastings, Nebraska. |


 Follow us on YouTube