
A few strong to marginally severe thunderstorms are possible across the Southeast U.S. Friday. A Marginal Risk (Level 1 of 5) outlook has been issued. Strong winds and hail will be the main threats. Elevated to locally critical fire weather conditions will persist across south-central Colorado today due to dry conditions and gusty winds. Read More >
|
The 18-20 December 2009 Winter Storm Laurence G. Lee and Patrick D. Moore 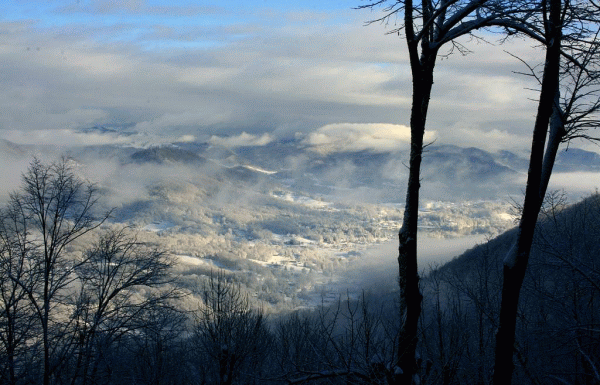
Heavy snow fell across the mountains of North Carolina on 18-19 December 2009. Numerous locations received more than a foot of snow from the event. Image taken by Bob Child. Author's Note: The following report has not been subjected to the scientific peer review process. 1. Introduction A low pressure system developed over the northern Gulf of Mexico and moved northeast through extreme south Georgia on Friday, 18 December, and along the Carolina coast on Saturday, 19 December 2009. Snow accumulated across most of the mountains and foothills of North Carolina and extended across a large portion of the northwest Piedmont of North Carolina. Snowfall totals of one to two feet were common across the central and northern mountains, and the northern foothills near the Blue Ridge (Fig. 1). Most of extreme northeast Georgia, the area along and to the south of Interstate 85 in Upstate South Carolina, and the southern part of the Charlotte metropolitan area experienced a mixture of rain, sleet, and freezing rain. Click here to view a list of unofficial snowfall reports. 
Figure 1. Total snow and sleet accumulation (in inches) for the period 18-21 December 2009 across the NWS Greenville-Spartanburg County Warning Area. Click on image to enlarge. The low pressure system continued to move north off the Mid-Atlantic coast on 19 December and produced significant amounts of snow over northwest North Carolina and western Virginia, north central North Carolina, south central and Tidewater Virginia, and northern Virginia and the Washington, DC, metro area. Click on the above links to view storm summaries from other National Weather Service offices across the Mid-Atlantic region. 2. Synoptic Developments and Storm Effects a. 0000 UTC to 1200 UTC - 18 December 2009 At 0000 UTC on 18 December, the 500 mb analysis showed a ridge over the southeastern United States, a ridge along the West Coast, and a trough that extended from the Dakotas to south Texas (Fig. 2). Within the larger scale trough, short wave troughs were located over the Texas coast, Oklahoma Panhandle, and the northern Rocky Mountains. The 250 mb analysis at the same time showed a well-defined jet structure with a large area of 80 to 100 kt winds extending from Louisiana north over the Ohio Valley then east over the Atlantic Ocean. The jet core contained a 130 kt wind maximum over the mid-Atlantic region (Fig. 3). Another wind maximum (85 to 95 kt) was diving southward on the west side of the trough over the central and northern Rockies. Yet another 250 mb wind was evident on the edge of the analysis area over the southwestern Gulf of Mexico. The Gulf of Mexico wind maximum was the leading edge of a strong subtropical jet stream over the eastern North Pacific near 15N 110W. 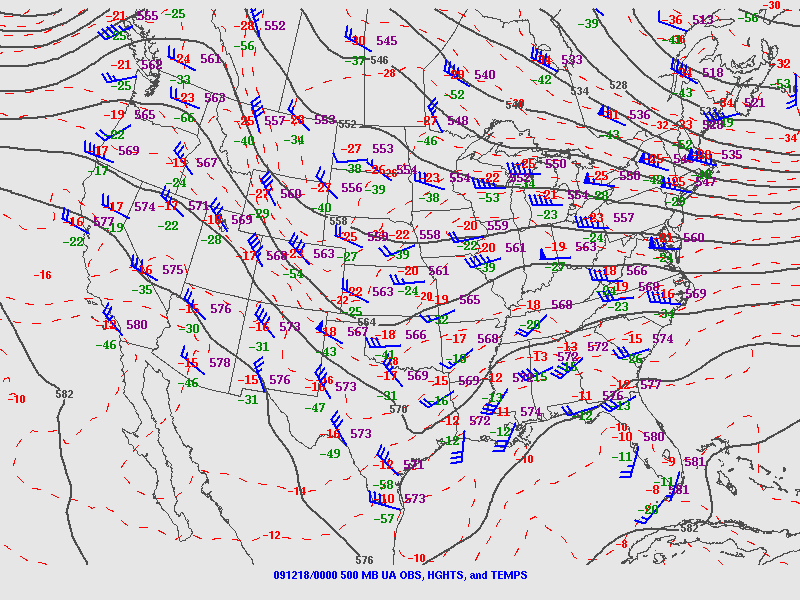
Figure 2. SPC objective analysis of 500 mb geopotential height, temperature and wind at 0000 UTC on 18 December. Click on image to enlarge. 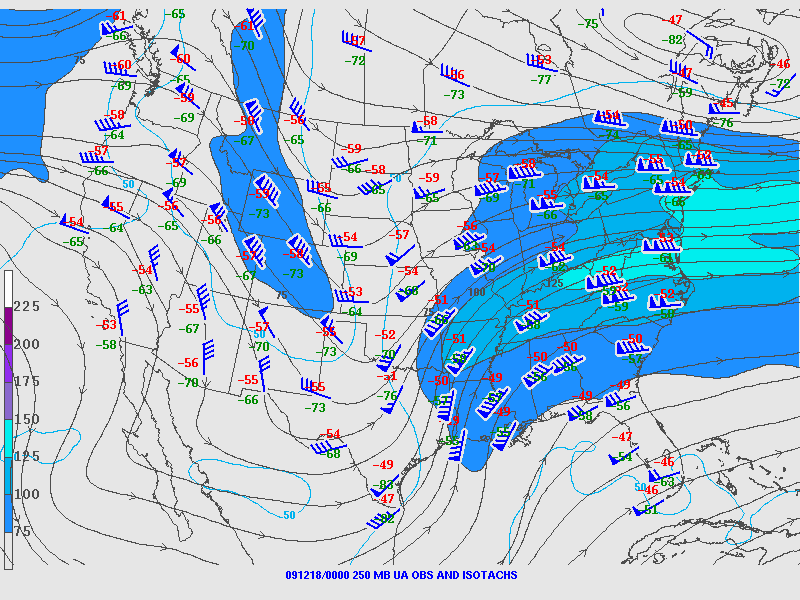
Figure 3. SPC objective analysis of 250 mb isotachs, streamlines, and wind barbs at 0000 UTC on 18 December. Click on image to enlarge. The existence of multiple jet streams with wind maxima at different levels is a common feature of strong cyclogenesis. For details regarding processes related to horizontal and along-stream wind speed variations and their relationships to vorticity, divergence, and vertical motion, refer to Uccellini and Johnson (1979), and Kocin and Uccellini (2004a). The 0000 UTC surface analysis placed a 1006 mb center of low pressure over the Gulf of Mexico approximately 150 miles south of Louisiana (Fig. 4). A cold front extended southward from the low and a nearly stationary front stretched east across central Florida. High pressure extended from James Bay to the Carolinas. The highest pressure (1031 mb) was east of Lake Huron. 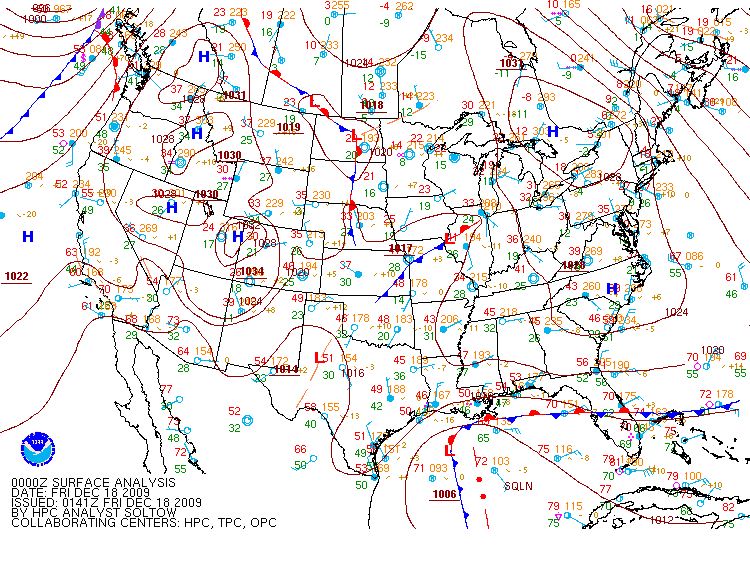
Figure 4. HPC surface fronts and pressure analysis at 0000 UTC on 18 December. Click on image to enlarge. Infrared satellite imagery at 2345 UTC on 17 December showed a cloud pattern typical of those associated with a developing low pressure system (Fig. 5). The western and northern edge of the growing comma pattern displayed a convex shape and a sharpening edge near the axis of the jet. The coldest cloud tops were in the general area where moist, potentially unstable air in the warm conveyor belt began its ascent into the mid and upper levels. The western edge of the cloud mass consisted of a well-defined margin between high, cold clouds in the warm conveyor belt flowing from the south and warmer clouds in dry air at a lower level descending from the west. The location of these infrared cloud features in the right rear quadrant of a strong jet maximum was an indicator of cyclogenesis. 
Figure 5. GOES-12 infrared satellite imagery at 2345 UTC on 17 December with 250 mb isotachs (kt; light blue contours) from the 80-km NAM model initial analysis at 0000 UTC on 18 December. Click on image to enlarge. b. 1200 UTC to 1800 UTC 18 December 2009 By 1200 UTC on 18 December, the surface low pressure system (1001 mb) was near the mouth of the Mississippi River (Fig. 6). The surface high (1030 mb) was centered just north of Lake Ontario with a ridge extending southward through the mid-Atlantic region to the Carolinas. The high was not particularly strong, but cold air damming was underway as evidenced by the ageostrophic surface wind (i.e., nearly normal to the isobars) and cold air advection from southern Virginia across both Carolinas. Precipitation had spread across much of the southeastern United States north of the surface low and ahead of the strong upper level divergence in the entrance region of the 250 mb wind maximum. The upward motion at lower levels was depicted by the warm conveyor belt on the 300 K isentropic surface (Fig. 7). The 40 to 50 kt southerly winds were rapidly ascending the surface with an upward motion (omega) maximum over Alabama. The dry conveyor belt (axis of strong northwest winds) over the northwestern Gulf of Mexico was descending along the same isentropic surface resulting in a region of very dry air that tightened the moisture gradient and contributed to further development of the comma cloud pattern seen in satellite imagery. 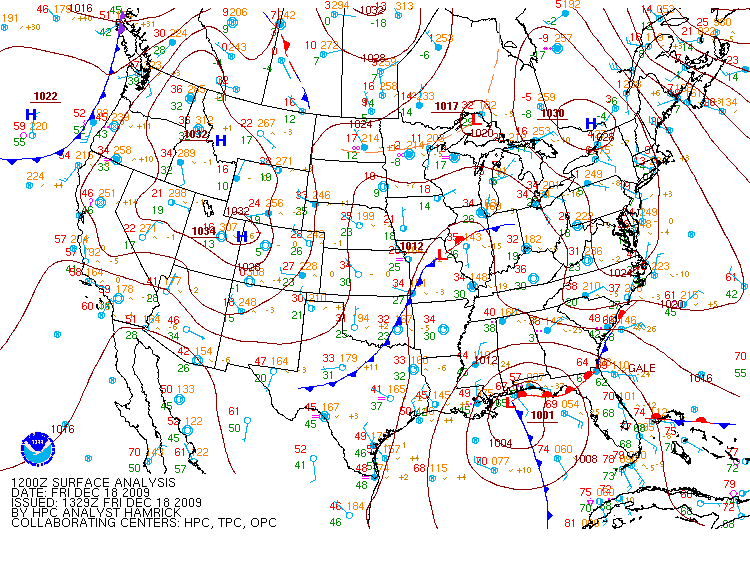
Figure 6. As in Fig. 4, except for 1200 UTC on 18 December. Click on image to enlarge. 
Figure 7. Isentropic analysis from the 80-km NAM model on the 300 K surface at 1200 UTC on 18 December, including pressure (mb; blue contours), wind (kt; barbs), vertical motion (omega, microbars sec-1; green contours and color fill, warmer colors denote upward motion and cooler colors show downward motion). Click on image to enlarge. A radar reflectivity mosaic at 1208 UTC showed a band of higher reflectivity in the developing comma head (Fig. 8), a feature often seen in maturing extratropical cyclones when strong forcing acts on an unstable atmosphere. A north-south cross section from Indiana to the eastern Gulf of Mexico (Fig. 9) showed a maximum in the upward motion field over Alabama. The upward motion included a layer of atmosphere that was symmetrically unstable. Near zero or negative values of saturated geostrophic equivalent potential vorticity indicated instability that could be released in vertical and/or horizontal motions. 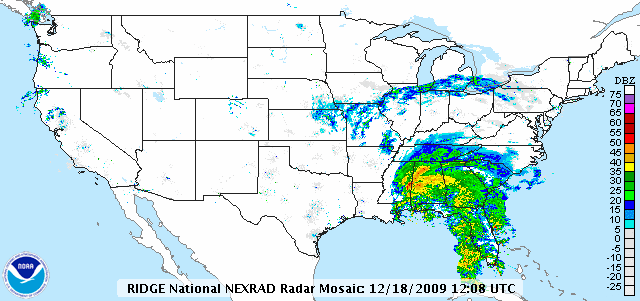
Figure 8. National radar reflectivity mosaic at 1208 UTC on 18 December. Click on image to enlarge. 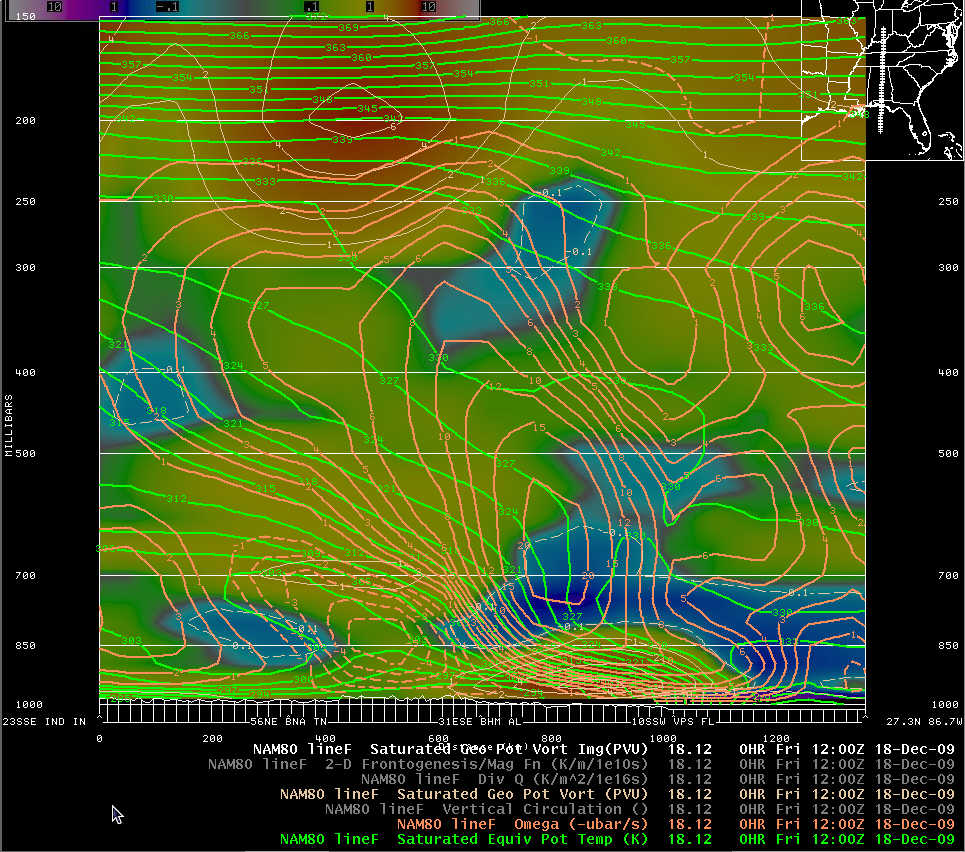
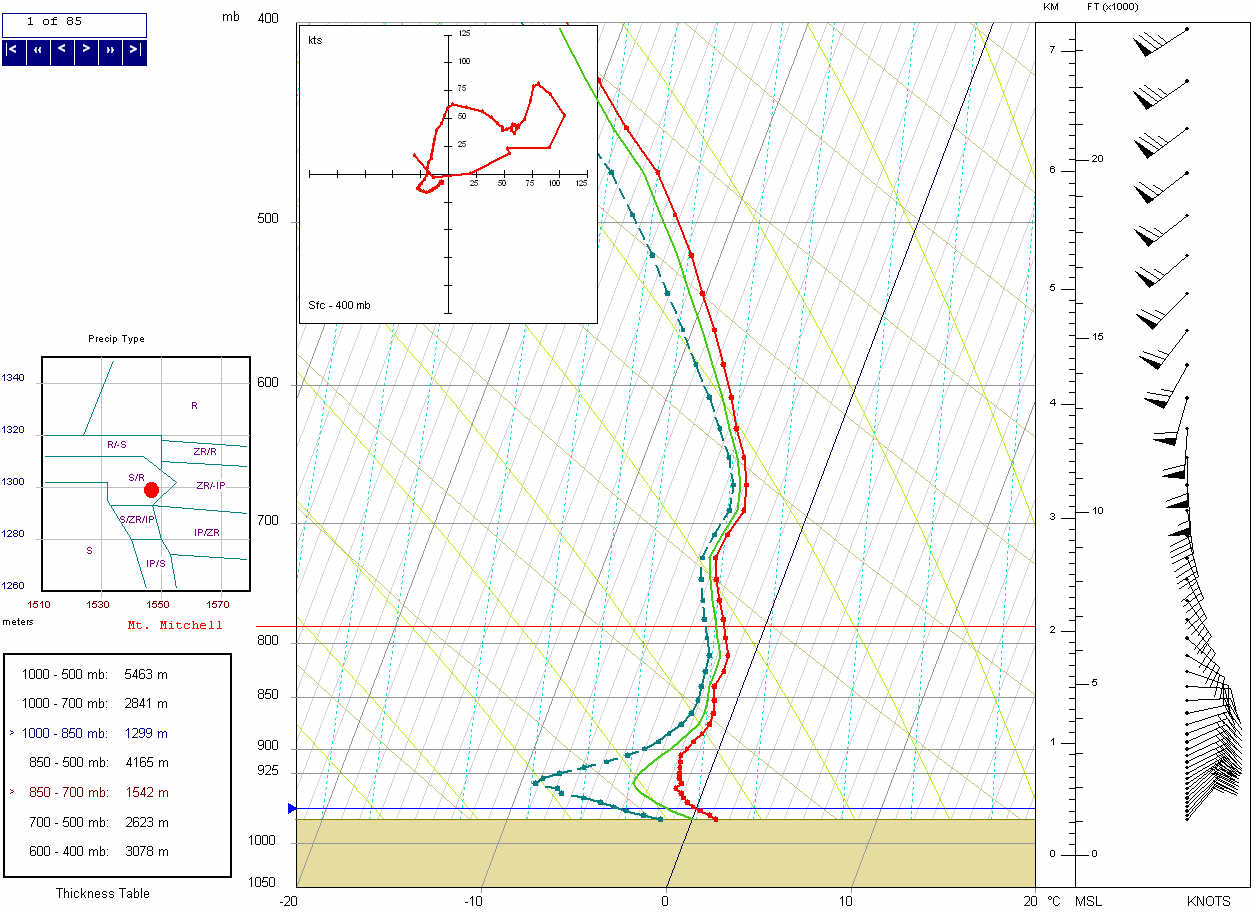
Figure 9. Vertical cross-section from the 80-km NAM model at 1200 UTC on 18 December extending from Indiana (left margin) to the eastern Gulf of Mexico (right margin), showing vertical motion (orange contours, solid upward and dashed downward), saturated equivalent potential temperature (Kelvins; green contours), and saturated geostrophic potential vorticity (PVU; color fill, where blue denotes values at or below zero). Click on image to enlarge. Light snow began at the Asheville (NC) Regional Airport (AVL) around 1200 UTC as a narrow band of precipitation moved out of north Georgia and Upstate South Carolina into western North Carolina ahead of the main area of precipitation. An upper air sounding taken at Poga Mountain (northern Avery County), North Carolina (Fig. 10), showed a layer from the surface up to about 800 mb where the temperature was just above 0 oC, but a relatively dry sub-cloud layer below 700 mb. Although snow was not falling at Poga Mountain at 1200 UTC, snow crystals falling through the sub-cloud layer quickly brought the temperature sounding down around freezing due to evaporative cooling. Southwest flow around 850 mb suggested that warm air might be advected northeastward across the mountains, and in fact the temperature around 850 mb climbed above freezing by 1500 UTC as seen on an initial analysis profile of temperature and dewpoint from the 13-km Rapid Update Cycle (RUC) model at AVL (Fig. 11). By 1500 UTC, the precipitation changed to rain and the surface temperature increased from 0 oC to +2 oC. 
Figure 10. Skew-T, log P diagram for upper air sounding taken at Poga Mountain, North Carolina, at 1208 UTC on 18 December. Click on image to enlarge. 
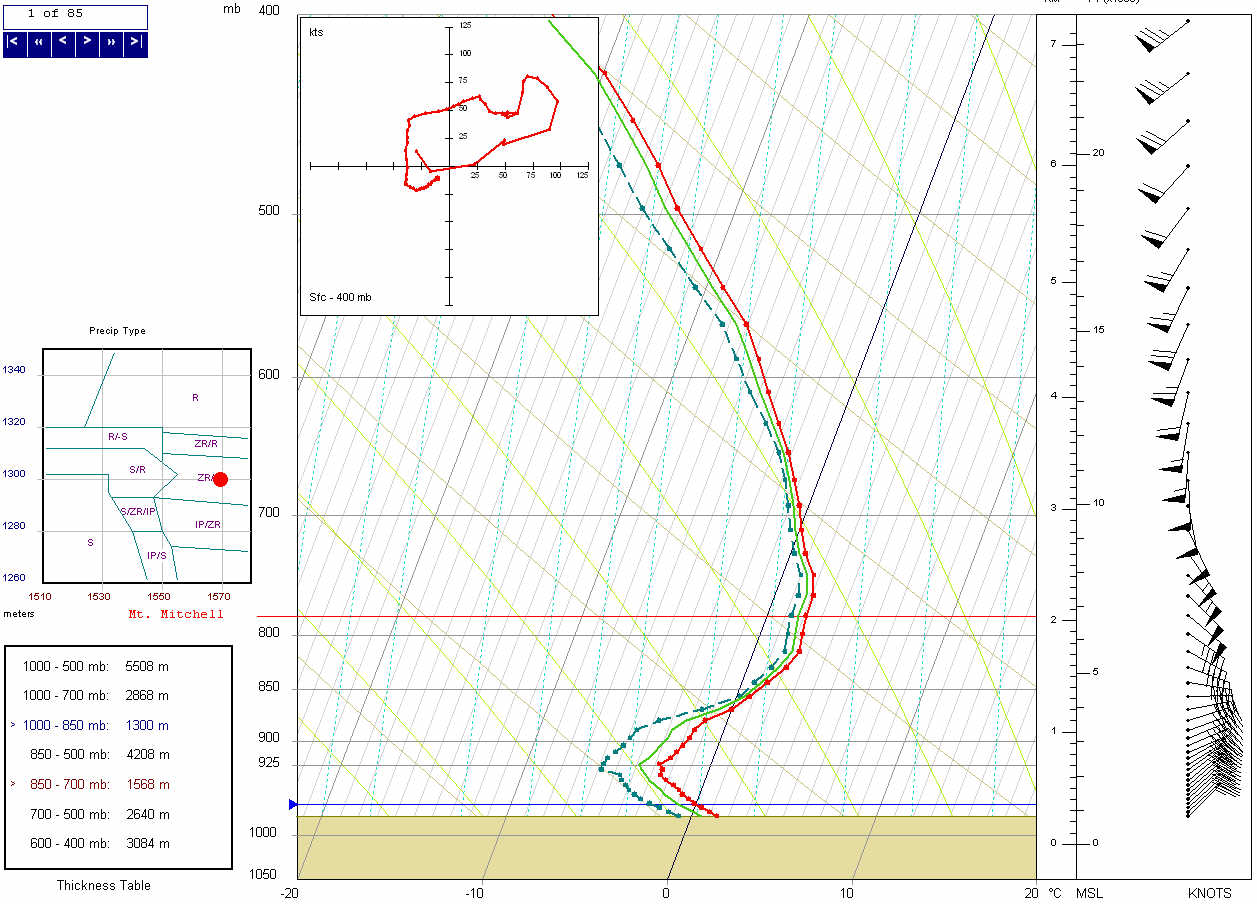
Figure 11. Initial analysis profile of temperature, dewpoint, and wind from the 13-km RUC at 1500 UTC on 18 December. Click on image to enlarge. Light snow began falling at Hickory, North Carolina (HKY), just before 1400 UTC as the first narrow band of precipitation moved northward across central and western North Carolina. The RUC13 temperature and moisture profile at HKY did not accurately capture the onset of precipitation. On the two-hour forecast valid at 1400 UTC (Fig. 12), the near-surface layer was much too dry, but the model wet bulb temperature profile indicated the temperature in that layer would cool to below 0 oC if saturation occurred. Of note was a small warm nose forecast near 850 mb. Either that was not actually there, or snow falling from above was able to penetrate the layer before melting. 
Figure 12. Two-hour forecast profile of temperature, dewpoint, and wind at HKY from the 13-km RUC valid at 1400 UTC on 18 December. Click on image to enlarge. The initial narrow band of precipitation that moved north across the area was more than likely a result of frontogenetical forcing. A vertical cross-section of upward motion and frontogenesis from the Georgia-Florida border, through far western North Carolina, to southern Ohio at 1200 UTC (Fig. 13) showed positive frontogenesis aligned with the frontal boundary sloping from the surface in south Georgia to mid-levels near the Ohio River. A frontogenesis maximum and an upward motion maximum were in close proximity over the mountains, which was the approximate location where the cross-section cut through the precipitation band seen on the 1400 UTC radar mosaic in Fig. 14. 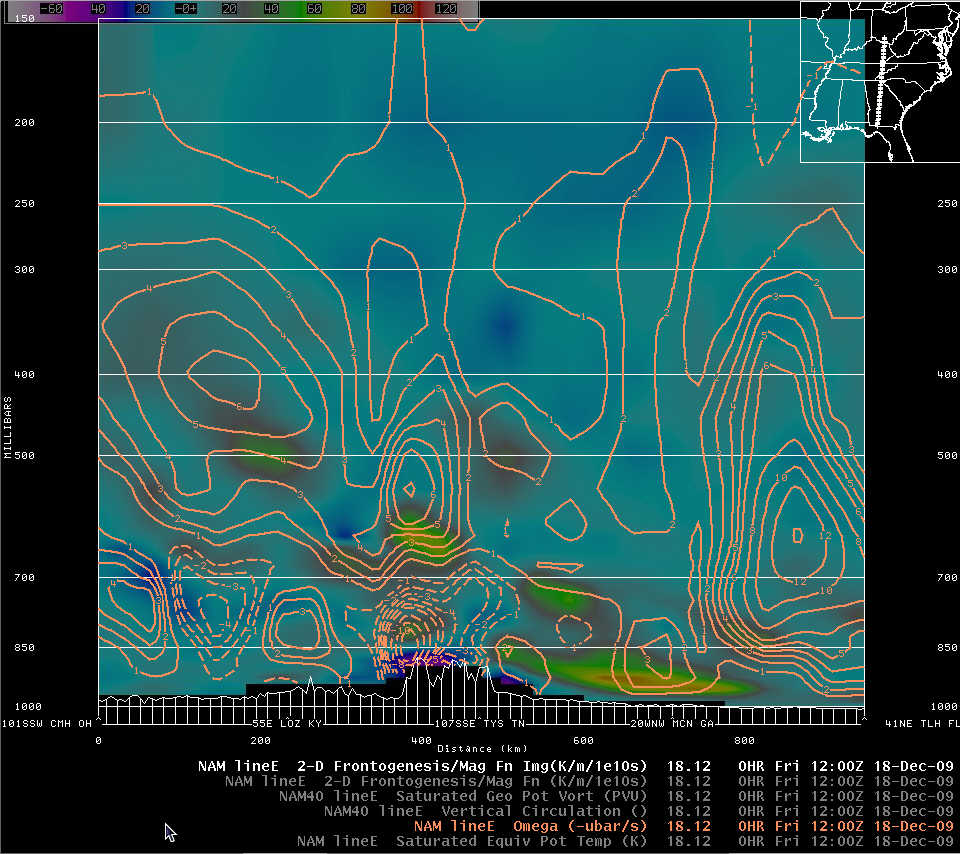
Figure 13. Vertical cross-section from southern Ohio (left margin) to northwest Florida (right margin) of verticsal motion (orange contours, solid is upward and dashed is downward) and frontogenesis (color fill; green, yellow, and orange shades are positive) from the 40-km NAM model at 1200 UTC on 18 December. Click on image to enlarge. 
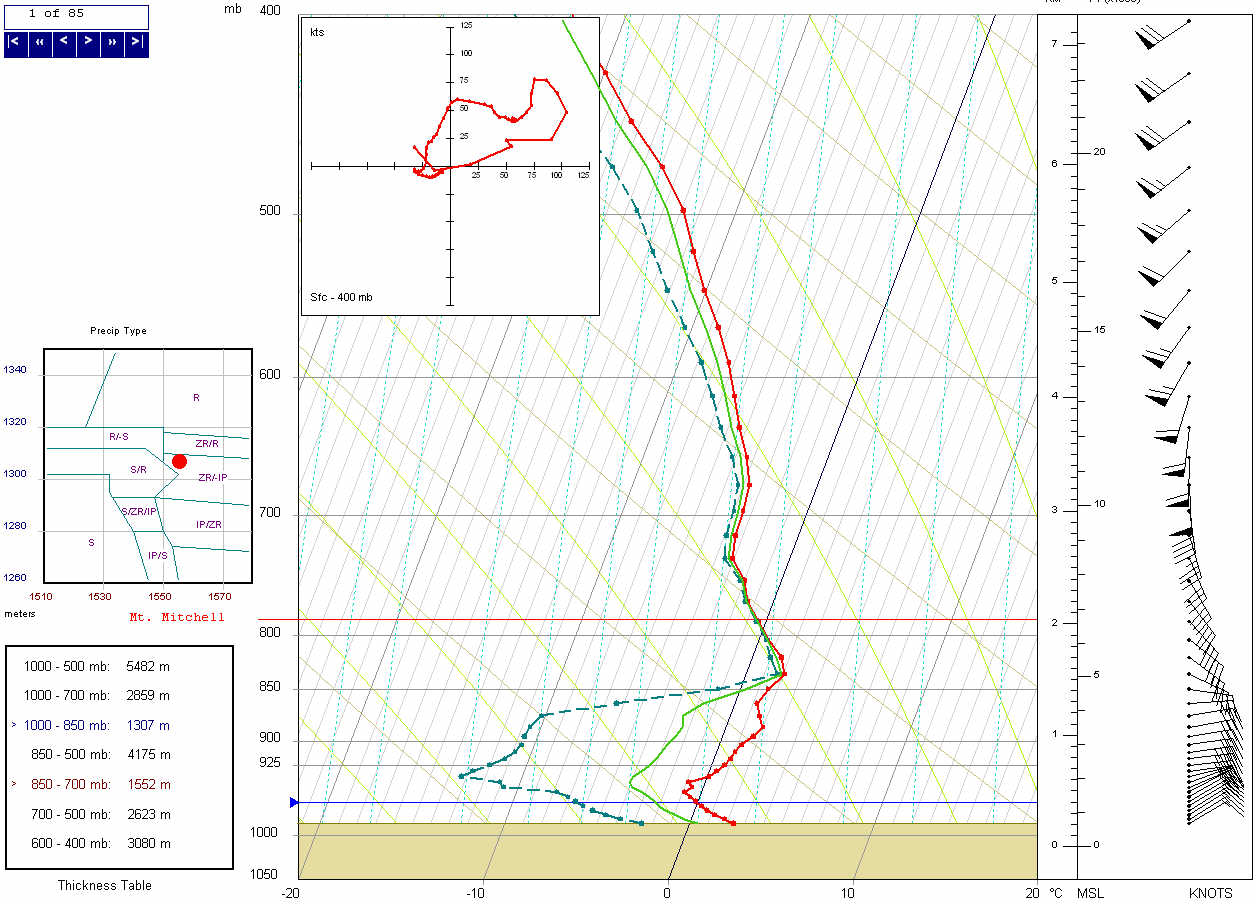
Figure 14. NWS composite radar reflectivity mosaic at 1400 UTC on 18 December. Click on image to enlarge. Soon after the preliminary band of precipitation affected the western Carolinas, the main area of precipitation spread northward across the region. A brief period of light rain was observed at Anderson, South Carolina (AND), during the passage of the initial precipitation band, but the steady rain began at approximately 1400 UTC. The onset of rain at Greenwood, South Carolina, also occurred near 1400 UTC. The rain began at the Greenville-Spartanburg Airport (GSP) at approximately 1500 UTC. The 13-km RUC profile in Fig. 15 indicated the surface wet bulb temperature was 0 oC, but a rather deep warm layer between 925 mb and 825 mb melted the snow falling from above. 
Figure 15. 13-km RUC model initial analysis profile of temperature, dewpoint, and wind for GSP at 1500 UTC on 18 December. Click on image to enlarge. c. 1800 UTC - 18 December 2009 to 1200 UTC - 19 December 2009 At 1800 UTC, surface low pressure was centered over northwest Florida and precipitation had spread over nearly all of northeast Georgia and the western Carolinas (Fig. 16). Snow was falling at both AVL (33 oF) and Hickory (HKY; 31 oF), and rain was observed at GSP (34 oF). Continuous precipitation began at Charlotte (CLT) around 1800 UTC. The precipitation started as rain, but a mixture of sleet and rain began at 2005 UTC as the surface temperature lowered from 37 oF to 34 oF. The 13-km RUC profile at CLT valid at 1900 UTC identified a deep warm layer just above the surface. The strong easterly wind flow seen in the lower portion of the wind profile was responsible for spreading the warm air into the area. 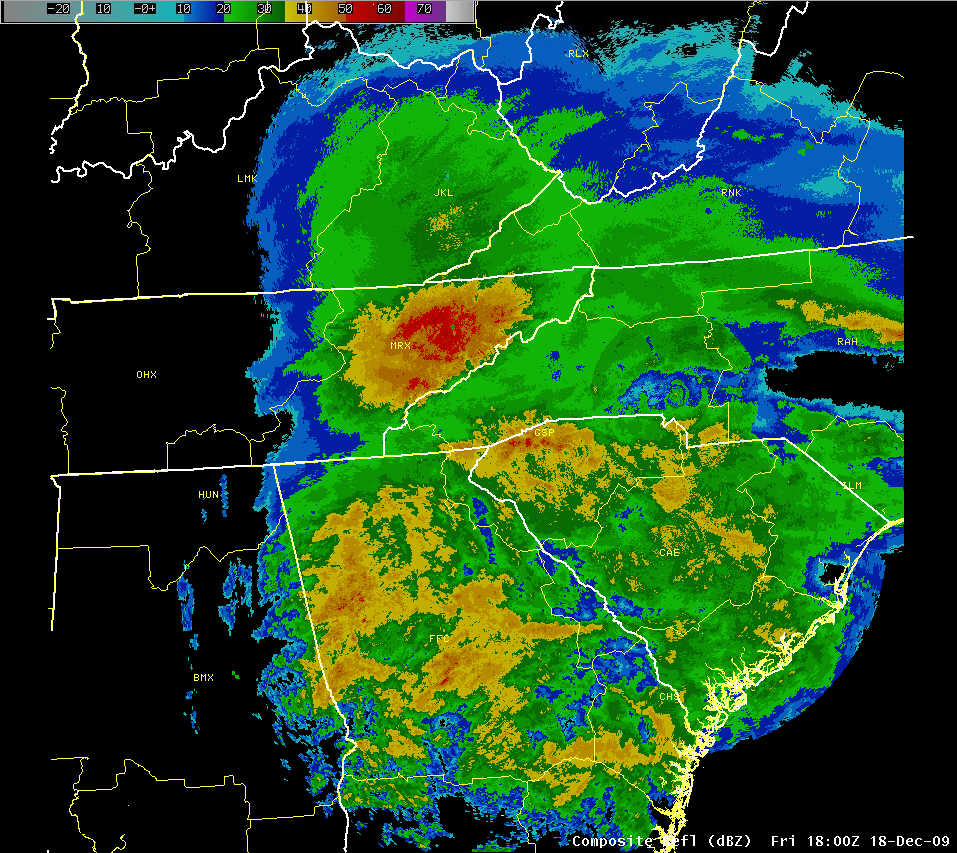
Figure 16. As in Fig. 14, except for 1800 UTC on 18 December. Click on image to enlarge. The upper-level wind analysis at 1800 UTC showed the primary 250 mb jet maximum over New England (Fig. 17) with the axis of strong wind extending west and southwest to Tennessee. A secondary wind maximum was along the Carolina coast. The strongest upper-level divergence in the 300-500 mb layer (Fig. 18) was located along the Tennessee - North Carolina border and extended south along the Georgia - South Carolina border. Beneath the upper-level divergence, strong ascent was occurring. The 300 K isentropic analysis at 1800 UTC showed a well-defined, strong wind flow climbing the isentropic surface with the maximum upward motion centered over Georgia and extending into the western Carolinas (Fig. 19). 
Figure 17. 40-km NAM model 250 mb geopotential height (dam; green contours), wind barbs (kt), and isotachs (kt; beige contours and color fill) at 1800 UTC on 18 December. Click on image to enlarge. 
Figure 18. 40-km NAM model 500-300 mb average geopotential height (dam; green contours), wind barbs (kt), and divergence (s-1; beige contours and color fill) at 1800 UTC on 18 December. Click on image to enlarge. 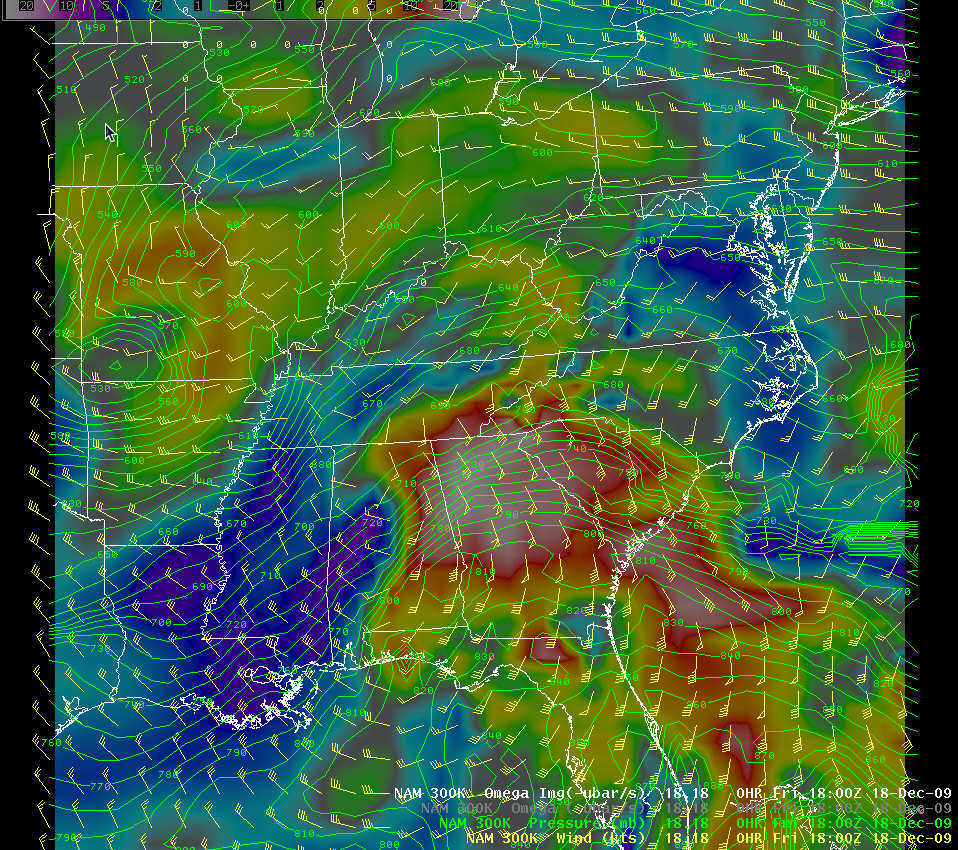
Figure 19. 40-km NAM model isentropic analysis on the 300 K surface at 1800 UTC on 18 December showing pressure (mb; green contours), wind (kt; barbs), and omega (color fill, where warmer colors represent upward vertical motion). Click on image to enlarge. A cross section from central Florida to southern Wisconsin (Fig. 20) highlighted the sloping region of frontogenetical forcing extending from the surface in south Georgia to near 500 mb over Tennessee and Kentucky. The atmosphere's response to frontogenetical forcing was a circulation that produced ascending air on the warm side of the front and subsiding air on the cool side of the front. In this particular situation, that circulation resulted in the tall tower of upward motion seen in Fig. 21. Also shown in the figure was the saturated geostrophic potential vorticity which was an indicator of instability in the atmosphere. The blue shade in the portion of the upward motion maximum where the saturated equivalent potential temperature increased with height indicated the potential for enhanced precipitation to occur in slantwise motion. Indeed, that is what was seen in the radar mosaic (Fig. 22) over middle Tennessee. 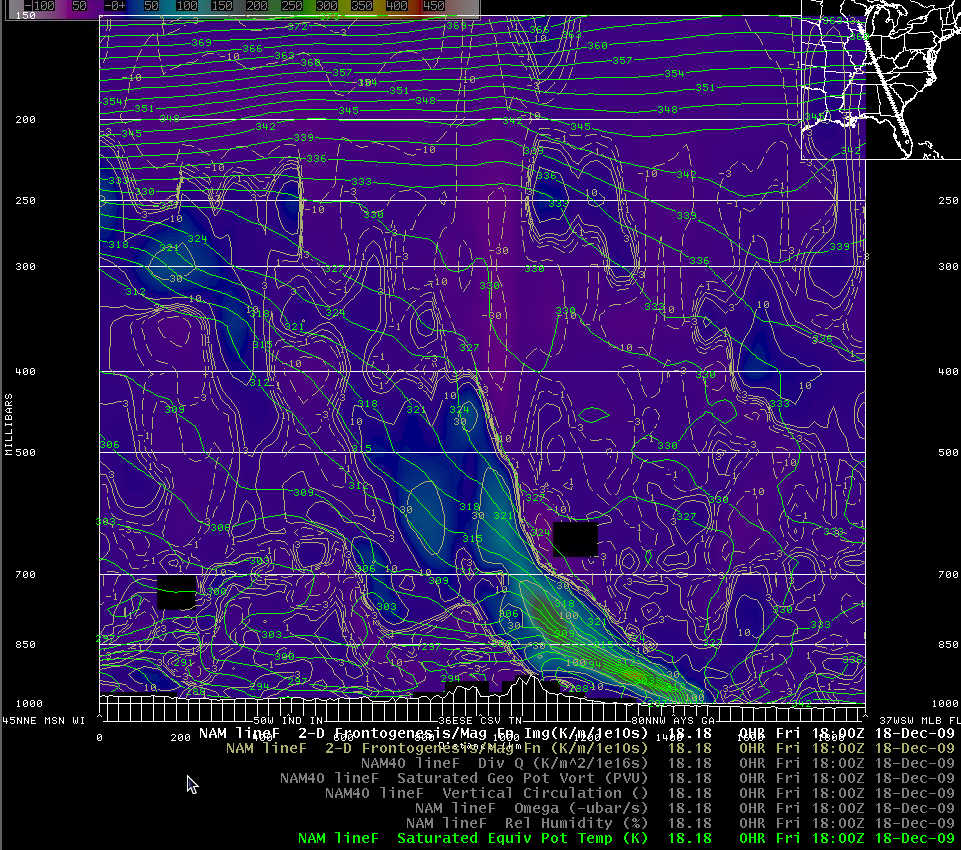
Figure 20. 40-km NAM model vertical cross section from Wisconsin (left margin) to central Florida (right margin) showing saturated equivalent potential temperature (Kelvins; green contours) and frontogenesis (color fill) at 1800 UTC on 18 December. Click on image to enlarge. 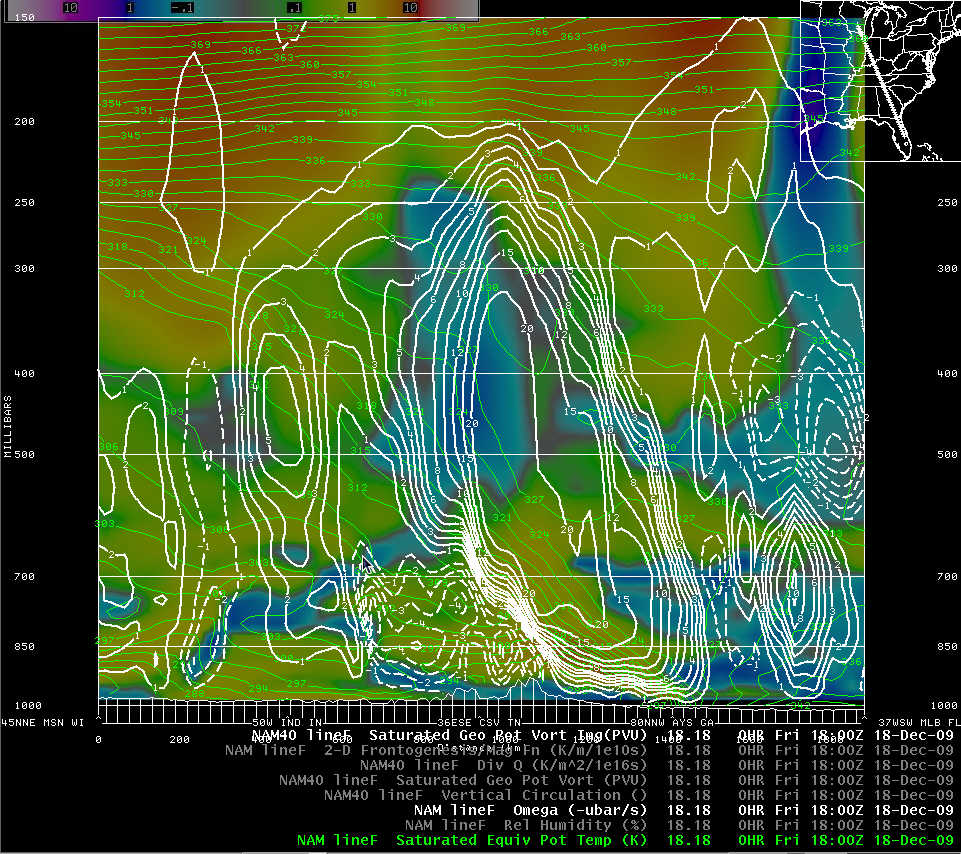
Figure 21. As in Fig. 20, except showing vertical motion (white contours, solid is upward and dashed is downward), saturated equivalent potential temperature (Kelvins, green contours), and saturated equivalent potential vorticity (PVU; color fill). Click on image to enlarge. 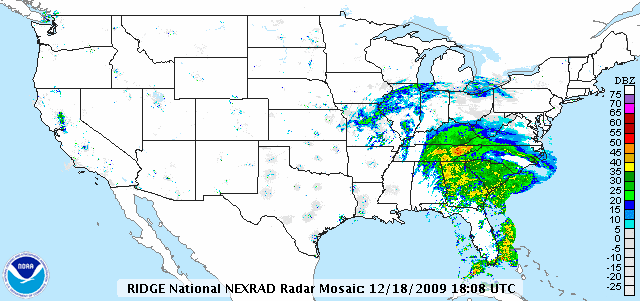
Figure 22. As in Fig. 8, except for 1808 UTC. Click on image to enlarge. A broad view of the lower tropospheric thermal structure at 1800 UTC is seen in Fig. 23. The 1000-850 mb thickness pattern revealed two key features: The nose of cold air just east of the Appalachians and the tight thermal gradient in the frontal boundary extending from the eastern Gulf of Mexico to the South Carolina coast. The 850-700 mb thickness pattern depicted the northward progression of warm air that is the result of the 40 to 50 kt southerly wind in that layer. 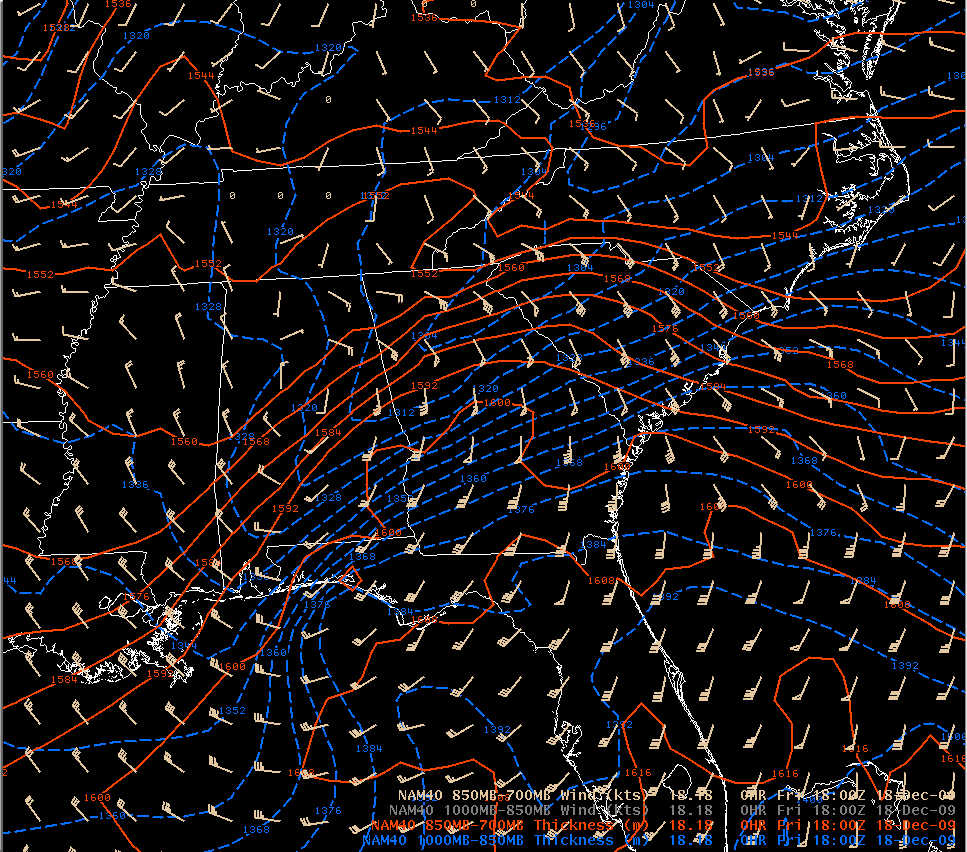
Figure 23. 40-km NAM model thickness in the 1000-850 mb layer (m, blue lines) and 850-700 mb layer (m, red lines), and 850-700 mb mean wind (kt; standard barbs) at 1800 UTC on 18 December. Click on image to enlarge. Initial hour profiles from the 40-km NAM model identified details of the thermal structure at AVL, HKY, GSP, and CLT at 1800 UTC (Fig. 24). The AVL sounding was clearly a snow sounding with both the temperature and wet bulb temperature below 0o C through the entire profile. (Saturation is not indicated in the primary dendritic snow crystal growth region (-12 oC to -18 oC), but we know from radar data that precipitation-size particles were present.) The model temperature profile at HKY was similar to Asheville's in that the temperature and wet bulb temperature profiles were subfreezing except for a slightly above freezing surface temperature. In actuality, the 1800 UTC surface temperature was 31 oF and snow was falling. The GSP profile displayed an even warmer and thicker layer of above freezing air from 850 to 700 mb. Below 850 mb, the wet bulb temperature was below 0o C, but the surface temperature was a degree or two above freezing. The continuous precipitation that began as rain just before 1700 UTC mixed with sleet at 2000 UTC. The 1800 UTC model sounding at CLT showed temperatures warmer than 0 oC in most of the layer from the surface to 800 mb. However, the wet bulb temperature was below 0 oC. This indicated the initial precipitation would more than likely arrive at the surface as rain, but as evaporation cooled the air, freezing or frozen precipitation would eventually be observed. A very important feature in the CLT profile was the warm nose between 800 and 850 mb. The corresponding wet bulb temperature was also above 0 oC, so the warm layer was likely to persist while the air below cooled to below freezing. The strong southeast wind in the 800 to 850 layer indicates that the warm air will not only persist, but could become even warmer. The rain that started at CLT just before 1800 UTC became a rain and sleet mixture at 2005 UTC.
Figure 24. 40-km NAM model initial hour profiles of temperature (solid red line), dewpoint (dashed blue line), wet bulb temperature (green line) and wind (barbs) for AVL (top left), HKY (top right), GSP (bottom left), and CLT (bottom right) at 1800 UTC on 18 December. Click on images to enlarge. The surface analysis at 2100 UTC placed two 997 mb low pressure centers over south Georgia. The analysis indicated occlusion was underway with the primary low just south of Albany, Georgia, and the triple point low just west of Brunswick, Georgia. A nearly stationary front extended from the triple point low northeast along the Carolina coast. A cold front stretched southward through Florida. The 1026 mb high pressure center over eastern Canada extended south into the Carolinas and continued to display a weak cold air damming pattern in the isobars. During the afternoon, the upper level trough over the south central United States and the short wave trough over the Gulf Coast moved steadily eastward. The Carolinas remained in the entrance region of the strong 250 mb jet over the northeastern states. Another 250 mb wind maximum over the Gulf of Mexico was moving northeast toward Florida. The low levels of the atmosphere over the western Carolinas continued to experience isentropic lift in what appeared to be the rising branch in a dual jet circulation (Kocin and Uccellini 2004; pp. 117-120) between the two upper level wind maxima. The double jet structure was evident in a six-hour forecast cross section of isotachs and vertical motion valid at 0000 UTC on 19 December (Fig. 25). Of interest was the tower of upward motion (orange and red shades) between the two jets that extended from the surface all the way to 250 mb. The presence of a southeasterly low-level jet was highlighted by the 850 mb wind maximum of 50 to 70 kt extending from the Atlantic into the central Carolinas (Fig. 26). The 850 mb jet was the means by which considerable moisture was transported into the region of low-level convergence then subsequently lifted in the upward motion seen in the cross-section. 
Figure 25. 40-km NAM model six-hour forecast vertical cross-section from western Quebec (left margin) to Cuba (right margin) showing isotachs (kt; blue contours), saturated equivalent potential temperature (Kelvins; green contours), and vertical motion (color fill) valid at 0000 UTC on 19 December. Click on image to enlarge. 
Figure 26. 40-km NAM model six-hour forecast of wind speed (contours and barbs) and isotachs (color fill) valid at 0000 UTC on 19 December. Click on image to enlarge. The greatest precipitation rates occurred generally between 1800 UTC on 18 December and 0000 UTC on 19 December. This period coincided with a favorable superposition of the strong, convergent low-level flow transporting moisture into the western Carolinas while upper-level divergence was crossing the area. The resulting deep vertical motion produced moderate to heavy rain and snow during the afternoon and early evening. Snow was the predominant form of precipitation at both AVL and HKY during the afternoon. The rain and sleet mixture at GSP changed to freezing rain around 2100 UTC. A rain and sleet mixture at CLT became all rain at approximately 2300 UTC. By the time the occluding low pressure centers (996 and 997 mb) approached the Georgia coast at 0000 UTC on 19 December, the precipitation was diminishing across northeast Georgia and the western part of Upstate South Carolina. The dual jet circulation was propagating to the northeast so the best low level isentropic lift, divergence aloft, and associated strong upward motion were moving from central North Carolina toward the mid-Atlantic coast. The strong warm air advection just above the surface-based cold air finally modified the HKY temperature profile to the extent that snow changed to freezing rain around 0130 UTC. The vertically-pointing RENCI (RENaissance Computing Institute) MicroRain Radar (MRR) located in Newton, North Carolina (about 12 miles southeast of HKY) provided an interesting view of the event. A time vs. height display of radar reflectivity (Fig. 27) showed the passage of the initial band of precipitation (seen in Fig. 14) between 1300 UTC (0800 EST) and 1500 UTC (1000 EST). Very little precipitation occurred until the best period of low- level convergence, upper-level divergence, and upward motion crossed the area during the afternoon and evening. Moderate to heavy snow was observed at HKY between 2100 UTC (1600 EST) and 2300 UTC (1800 EST). 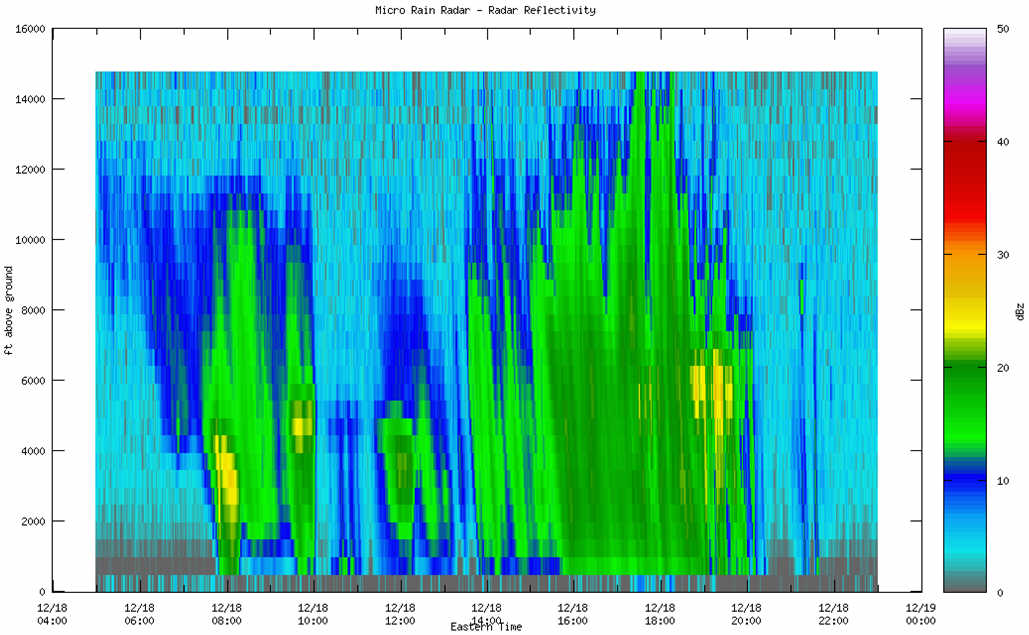
Figure 27. Vertical profile of radar reflectivity from MRR at Newton, North Carolina, from 0500 UTC to 2300 UTC on 18 December. Horizontal axis is time (EST). Vertical axis is height above ground level (ft). Click on image to enlarge. The radar derived particle fall velocity product from the MRR gave additional information about precipitation type in the column above the radar (Fig. 28). The downward-sloping (from left to right) blue shades near the left-hand margin of the image were probably associated with snow gradually descending to the surface. The yellow and red shades indicated faster fall speeds between approximately 1500 UTC (1000 LT) and 1630 UTC (1230 LT) that corresponded to a period when freezing rain was reported at HKY. The near-surface blue shades between 1630 UTC (1230 LT) and 0100 UTC (2000 LT) were the time during which moderate to heavy snow was observed at HKY. The intervals of "green fingers" reaching the ground were probably periods of heavy snow. The yellow and red colors after approximately 0000 UTC (1900 LT) occurred in conjunction with the transition of precipitation at HKY from snow to freezing rain. 
Figure 28. Vertical profile of radar-derived particle fall velocity from MRR at Newton, North Carolina, from 0500 UTC to 2300 UTC on 18 December. Horizontal axis is time (EST). Vertical axis is height above ground level (ft). Click on image to enlarge. Click to view hourly observations and meteograms:
3. Storm Wrap-up The last of the precipitation forced by the surface low exited the GSP forecast area prior to 1200 UTC on 19 December when the low pressure system was near the Outer Banks. Another burst of snow occurred along the Tennessee border during the early morning of 20 December as northwest flow forced moisture up the west slopes of the Appalachians. The low subsequently followed a track to the northeast that placed it off the southern New England coast on the morning of 20 December. In the wake of the storm, snow covered most of the North Carolina portion of the GSP forecast area, as seen in the Aqua MODIS image taken from 1842 UTC to 1854 UTC on 20 December (Fig. 29). The greatest depth was at Mount Mitchell State Park in Yancey County, where 28 inches fell. Other significant accumulations included 24 inches near Buladean (Mitchell County), 24 inches about ten miles west of Robbinsville (Graham County), and 22 inches at Little Switzerland in McDowell County. The total snowfall at Asheville was 10.1 inches and Hickory had 5 inches. 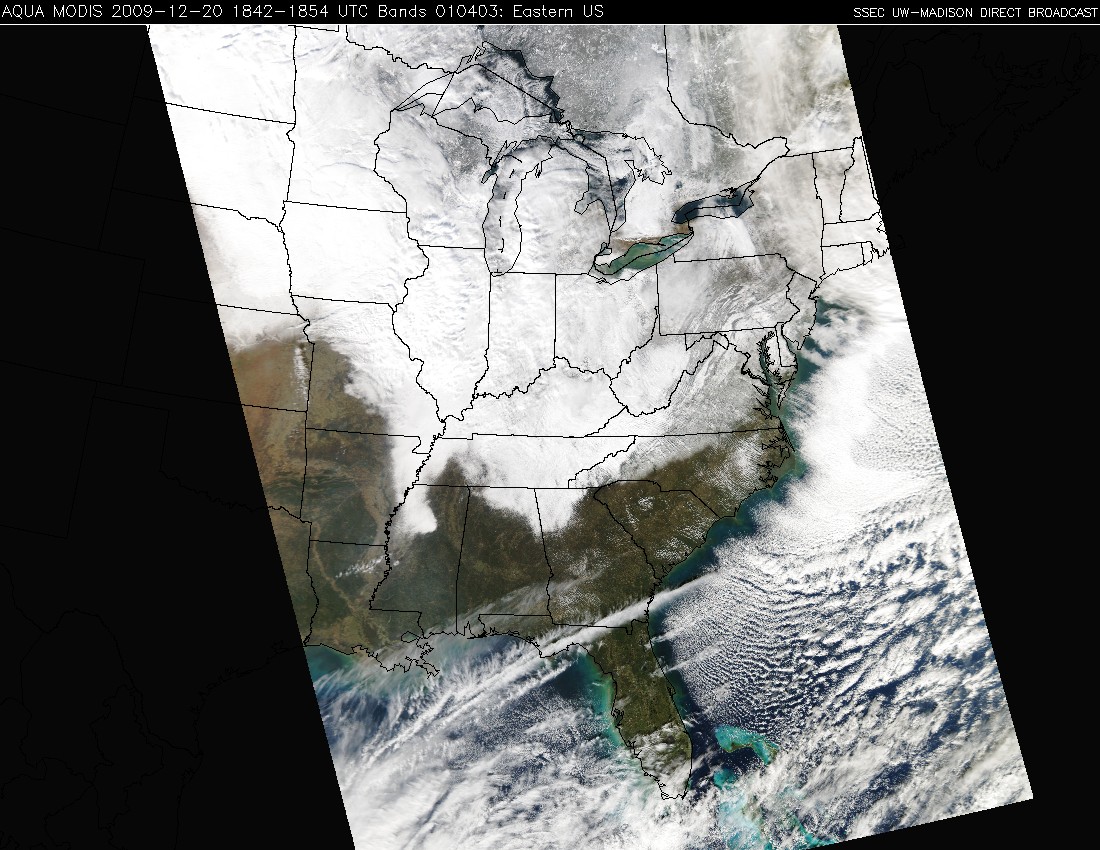
Figure 29. Aqua MODIS satellite image from 1842 UTC to 1854 UTC on 20 December. The white shades across North Carolina are mainly snow cover, although cloudiness associated with northwest flow is present along the Tennessee border. Click on image to enlarge. The storm had significant impacts to the north of the GSP forecast area. A swath of very heavy snow extended from western North Carolina through western Virginia and West Virginia to southern New England (Fig. 30). A large area of 20 to 30 inch accumulations occurred in the central Appalachians. The Northeast Snowfall Impact Scale (NESIS; Kocin and Uccellini 2004) classified this event as "Major." It ranked 23rd on a list of 37 high impact snowstorms that had affected the region from southern Virginia to New England by that date. 
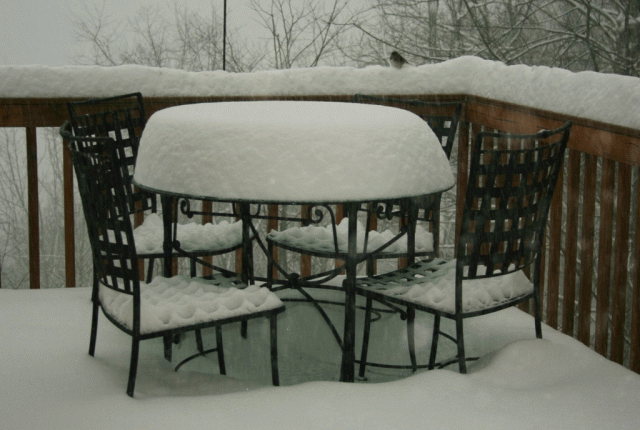
Figure 30. Preliminary snowfall analysis and NESIS rating of the 18-21 December 2009 East Coast snowstorm. Click on image to enlarge. 4. Photo Gallery Here are some images submitted to the NWS from this event.
Series of snow images taken by Bob Child, location near Lake Junaluska (Haywood County), North Carolina at 3800 ft elevation, at 1130 am (upper left), 150 pm (upper right), 530 pm (lower left), and 500 am (lower right). Click on image to enlarge.
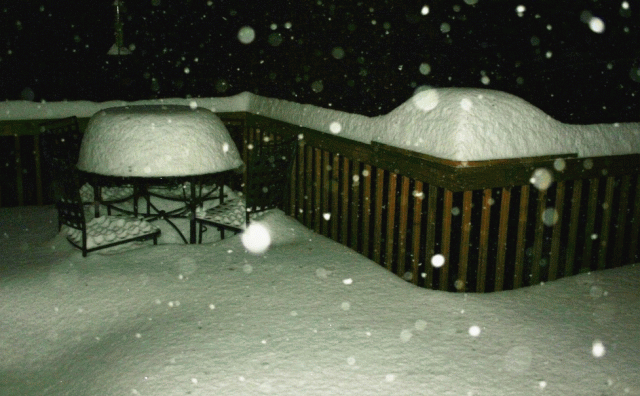
More snow images taken by Bob Child, location near Lake Junaluska (Haywood County), North Carolina at 3800 ft elevation, on the morning of 19 December 2009. Click on image to enlarge. 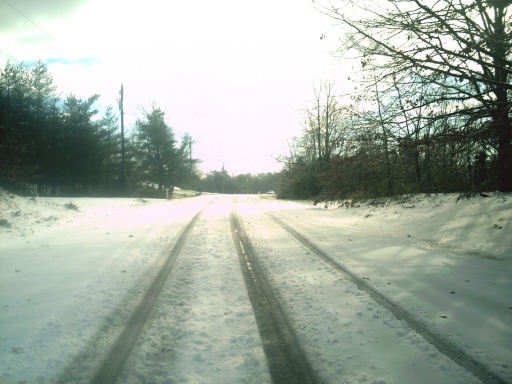
Image of snowfall in Cleveland County, North Carolina, on the morning of 19 December 2009. Click on image to enlarge. References Keeter, K.K., and J.W. Cline, 1991: The Objective Use of Observed and Forecast Thickness Values to Predict Precipitation Type in North Carolina. Wea. Forecasting, 6, 456-469. Kocin, P. J., and L. W. Uccellini, 2004: A Snowfall Impact Scale Derived From Northeast Storm Snowfall Distributions. Bull. Amer. Meteor. Soc., 85, 177-194. Kocin, P. J., and L. W. Uccellini, 2004: Northeast Snowstorms. Vol. 1: An Overview. Meteor. Monogr., No. 54, Amer. Meteor. Soc., 296 pp. Uccellini, L.W., and D.R. Johnson, 1979: The Coupling of Upper and Lower Tropospheric Jet Streaks and Implications for the Development of Severe Convective Storms. Mon. Wea. Rev., 107, 682-703. Acknowledgements The snow accumulation map was prepared by Blair Holloway, NWS. The upper air analyses were obtained from the Storm Prediction Center. The surface fronts and pressure analyses were obtained from the Hydrometeorological Prediction Center. The national radar mosaics and the NESIS snowfall analysis map were obtained from the archive at the National Climatic Data Center. The upper air sounding taken at Poga Mountain was obtained from Dr. Douglas Miller, University of North Carolina at Asheville. The NAM and RUC profiles were created using the Rawinsonde Observation (RAOB) program (Version 5.8) for Windows. The MRR images were obtained from RENCI. The Aqua MODIS image was obtained from the archives at the Space Science and Engineering Center at the University of Wisconsin. The meteograms were obtained from the Plymouth State College. |


 Current Conditions Map
 Follow us on YouTube