NOTE: This analysis will be updated as other data sources become available and are investigated. Some wind data sets are preliminary and subject to change. The most recent update includes a new section on tornadoes as well as wind data from research teams.
1. Introduction
Hurricane Ike came ashore early Saturday morning of 13 September 2008 as a category 2 storm on the Saffir-Simpson Scale with maximum sustained winds of 95 knots (110 mph). The maximum sustained winds were determined from dropsondes and flight level winds during reconnaissance flights (hurricane hunters) and velocity data from the NWS Houston/Galveston WSR-88D radar. Please see this discussion for more information about maximum sustained winds. Despite these reliable data, what were the observed winds across southeast Texas as Hurricane Ike moved inland? This discussion investigates wind data from surface observations around the region, wind analyses from the Hurricane Research Division, and wind velocity data from the NWS Houston/Galveston WSR-88D radar to better understand what kind of winds were possible across southeast Texas.
2. Surface Observations
The NWS Houston/Galveston provided a table of maximum winds in its post storm report. The wind observations came from area surface observations at airports across southeast Texas. This should provide a general idea of the strength of the winds across the area especially for areas where power outages were not an issue. Only one observing station reported sustained hurricane force winds and hurricane force wind gusts. A manual observation from the control tower at Hobby Airport in Houston reported winds of 65 knots (75 mph) with gusts of 80 knots (92 mph). Also note that Bush Intercontinental Airport did not report hurricane force winds despite the eye of the Hurricane Ike passing fairly close to the airport. Ike could have weakened enough not to cause hurricane force winds in that part of the storm as it neared the airport. Other observations quit operating as Ike moved inland mainly due to power outages from the strong winds. The observation at Galveston Scholes Field stopped reporting due to the storm surge that moved into the island on Friday. We can only speculate that if other observations did not fail during the hurricane that there would have been more reports of hurricane force winds. The discussion moves on to alternative sources of data to better understand the wind fields over southeast Texas.
3. Wind Analyses/Doppler Velocity Comparison
a. Ike's Wind Swath
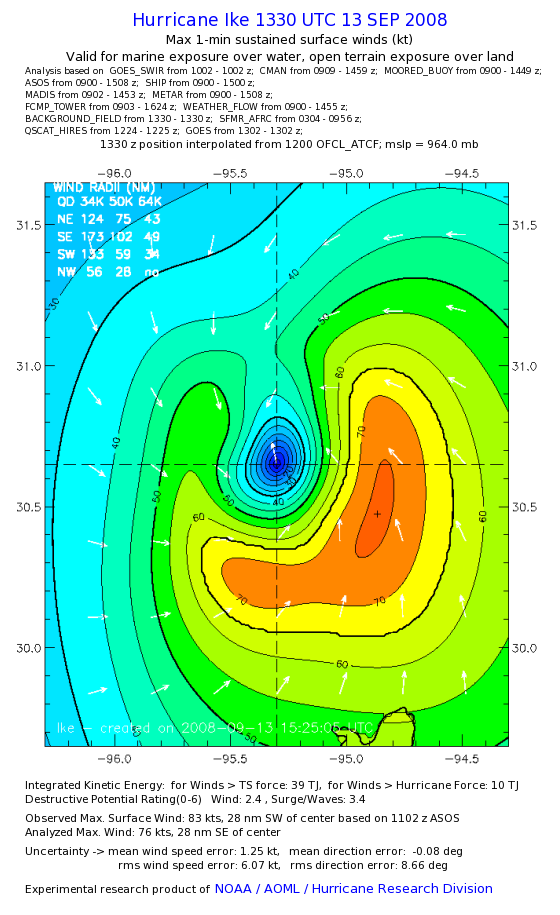
Wind analyses performed by the Hurricane Research Division (HRD) of Hurricane Ike provide the best way to visualize the wind fields. The wind analyses are computer generated by HRD using observations from many sources that not only include buoy, oil platform, ship and airport observations but also data from reconnaissance flights, some radar data, and satellite data. Please see HRD's background discussion for more information on how the analyses are made. These analyses are useful because they are consistent with the National Hurricane Center's determination of maximum sustained winds using a one minute average.
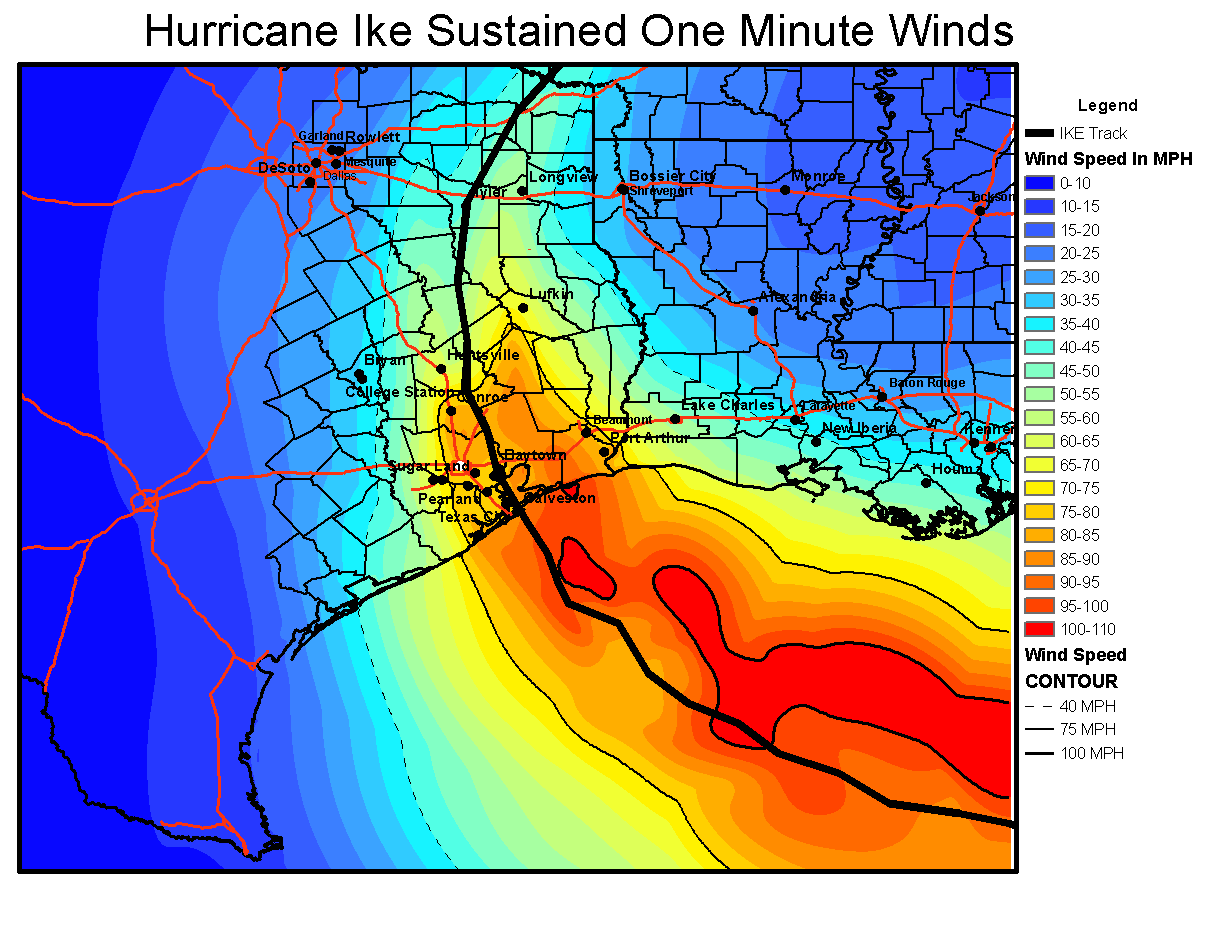
The HRD has a PDF file of the wind swath (knots) from Hurricane Ike (MPH version). Hurricane Ike had a large wind field covering a broad area of southeast Texas. Tropical storm force winds extended from Palacios, TX to east of Lake Charles, LA. Tropical storm force winds moved inland as far north as Longview, TX. Hurricane force winds were felt mainly from along the coast of Freeport, TX to Sabine Pass, TX including Beaumont, TX. Hurricane force winds extended inland to include the Houston metro area and as far north as Livingston, TX and even Lufkin, TX. The Harris County Appraisal District was able to overaly the wind swath in MPH over a county map to give a better idea of the wind field distribution. NWS Lake Charles developed a broader view of Ike's wind swath. While the wind swath map provides a good understanding of how strong the winds were as Ike moved across southeast Texas, it lacks the ability to provide any information about the structure of Ike and the longevity of the winds.
Even though winds approached 80 knots (95 mph) in some areas as Ike move inland, hurricane force winds persisted for a long time as well. Bush Intercontinental Airport reported tropical storm force winds beginning at midnight on Saturday 13 September and ended when the observation failed at 5AM CDT. These winds most likely persisted longer than 5 hours as the southern eye wall of Ike had yet to pass through the area as seen by radar. According to HRD wind analyses from 0430 UTC 13 September (1130PM CDT, 12 September) through 1330 UTC 13 September, it is possible that tropical storm force winds affected most of southeast Texas for as much as 9 hours or longer. Hurricane force winds east of the eye of Ike could have affected portions of east Texas just as long.
b. Wind Analysis Compared to Doppler Velocities
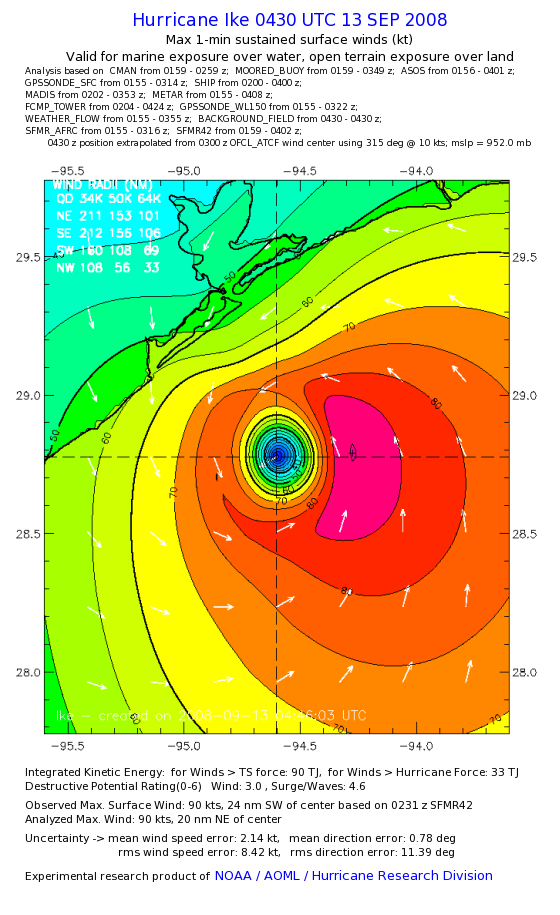
The wind analyses from HRD provide rough information about the structure of Hurricane Ike in regards to its wind fields.Figure 1 shows the wind analysis of Ike at 0430 UTC 13 September (1130PM CDT, 12 September). Ike is still in the Gulf of Mexico. The strongest band of winds stretches across the NE quadrant to the SE and SW quadrants of the storm. Interesting to note is that stronger winds exist in the southern part of the eye when compared to the northern part of the storm. This indicates that Hurricane Ike was possibly stronger over the southern portion of the storm versus the northern part of the storm. The analysis at this time indicates maximum winds of 85 knots or 98 mph which is the low end of Category 2 on the Saffir-Simpson Scale. This wind maximum was located mainly on the east side of the hurricane.
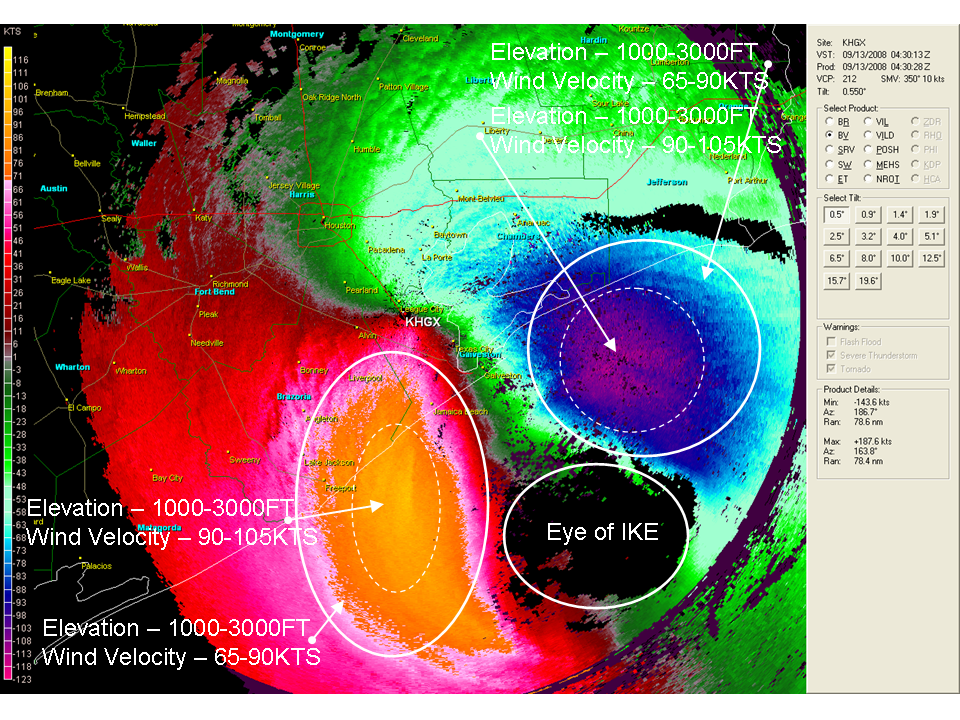
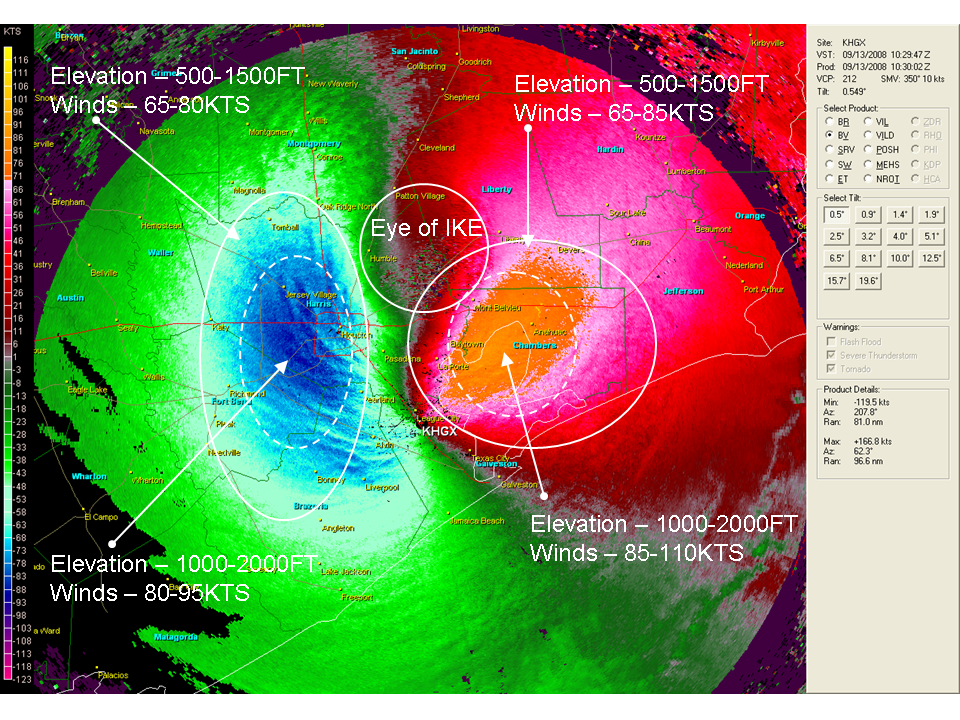
Doppler velocity data from the NWS Houston/Galveston WSR-88D is consistent with the analysis as well. The velocity data of Ike mainly resolves the northern and western parts of Ike as the southeast quadrant is out of the radar's range. As figure 2 shows, there is a band of winds around 90 to 105 knots (105-120 mph) in this part of the storm. At first glance, this seems to indicate much stronger winds in Hurricane Ike than the analysis shows. This is mainly due to the radar sampling winds about 1000 to 3000 feet above ground level since the radar beam bends upward with distance from the radar. This means that a reduction factor needs to be applied to these winds to get an estimate of the surface winds in these areas. Based on studies by the National Hurricane Center, a 30% reduction will be applied in line with table 1 from NHC's discussion. The NHC discussion also indicates that the hurricane's strongest winds are typically strongest at elevations of 1000 to 2000 feet. This should give a good indication of the maximum winds in these parts of the hurricane. Applying the reduction yields winds at the surface of 63-74 knots (73-85 mph) in the western and northern parts of Ike at this time. The values seem to match well with HRD's analysis at this time, but may be a little less than the wind analysis near the western and northern eye wall of Ike.
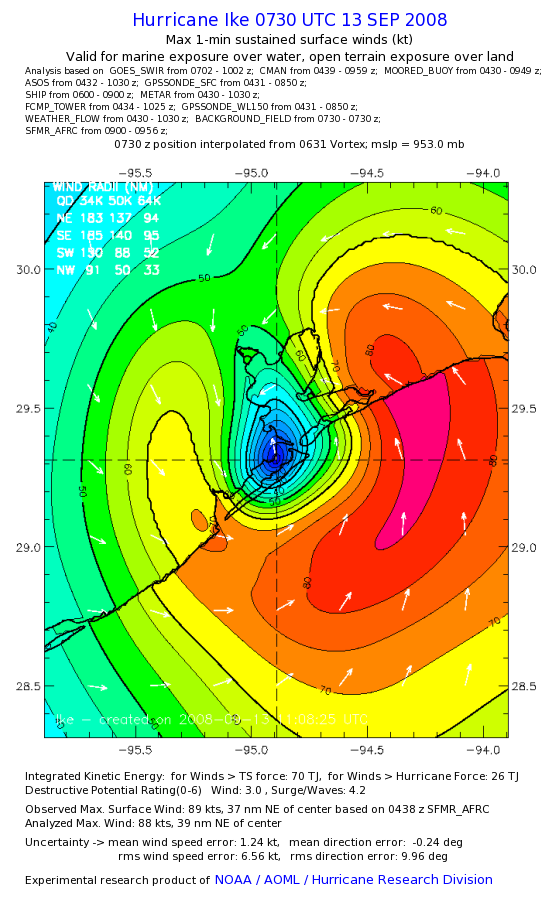
Moving ahead three hours to 0730 UTC (230AM CDT) 13 September, Hurricane Ike has made landfall and moving through Galveston Bay. The HRD analysis in figure 3 again shows much stronger wind fields through the NE to SE to SW quadrants than on the northern and NW quadrant. Much of east Texas felt the brunt of hurricane force winds with the east side of the storm moving through Chambers and Jefferson Counties at landfall. Maximum winds on the east side of the storm were between 80 to 85 knots (92-98 mph). Based on this, Ike neither strengthened nor weakened in the three hours prior to landfall. Figure 4 shows the velocity data from the radar at this time. The radar velocities are significantly lower than the wind analysis. While this seems to indicate that Ike weakened, it actually did not. The velocity data is distorted due to the eye of the storm passing over the radar at the time. This means that particles in the hurricane are circulating around the radar as the radar moves around. More of the radar beam becomes perpendicular to the storm leading to a zero velocity or the radar underestimating velocities.
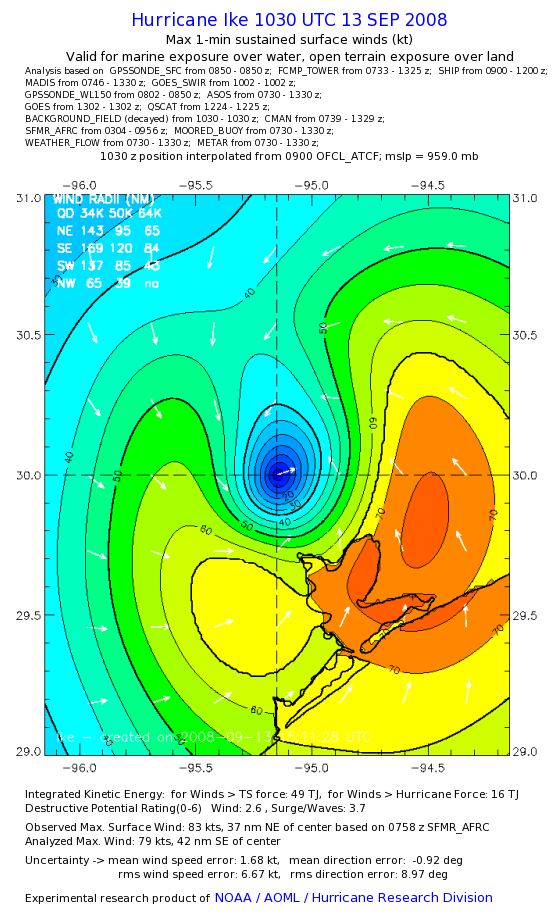
Advancing ahead another 3 hours to 1030 UTC (530AM CDT) 13 September, Hurricane Ike continued to push north and begin to weaken. Even though the maximum winds have decreased to 70 to 75 knots (80-85 mph), hurricane force winds still cover much of Galveston Bay and Chambers County through the southern part of Hurricane Ike (figure 5). This again shows that Ike had stronger winds in the southern part of its core than the northern half. Hurricane force winds of greater than 65 knots (75 mph) affected a large portion of southeast Texas that included the Houston/Galveston area as well as points off to the northeast. Also note that these hurricane force winds continue 6 hours after tropical storm force winds began affecting the coast in figure 1 at 0430 UTC. While the wind speeds may be at a Category 1 level on the Saffir-Simpson Scale, these winds persisted for a several hours which would contribute to more extensive wind damage across the region than if Ike was moving faster or had a smaller wind field.
Doppler radar velocities at the same time again provide support for the wind analysis by the HRD. Figure 6 shows the higher velocities over much of Galveston Bay and Chambers County as well as higher winds over much of Harris, Fort Bend and Galveston Counties. This includes the Houston downtown area where several high rise buildings had damage with windows broken. Since Ike moved away from the radar, the radar was able to better sample the velocities in the hurricane. The radar was able to resolve velocities near 110 knots mainly over Galveston Bay and Chambers County. Applying the reduction to the radar velocities yields winds of 77 knots (88 mph) at the surface. This again is well within the range or slightly higher than the HRD wind analysis in figure 5. This also supports the idea that the winds in the southern half of Hurricane Ike were stronger than the northern half.
Finally at 1330 UTC (830AM CDT) 13 September, figure 7 shows Ike moving more to the north with hurricane force winds shrinking, but remaining in place over the southern and eastern halves of the hurricane. Tropical storm force winds are beginning to decrease along the coast where these winds have been in place for 9 hours or more. This further illustrates that in this case it was not so much the intensity of the winds, but the longevity of the winds which contribute to extensive wind damage across southeast Texas.
c. Wind Observations from Research Organizations
A few hurricane research organizations had set up mobile observing stations across Southeast Texas to measure winds from Hurricane Ike. These included the Texas Tech Hurricane Research Team (TTHRT), the Center for Severe Weather Research (who run the Doppler on Wheels), the Florida Coastal Monitoring Program (FCMP) and hurricane research, and a few other smaller groups. The Texas Tech HRT placed several anemometers across the area including locations on Galveston Island and through Chambers County. Please see TTHRT's Hurricane Ike webpage for more information. The anemometers are at a height of 2.25 meters instead of 10 meters for official wind observations. This means that the winds speeds may be less than winds at the 10 meter height. The wind measurements are also one-minute means with a 3 second gust. Sensor 110A positioned at Fort Travis on Bolivar Peninsula measured maximum sustained winds of 73 mph with a maximum gust of 87 mph. Sensor 104B located in north central Chambers County measured maximum sustained winds of 79 mph with a maximum gust of 96 mph. Just a few miles north of 104B, sensor 216B measured maximum sustained winds of 74 mph with a maximum gust of almost 109 mph. These anemometers were located mainly in the eye of Hurricane Ike or just east of the eye where the strongest winds would be located. This means that the winds from Ike would not have had as much of a chance to weaken as it moves inland.
Overall, these observations are consistent with the HRD analysis, but perhaps the winds speeds are slightly lower than the HRD analysis. The HRD wind swath map shows a band of winds greater than 90 mph stretching into most of Chambers County. FCMP's T5 sensor has winds close to this estimate but still lower than the analysis. TTHRT's winds at 104B and 216B were still another good 10 to 15 mph less than the HRD analysis, but again, TTHRT's winds are not at the 10 meter height.
4. Tornadoes
Tornado activity associated with Hurricane Ike was confined to mainly areas east and northeast of Southeast Texas over western portions of Louisiana. Outer rain bands that typically spawn tornadoes occurred mostly over western Louisiana which limited tornado activity to these areas. The reflectivity data from the NWS Houston/Galveston radar showed that Hurricane Ike had several small vortices within its eye wall structure. Velocity data and storm relative velocity maps did not indicate any strong areas of rotation within these vortices. It is possible that as Hurricane Ike made landfall that these vortices did produce brief tornadoes that were too small and weak for the radar to detect rotation. The NWS Houston/Galveston did not issue any tornado warnings until 446PM CDT 13 September 2008 as a line of storms was moving through Liberty County associated with a front wrapping around Hurricane Ike. There were no tornadoes reported with the storms. This came about 12 to 15 hours after Ike made landfall.
While the NWS Houston/Galveston received public reports of brief tornadoes during Ike weeks later, there was no way to confirm these reports. Ike caused extensive wind damage across southeast Texas which would mask any tornado damage. One would not be able to distinguish between hurricane wind damage and tornado damage. In summary, while there may have been brief tornadic circulations, radar data and storm damage could not confirm that Hurricane Ike caused any tornadoes in Southeast Texas.
5. Conclusions
The focus of this study was to investigate intensity of the wind fields as Hurricane Ike moved inland. The NHC with its recon data had maximum sustained winds of 95 knots (110 mph) as Ike made landfall. These kinds of winds were certainly possible, but given the HRD wind analyses, velocity data from the NWS Houston/Galveston radar, and wind data from various research groups, sustained winds of 75 to 85 knots (85-100 mph) were more likely across southeast Texas. The wind analyses and velocity data also showed that Hurricane Ike was structured such that the southern half of the hurricane had more intense winds than the northern half. The strongest winds were still in the northeast quadrant which is very typical for a northward moving hurricane. The wind analyses also gave a good estimate of the longevity of the tropical storm and hurricane force winds. These winds persisted for at least 9 hours for most areas near the center of the hurricane. This was mainly due to the fact that Hurricane Ike had a large circulation center and an expansive wind field well east of the storm. More than likely, it was the longevity of the winds that contributed to the extensive damage across southeast Texas, more so than the intensity of the winds. The extensive damage from Ike's winds also masked any tornado damage. It is inconclusive as to whether Ike was responsible for any tornadoes across Southeast Texas.
6. References
7. Figures
| Figure 1 | Figure 2 |
 |
 |
| Figure 3 | Figure 4 |
 |
 |
| Figure 5 | Figure 6 |
 |
 |
| Figure 7 | |
 |
|


 Follow us on YouTube