|
Radar Data
This National Weather Service radar image from 6:02pm shows a rotating supercell thunderstorm moving into the Mount Hope tornado. This radar image shows the storm just before the tornado touched down. The base reflectivity product in the left panel, which shows rainfall intensity, shows a classic supercell thunderstorm. The storm relative velocity product in the right panel shows winds toward (in green) and away (in red) from the radar at Columbus Air Force Base, MS.
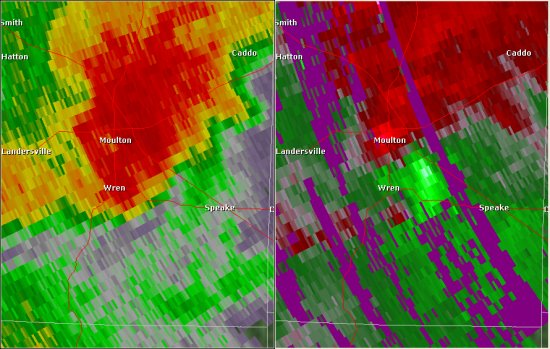
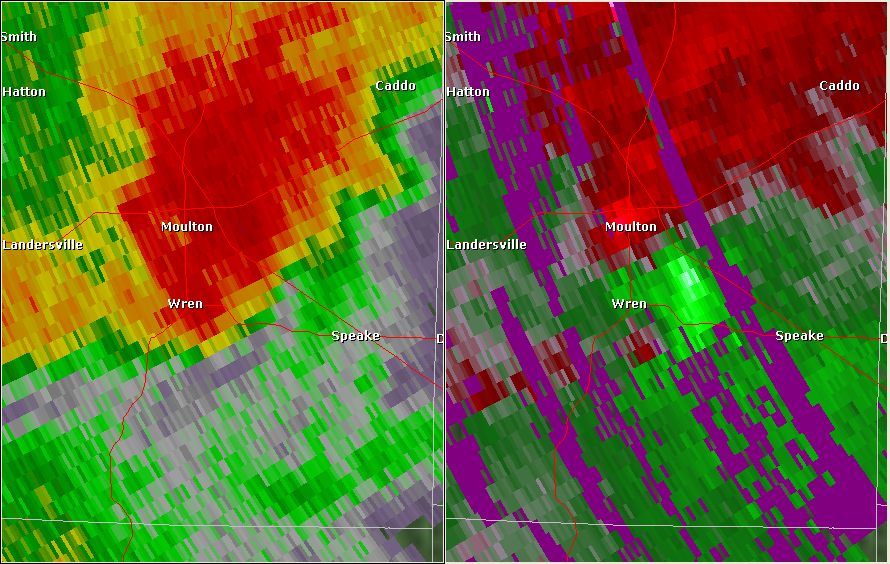
This National Weather Service radar image from 6:23pm shows an area of strong rotation just southeast of Moulton. The base reflectivity product in the left panel shows rainfall intensity. The storm relative velocity product in the right panel shows winds toward (in green) and away (in red) from the radar at Hytop.
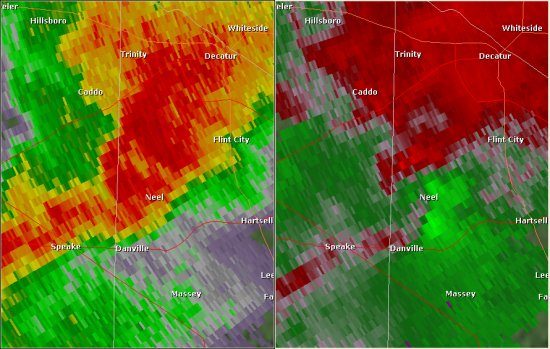
This National Weather Service radar image from 6:42pm shows rotation north and west of Neel around Punkin Center. The base reflectivity product in the left panel, which shows rainfall intensity, shows a Bounded Weak Echo Region (BWER), or an area of lower reflectivity values entirely surrounded by high reflectivity values. This is indicative of rotation and the presence of a mesocyclone in the storm. The storm relative velocity product in the right panel shows winds toward (in green) and away (in red) from the radar at Hytop.
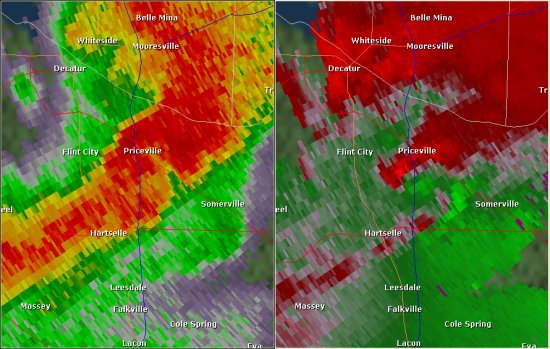
This National Weather Service radar image from 7:01pm shows rotation south of Priceville over I-65. The base reflectivity product in the left panel shows rainfall intensity. The storm relative velocity product in the right panel shows winds toward (in green) and away (in red) from the radar at Hytop.
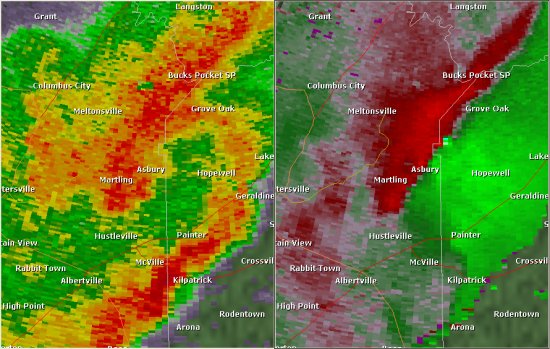
This National Weather Service radar image from 8:40pm shows a broad area of circulation along the Marshall/DeKalb County border. There were also smaller scale circulations embedded in this larger-scale circulation. The base reflectivity product in the left panel shows rainfall intensity. The storm relative velocity product in the right panel shows winds toward (in green) and away (in red) from the radar at Hytop.
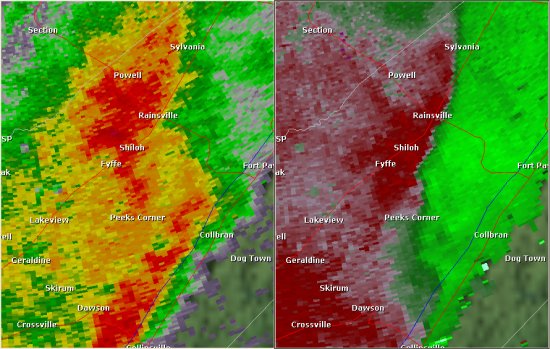
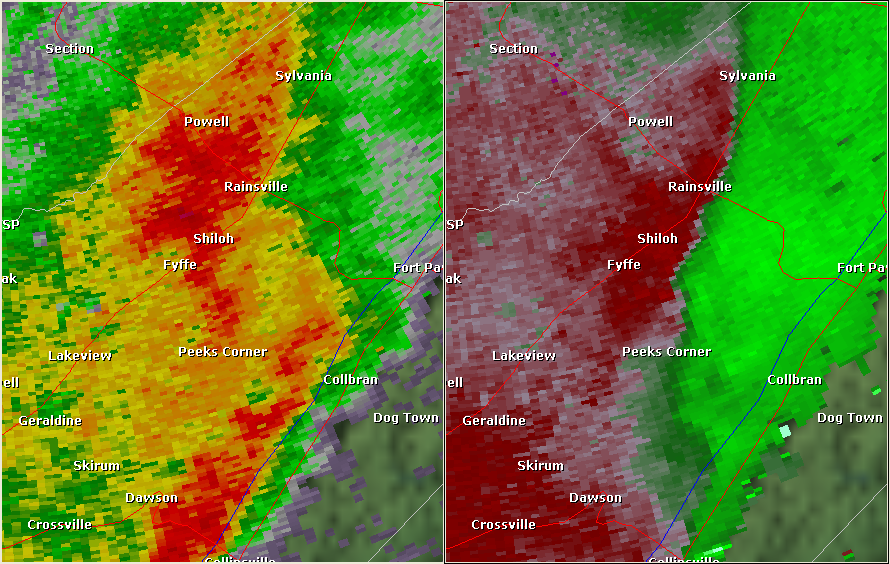
This National Weather Service radar image from 9:03pm shows an area of rotation east of Fyffe near the Guest community. The base reflectivity product in the left panel shows rainfall intensity. The storm relative velocity product in the right panel shows winds toward (in green) and away (in red) from the radar at Hytop.
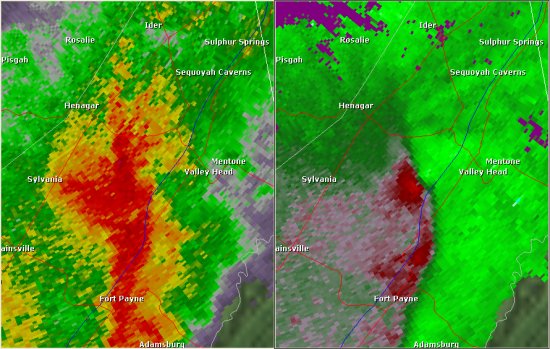
This National Weather Service radar image from 9:17pm shows a velocity couplet west of Hammondville near the eastern extent of Sand Mountain. The base reflectivity product in the left panel shows rainfall intensity. The storm relative velocity product in the right panel shows winds toward (in green) and away (in red) from the radar at Hytop.
|


 Local Radar
 Weather Map
 Follow us on YouTube