| Historical Kansas Tornado Statistics 1950-2009 |
Every seasoned Kansan knows that we live in the heart of tornado alley. In fact, the Heartland of America boasts one of the most active regions in the world tornado-wise. But when are the peak Kansas tornado days each year? How many Kansas tornadoes have occurred each year since official tornado records began in 1950? What time of the day is historically the most active tornado-wise? What is a tornado-day? Finally, how does Kansas rank nationwide regarding tornado numbers? The following graphs will attempt to answer these questions.
All charts were compiled using the Storm Prediction Center's (SPC) severe weather database, with minor supplements from the National Climatic Data Center (NCDC) severe weather database. These were very large and extensive databases. Consequently, as is often the case with such large databases, sporadic relatively minor discrepancies and/or errors are essentially inevitable. However, any such errors/discrepancies are relatively minor enough to suffice for this report.
|
|
|
The above-left graph is annual Kansas tornadoes 1950-2009, along with a 5-year moving average. According to National Weather Service records, the most tornadoes occurred in 2008, when over 180 tornadoes ravaged the Sunflower State. 2009 recorded about 100 tornadoes statewide, a shade under the 5-year moving average. The graph indicates that the average annual Kansas tornado count has been increasing since roughly the late 80s. However, this is likely due to increased tornado awareness and education, as well as a denser spotter network, which in turn produces more tornado reports sent to the National Weather Service. Another possible explanation is the implementation of the Next Generation Weather Radar network during the early 90s, which aided meteorologists in tornado identification per radar.
The above-right graph is annual Kansas EF3 or greater tornadoes 1950-2009. Some of the more notable years include: 1956, 1991 and 2008. Since 1950, there has been only 7 years that Kansas did not record an EF3 or greater tornado. Those years include: 1963, 1979, 1987, 1988, 1994, 1997 and 2006.
|
|
|
Daily Kansas tornado frequency 1950-2009 (above-left). As the graph indicates, mid to late April through mid June historically has the highest tornado frequency, with the peak occurring around May 22nd-23rd with over 160 tornadoes occurring over that two day period since 1950. Notice the sharp drop-off by mid to late June. This is due to the jet stream (storm track) and associated strong vertical wind shear shifting north, affecting mainly the northern tier of the country through the rest of the summer. This effectively shuts down the Kansas "tornado machine", as the hot, "dog-days" of summer set in. Notice the secondary minor peak in tornado activity October-November, when the onset of winter battles with the relatively mild fall airmass still in place across the region.
Above-right graph illustrates daily Kansas EF3 or greater tornado frequency 1950-2009. As the graph indicates, the peak strong/violent tornado frequency occurs a bit earlier than the overall tornado peak, occurring late April into early May, when vertical wind shear within Kansas storm systems is traditionally a bit stronger than in late May-early June.
|
|
|
Above-left graph illustrates tornadoes per state per 100 square miles from since 1950. Kansas is ranked 3rd at 4.4 tornadoes per 100 square miles behind only Oklahoma and Florida. This graph is meant to represent the tornado density per state since 1950. For a proper perspective, 100 square miles is roughly a bit smaller than the city of Wichita. This means that if you assume the average Kansas county has an area of roughly 1000 square miles, then each Kansas county has averaged roughly 30-50 tornadoes since 1950.
Above-right graph illustrates EF3 or greater tornadoes per state per 1000 square miles since 1950. Kansas is ranked 8th, at 2.5 EF3 or greater tornadoes per 1000 square miles behind Iowa, Tennessee, Alabama, Mississippi, Indiana, Oklahoma and Arkansas. EF3-EF5 tornadoes represent strong to violent tornadoes, so this graph represents the violent tornado density per state since 1950. For a proper perspective, 1000 square miles is roughly a tad bigger than Sedgwick County. This means that each Kansas county has experienced roughly 1-3 strong/violent tornadoes since 1950, assuming the area of each Kansas county is roughly 1000 square miles.
|
|
|
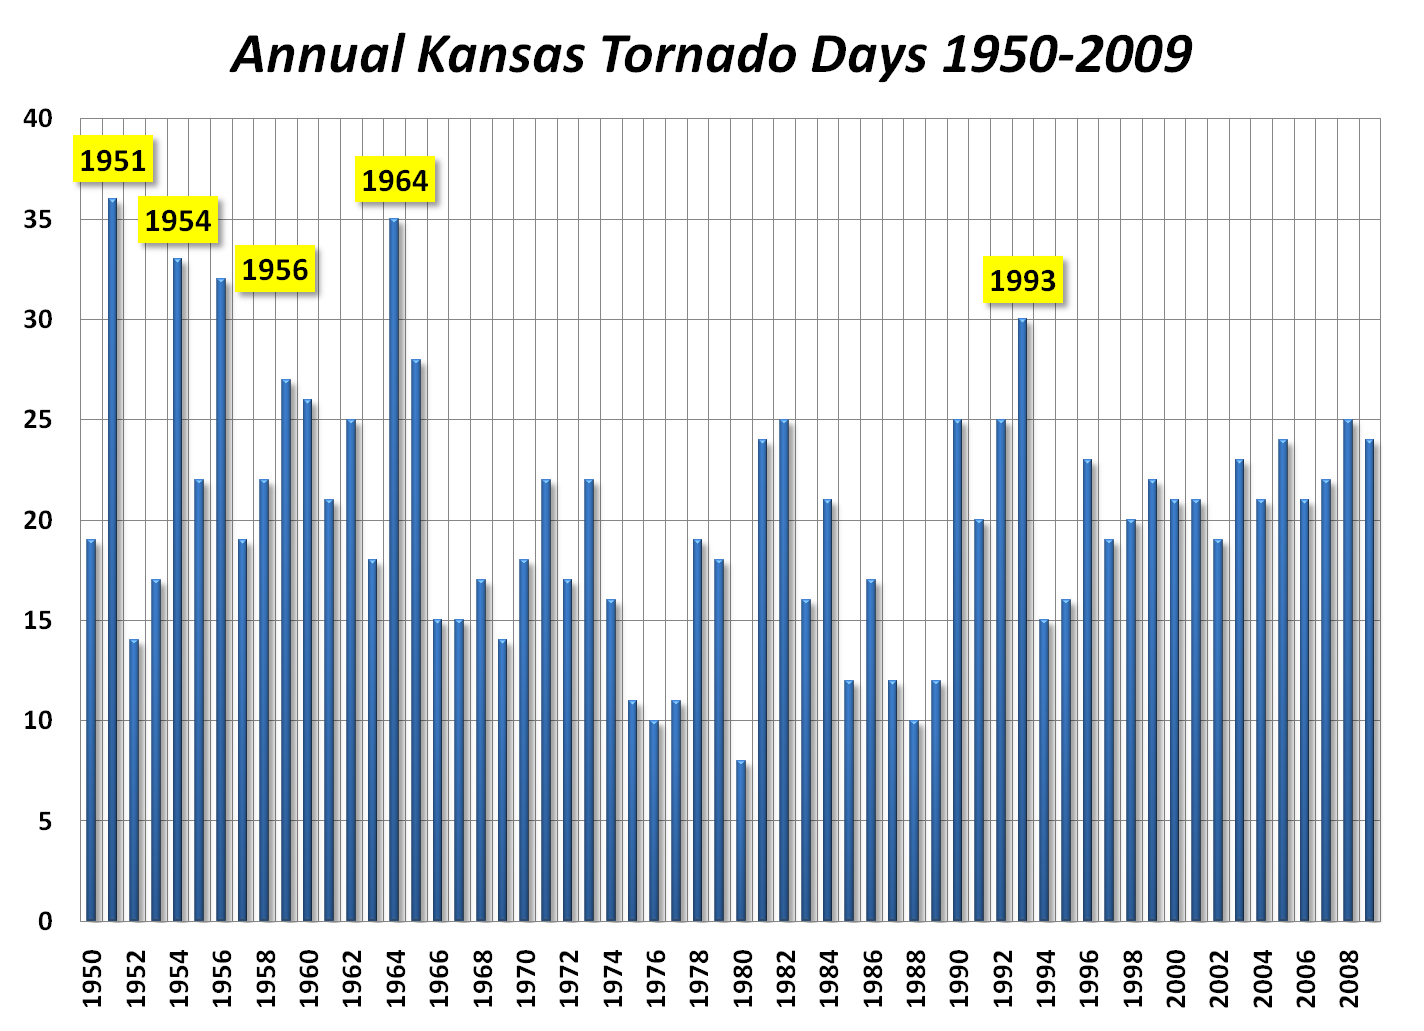
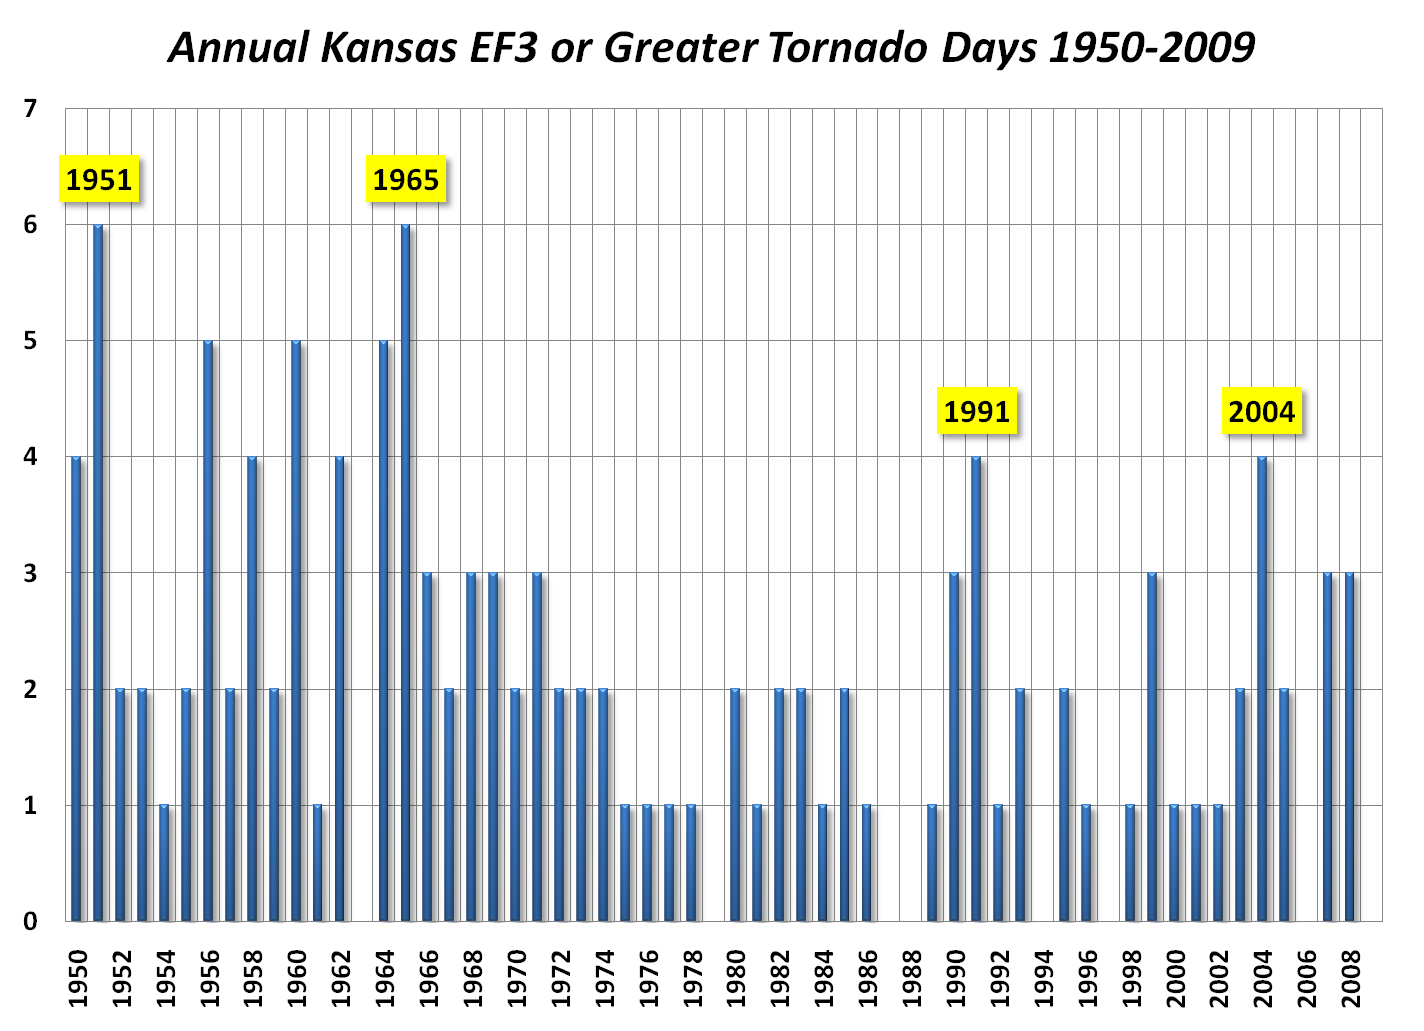
The above-left graph illustrates annual Kansas tornado days since 1950, while the above-right graph illustrates annual Kansas EF3 or greater tornado days since 1950. The more notable years are highlighted in yellow. These graphs count each day a tornado (EF3 or greater tornado above-right graph) occurred within Kansas since 1950. Tornado days are generally considered a better measure of tornado trends over time than tornado occurances due to the increased reporting of tornadoes since the 1980s-90s (refer to the left graph at the very top of this report).
|
|
The above graph illustrates hourly Kansas tornado frequency since 1950. The peak hours are historically between 4-8 pm. Even though the highest sun angle each day occurs between noon-2 pm, peak afternoon heating does not occur until around 4-5 pm. The afternoon heat in concert with ample low-level moisture (humidity) and vertical wind shear (increasing wind speed/direction with height) provides the fuel necessary for tornado-producing thunderstorms to form. The most unlikely time of day for a tornado to occur is historically between 7-8 am CST. Only two tornadoes have been reported during that hour since 1950.


.png)
.png)

 Follow us on YouTube