A gravity wave is a meteorological phenomenon where strong winds of one to two hours' duration occur along with a rapid fall and rise in surface pressure. Gravity waves usually form along the back edge of a large area of precipitation followed by rapid drying in the middle layers of the atmosphere (Figure A). There is a net upward motion in the area of rainfall followed by a net downward motion in the dry air behind. This produces a small pressure disturbance at the surface (Figure B). The pressure disturbance is allowed to grow due to the presence of a layer of stable air anywhere from 5,000 to 12,000 ft above the ground. This stable layer maintains and "ducts" the now-growing pressure wave horizontally along the earth's surface instead of allowing it to disperse up and outward through the depth of the atmosphere (Figure C). Gravity waves are more common during the cooler months of the year as stable temperature inversions aloft are more prevalent.
The amplitude of a gravity wave is determined by how much the pressure falls as the wave moves through. Several gravity waves in recent years have been measured with three to four millibar (0.09 to 0.12 inches of mercury) amplitudes in the Eastern Carolinas: April 19, 2004 and January 19, 2006 are good examples. These two gravity wave events produced wind gusts of 35 to 45 mph.
The gravity wave of October 25, 2008 had an eight millibar (0.24 inches of mercury) amplitude and produced wind gusts measured as high as 62 mph at Wrightsville Beach. Some gravity waves in other parts of the country have produced amplitudes as high as 15 millibars and wind gusts well over hurricane force.
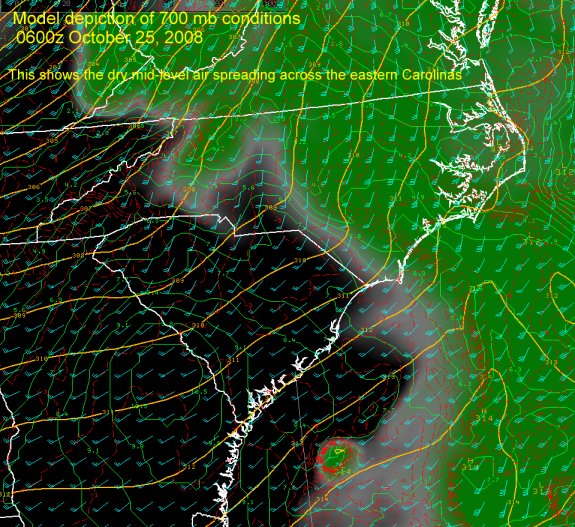 Figure A |
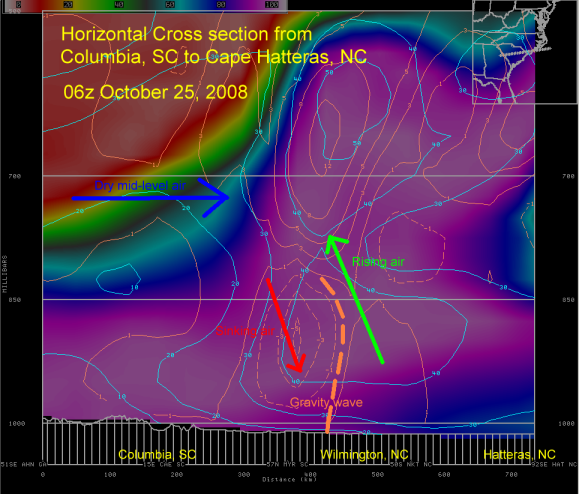 Figure B |
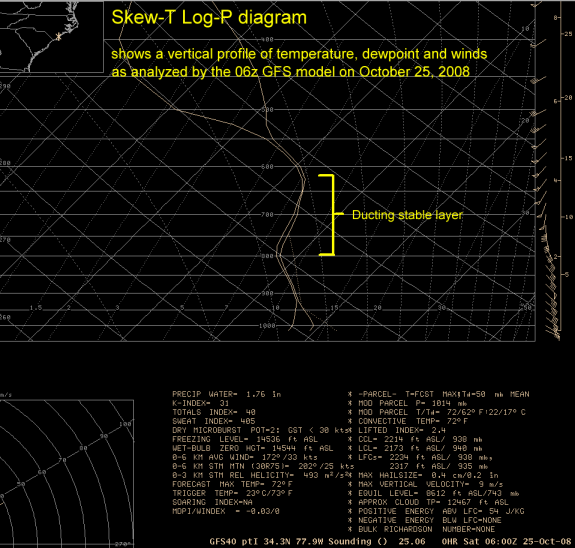 Figure C |
|
Below is a radar loop of radial velocity from the KLTX radar in Shallotte, NC. You can find the exact location of the radar by looking for the black hole across southwestern Brunswick County. As the radar beam goes out into the sky, due to the angle off of the ground, it misses targets directly around the radar location itself. This area that is not "seen" by the radar is better known as the cone of silence.
Now that you know where the radar is located we can go more in depth on how this image helps us detect strong winds above the surface. The red colors on this image are winds blowing away from the radar site. Looking at the scale at the top, the brighter red colors indicate a stronger wind speed. The other main color on this image is green and this indicates winds toward the radar. Much like with the red color, the brighter shades of green represent stronger winds.
As this image animates notice the bright red and pink shading across western Horry and western Columbus counties. We circled this area in yellow for you. The radar is indicating that in this area, winds between 1,000 and 3,000 feet above the surface are blowing 60 knots (69 mph) or greater. Now, all of this wind did not make it down to the surface but we did see wind gusts between 45 and 60 mph. This gives you an idea of how radar imagery can help us detect and track strong winds above the surface. In this case, these strong winds were caused by a gravity wave.


 Coastal Flood
  Follow us on YouTube