|
JANUARY
The New Year started warm with a highs in the upper 70s across the region. Many areas recorded low temperatures in the low 60s which broke the record for highest minimum temperatures at all of our major climate sites. Daytime highs continued to run above normal through January 9th. This included 3 days with highs greater than 70 degrees and thunderstorms on January 4th. A cold front broke this streak of above-average temperatures with highs in the 40s for 5 of the next 6 days and overnight lows dipping into the upper 20s. After a continued stretch of slightly above normal temperatures, a strong mid-latitude cyclone developed on the morning of January 19th bringing severe weather to the Southeast US. A total of 10 tornadoes were confirmed in Louisiana, Mississippi, Alabama, and Florida; this included an EF-2 tornado that hit the town of Wetumpka, Alabama. The cold front associated with this storm system passed our area and highs the following day struggled to climb into the upper 30s. This was the coldest air of the month across the area averaging more than 20 degrees below normal. Another, weaker, storm system brought significant rainfall to our area on January 24th with most areas collecting between 1-2 inches with an area high of 1.92 inches near Castle Hayne, NC.
FEBRUARY
|
Strong low pressure off the North Carolina coast had a beautiful swirl when viewed from a weather satellite's perspective on Feb 4, 2019 |
February was very dry across the Carolinas. At Wilmington, NC, only 1.00 inches of rain fell which was the 6th driest February on record. Similar statistics were observed in Myrtle Beach where only 1.26 inches of rain fell making it the 6th driest February since records began in 1932 and again in Florence, SC where 1.63 inches of rain had fallen (the 16th driest Feb. on record). In Georgetown, SC a local Co-Op observer reported only 0.95 inches of rainfall for the entire month of February.
On February 3, 2019, a coastal low developed off of the Carolina coast. Some areas along the coast received around a tenth to a quarter of an inch of rainfall during the night of February 3rd. Despite the lack of rainfall, this storm gave us a good look at how storms develop when cold, dry air from the North American continent meets the warm, moist air carried by the Gulf Stream. The GIF on the right is taken from GOES-16 Visible Satellite Imagery and shows the strong low pressure system thriving over the warm waters of the Gulf.
MARCH
The month of March began with a cold front that brought thunderstorms to the area. One storm prompted a severe thunderstorm warning just outside of Hartsville, SC. No significant damage was reported outside of a few small limbs and tossed lawn furniture in Kellytown, SC. Behind the front, cold air moved in prompting a weak storm system to develop just off of the Carolina coastline. There was enough cold air and moisture to bring wintry weather to the area; the only winter weather event of the season.
|
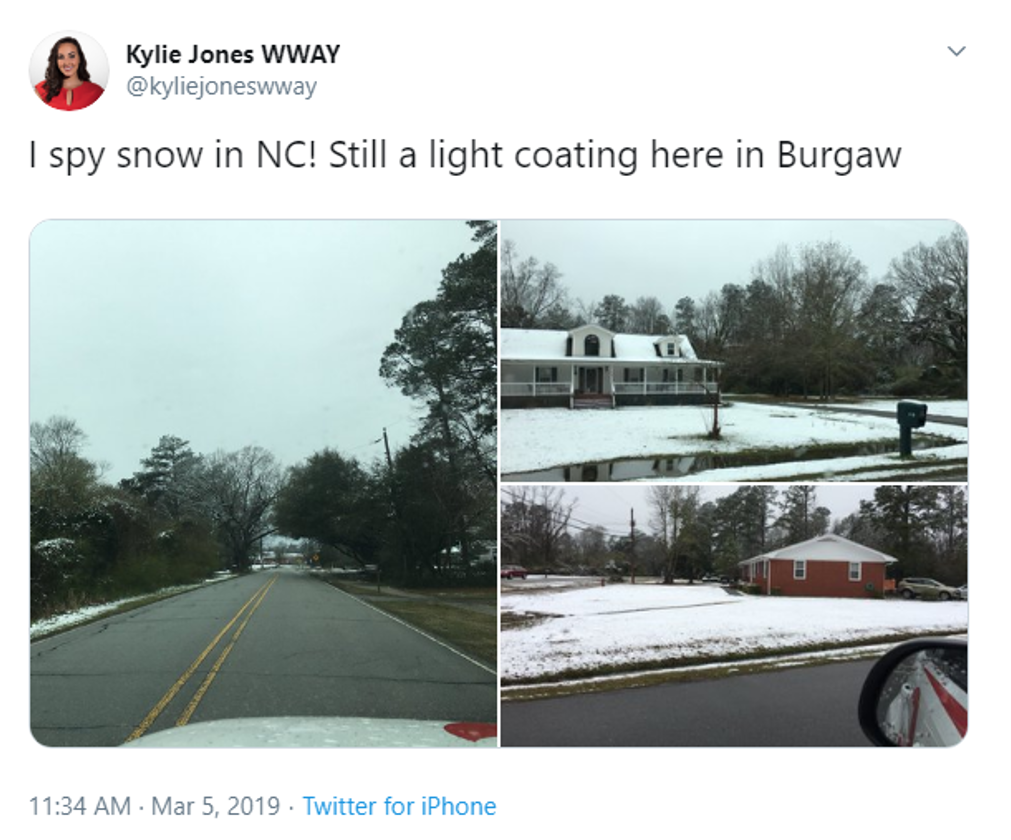
Kylie Jones of WWAY reported a light snow accumulation in Burgaw, NC on the morning of March 5, 2019. |
|
Snow flurries even fell as far south as Florence, SC. While there was no measureable snowfall recorded in Florence on this day, it certainly was a rare sight. |
With rain along the coast, snow flurries fell from areas of northeastern South Carolina to the coastal plain of North Carolina on the morning of March 5, 2019. The snow became heavier as it moved northward into North Carolina. While many areas in southeastern North Carolina received only a trace of snow, there were a few surprising totals where the heavier snow fell. A CoCoRahs observer in Burgaw, NC tallied 1.5 inches of snow. Another CoCoRahs observer northeast of Orrum, NC measured an impressive total of 2.0 inches. This was the highest total in our area with similar reports to the east in Duplin and Onslow counties in North Carolina.
The cold weather was short-lived and within 5 days of seeing snowfall, highs across the area had spring-boarded into the low 80s with an maximum of 85 in the town of Whiteville, NC on March 10th. The remainder of the month continued near average with moderate temperatures and slightly below-normal rainfall.
Be careful out there. It’s a snowy commute in #Burgaw ❄️☃️#Snow #MarchSnow #BurgawWx #BurgawNC#NorthCarolina #ILM #BlueberryCapital #BetterInBurgaw #WeatherTweet#PenderCounty #NCWx pic.twitter.com/z0wXMFDc8n
— Burgaw, NC Weather (@BurgawWx) March 5, 2019
APRIL
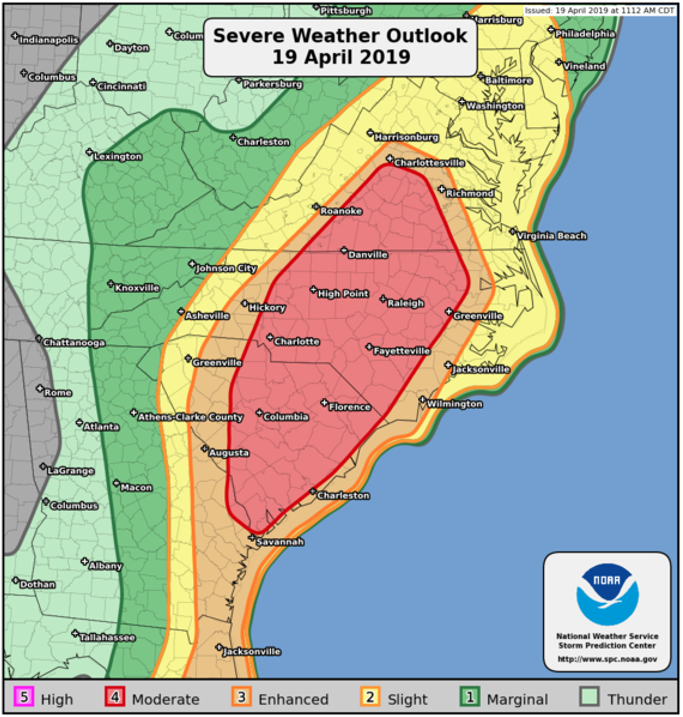
April debuted with temperatures around the normal of 70 degrees. The big weather story of the month was severe weather on April 19th. The Storm Prediction Center in Norman, OK, placed the area under a Moderate risk for severe weather on the morning of the 19th. A cold front brought an elevated risk of severe damaging winds and isolated tornadoes. The line of storms prompted 9 severe thunderstorm warnings, 7 tornado warnings, and led to 28 reports of damage.
|
The Storm Prediction Center in Norman, OK put our area under a Moderate Risk for severe weather on April 19, 2019. |
Damage included numerous trees down across the area along with many downed power lines. One of these reports included a roof blown off of a shed in St. Paul’s, NC suspected to be the result of a tornado. The Myrtle Beach ASOS reported a wind speed of 58 mph and reports of trees down in the area proved to cause quite a lot of damage (picture below). A trained spotter in Quinby, SC reported multiple trees down and a wind gust of 70mph from a home weather station.
|
Damage from the storms in Myrtle Beach, SC on April 19th, 2019 shows a large tree branch that fell onto a parked car; no one was injured. Photo was sent to Ed Piotrowski and reported to us via Twitter. |
After the severe weather, temperatures began to climb. Highs in the upper 80s on April 24th were anywhere from 10-15 degrees above normal. Wilmington, NC observed a high of 88 degrees, just 5 below the record of 93 set in 1980. Temperatures eclipsed the 90 degree mark in several locations including Whiteville, NC, Lumberton, NC, Longs, SC, Georgetown, SC, and a high of 92 in Darlington, SC. This was more than 2 weeks before the first 90 degree day is typically observed.
MAY
|
Mean daily temperature (top) and mean temperatures anomaly (bottom) in degrees Fahrenheit for the month of May 2019. The animation shows that temperatures were above normal (warm colors) for the majority of the month with well above normal temperatures at the end of the month. (Courtesy of NOAA Climate Prediction Center in Silver Spring, MD) |
A simple summary for May 2019: hot and dry. Twenty-eight of the 31 days in May had high temperatures above normal in Florence, SC. This included 7 days in which records were broken for high temperatures including a stretch of 4 days between May 28th and May 31st where the new record high temperature was >100 degrees. In Wilmington, 2 days eclipsed the century mark and a total of 6 records for high temperatures were broken. The warmest temperature recorded during this stretch was 103 degrees on May 29th in Longs, SC.
May 2019 was also the 3rd driest May on record in Wilmington and surrounding area with only 0.63 inches during the entire month. This was one year removed from the wettest May on record in 2018, where 14.36 inches of rain fell, breaking the old record by 3+ inches set in 1956. Afternoon thunderstorms kept some areas closer to normal, but most areas struggled to reach even a third of their average rainfall for the month. This caused issues for the agricultural sector, especially in places such as Whiteville, NC, where it rained only twice during the entire month of May.
The calendar year had been dry already with totals in January, March and April slightly below normal. However, the combination of an exceptionally dry February in which only approximately 1 inch of precipitation had fallen and an extremely dry May led to near drought conditions across the area. During the period from January 1st to May 1st, only 10.65 inches of rain fell which was about 4 inches below the average of 14.32 inches. After the lack of rain in May, this led to a calendar-year total of 11.28 inches, the ninth driest since records began in 1871.
JUNE
Dry weather and above normal temperatures continued into June. Typical afternoon thunderstorms were the focus of our meteorologists here in Wilmington. Some of these pop-up afternoon storms became severe. On June 2nd, a severe thunderstorm developed over Leland, NC in Brunswick County. Multiple residents reported 1 inch hail. The thunderstorm tracked eastward where severe winds affected southern New Hanover County. One resident had a large branch fall and severely damage their vehicle.
More organized severe weather developed later in the month on June 20th. The Storm Prediction Center in Norman, OK put the area under an Enhanced Risk for severe weather and a subsequent Severe Thunderstorm Watch later that afternoon. Thunderstorms began developing across the area early in the afternoon and damage became widespread. Most of the areas affected were in Darlington and Florence counties in South Carolina. Some of the reports included trees blocking major highways in Wilkes Crossroads (Darlington County) and in Florence, SC (Florence County). Businesses and residential areas reported signs and power lines down across the city of Florence, SC (pictured). Residents in Mathis Corner, SC reported large trees that fell onto 2 mobile homes. According to Doppler radar, the estimated wind speed was greater than 60 mph with a 59 mph wind gust measured at the Marion County Airport in South Carolina. Thunderstorms weakened as they moved eastward, but a few stronger storms caused trees to be downed in Georgetown, Williamsburg, and Horry counties in South Carolina.
Trees and sign down on Palmetto Street in Florence via Joseph Smith. #scwx pic.twitter.com/ZOTgEeKYkK
— Ed Piotrowski (@EdPiotrowski) June 20, 2019
JULY
A stalled front across the Carolinas helped developed strong to severe thunderstorms early in the month. On July 3, a severe thunderstorm in Wilmington dropped small hail, knocked trees down, and produced one to two feet of flood water on Queen Street near the south end of downtown Wilmington. Storms in the Myrtle Beach area also dropped hail, and lightning struck homes in Brunswick and Horry counties. Additional strong thunderstorms developed the next day on July 4, knocking a tree onto a home in Johnsonville, SC. Lightning also struck and killed a man in Georgetown, SC. Later in the month, a strong thunderstorm produced a recorded wind gust of 50 mph at the airport in Florence, SC.
July was a hot month across the Carolinas with temperatures running one to almost two degrees above normal. Lumberton, NC recorded 100 degree temperatures on both July 2 and 3, but the worst of the heat developed for most areas between July 12 and 23. Wilmington recorded thirteen consecutive days with highs 90+ degrees during that period. In Florence there were 21 consecutive days of 90+ degree heat lasting into early August. Nighttime temperatures were also oppressive with 80-degree lows recorded in Myrtle Beach and Wilmington twice this month.
AUGUST
|
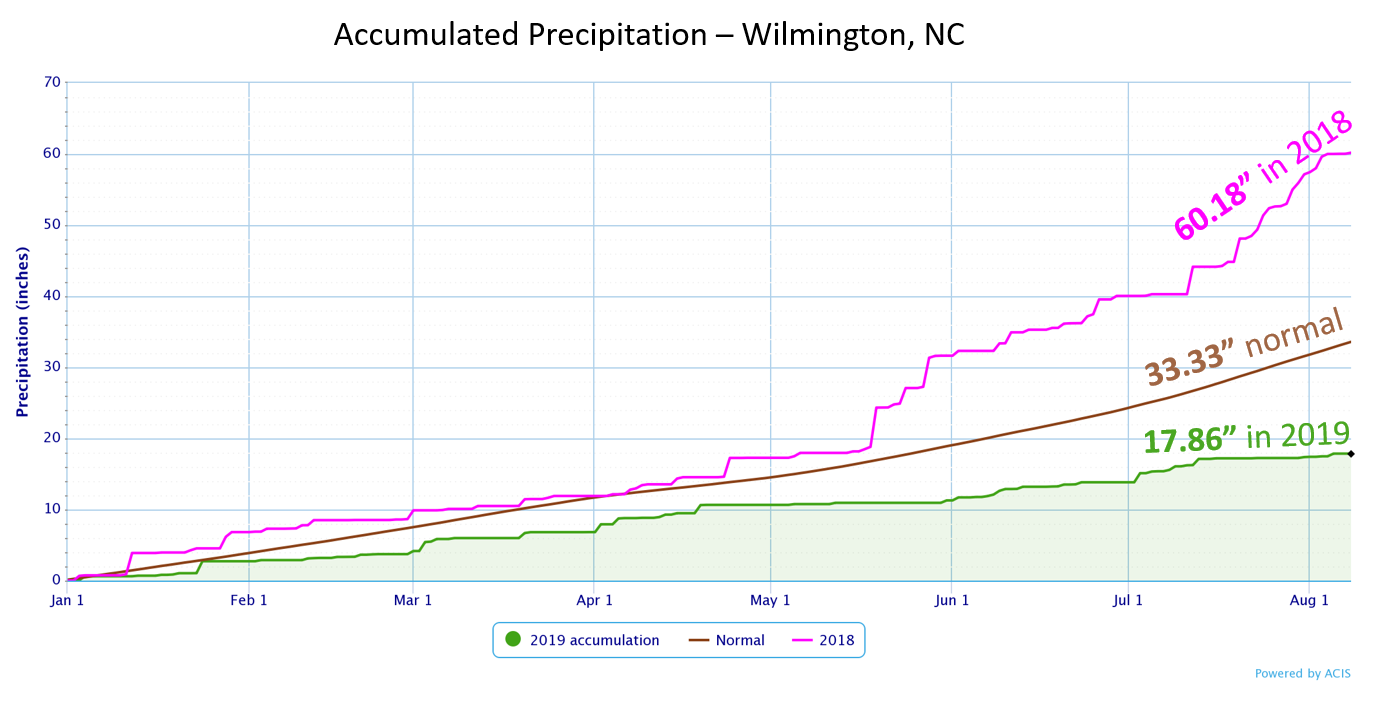
Wilmington's year-to-date rainfall through Aug 7 was the lowest in history |
Above-normal temperatures continued through the first half of August with monthly departures from normal around +1.5 degrees. Intensifying drought conditions across the Cape Fear region reached a point never seen before in Wilmington. Year-to-date rainfall totals in the Port City on August 7 were only 17.86 inches, the lowest ever recorded at this point in the year. Agricultural impacts were locally severe in the Wilmington area, but ground water supply impacts were generally minor due to ample rainfall back in 2018.
On August 15 a cold front advanced southeastward and stalled across central North and South Carolina. This helped bring temperatures back toward normal and brought additional showers and thunderstorms. Wilmington received over 3 inches of rain on August 16. On August 17 even heavier rain occurred in Sunset Beach and Calabash, NC with three volunteer weather stations reporting 5 to 6.5 inches rain.
Waterspouts were observed near Wrightsville Beach and off Oak Island on August 5. On August 7 an EF0 tornado developed near Hampstead in Pender County, NC, damaging trees by the side of U.S. Highway 17.
SEPTEMBER
The biggest weather story of September was Hurricane Dorian's very close brush along the coast of the Carolinas on September 5 and 6. Dorian was a category 5 hurricane when it struck the northern Bahamas September 2. Packing winds estimated to have reached 180 mph, Dorian stalled across Grand Bahama Island and devastated homes and businesses on the island. Thankfully weakening as it moved north, Dorian was packing winds of 90 to 100 mph as it moved across Frying Pan Shoals less than 40 miles from Wilmington. Local impacts from Dorian included significant beach erosion and storm surge flooding from Debordieu Plantation to Pawley's Island, SC, freshwater flooding from heavy rainfall in many locations near the coast, and damage from at least 17 tornadoes that touched down during the morning of September 6. Peak measured wind gusts on land from Dorian were 75 mph at Federal Point and at Fort Fisher (New Hanover County) and 89 mph offshore at the Frying Pan Shoals weather buoy.
|
Infrared satellite loop of Hurricane Dorian moving north from the Bahamas and affecting South and North Carolina. |
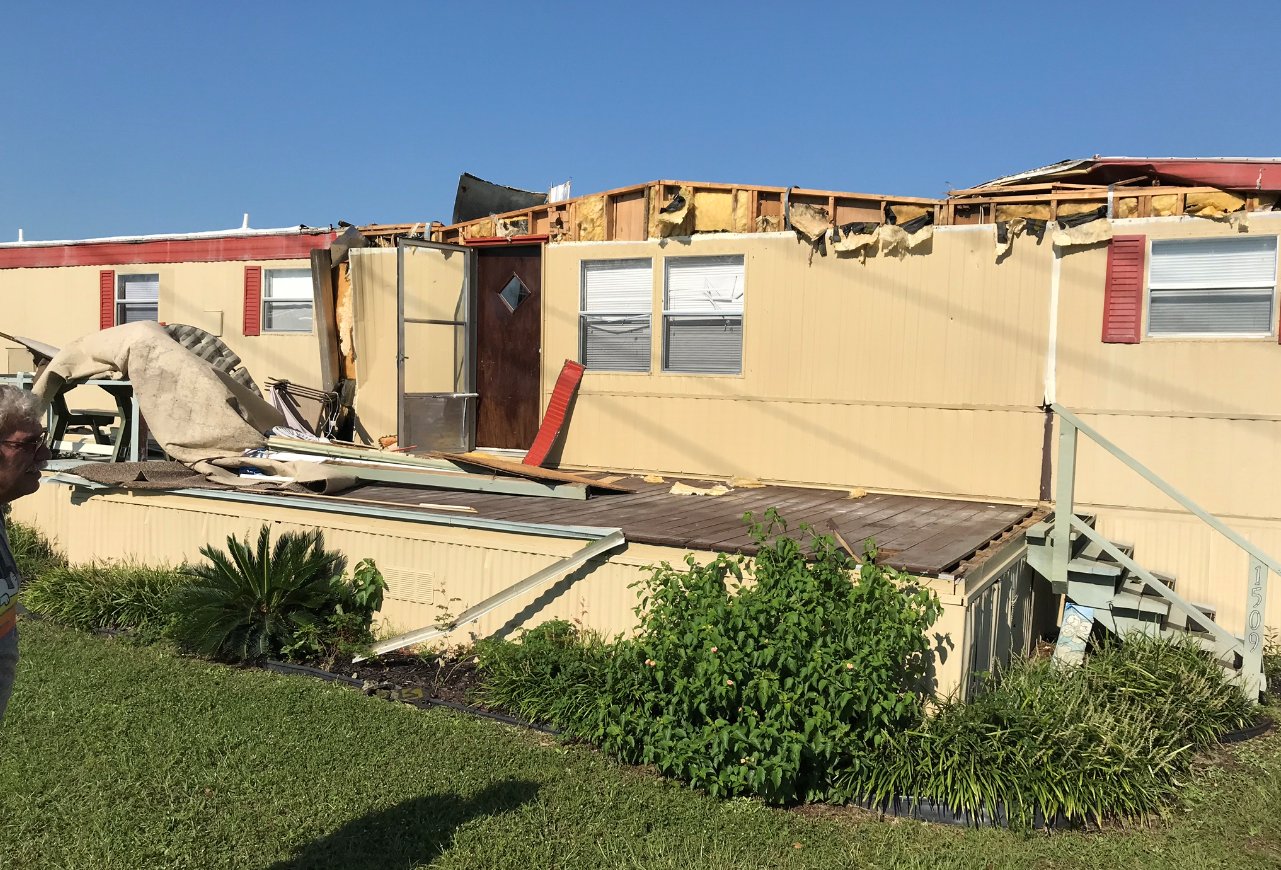
Extensive tornado damage occurred to several dozen homes in The Farms at Brunswick subdivision in Carolina Shores, NC. Winds were estimated to have reached 120 mph. |
Tornado damage occurred to at least eight trailers at the Waterway View Mobile Home Park in North Myrtle Beach, SC. |
Hurricane Humberto remained well offshore but brought higher waves and an increase in rip current activity to the South and North Carolina beaches between September 16 and 20. This was quickly followed by waves from Hurricane Jerry which also remained well offshore. In the eastern Atlantic, category five Hurricane Lorenzo developed late in September and produced large ocean swells that affected most of the Atlantic Ocean. These swells reached the Carolina coastline beginning September 29, causing dangerous rip currents at the beaches.
A cluster of severe thunderstorms developed across southeastern North Carolina during the afternoon of September 9, dropping hail up to one inch in diameter in Wilmington. Strong wind gusts damaged trees and roofs in Wilmington, with additional tree damage reported several miles north of Whiteville. Large hail was also reported in the town of Kelly in Bladen County, NC.
September was the third hottest in recorded history at North Myrtle Beach, the fourth hottest on record in Florence, and the sixth hottest in Wilmington's climate history.
OCTOBER
Extremely warm weather continued throughout most of October. Unseasonably strong Bermuda High Pressure remained anchored off the coast for the first half of the month, contributing to the heat. In Wilmington, high temperatures in the upper 90s on October 3 and 4 broke daily records and established a new all-time record for the month of October with 98 degrees recorded on October 3. Florence's official thermometer reached 99 degrees on both October 3 and 4, also breaking daily high temperature records. Averaged across the month, October was the second hottest in recorded history at Florence, Myrtle Beach, and Wilmington with temperatures 5 to 6 degrees above normal.
On October 4 a cold front moved through the Carolinas, producing northerly wind gusts of 30 to 40 mph near the coast that evening through early in the morning of October 5. This front also cooled the surf water temperature below 80 degrees, signaling the summer beach season was drawing to a close.
Tropical troubles continued in October as Tropical Storm Nestor developed in the Gulf of Mexico and struck the Florida Panhandle on Saturday, October 19. While Nestor lost all tropical characteristics as it moved north across Georgia and into South Carolina. the system still spawned an EF0 tornado in Myrtle Beach early in the morning of October 20. The tornado, with its 85 mph winds, damaged trees and structures along a 0.9 mile path in Myrtle Beach.
NOVEMBER
In contrast with the rest of the year, temperatures throughout November consistently remained below normal. The first freeze occurred on November 9 for most inland sections of the eastern Carolinas, with freezing weather spreading down to the coast during the morning of November 13. The growing season this year (number of days between the last spring freeze and the first fall freeze) was 250 days in Wilmington and Myrtle Beach, 246 days in Florence, and 219 days in Hartsville, SC.
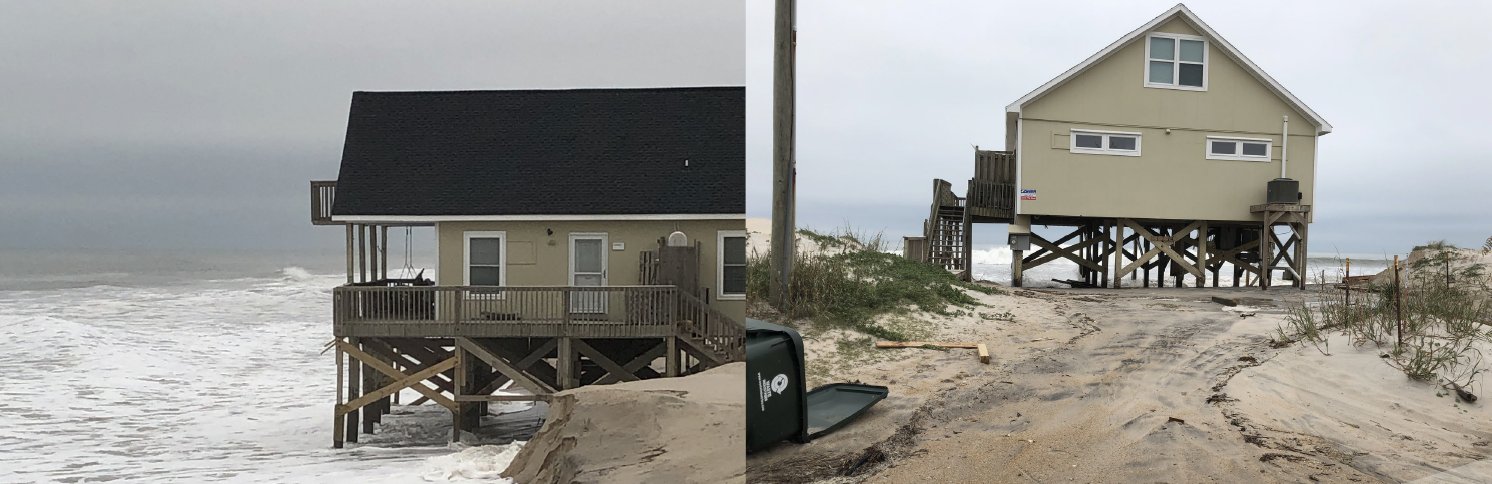
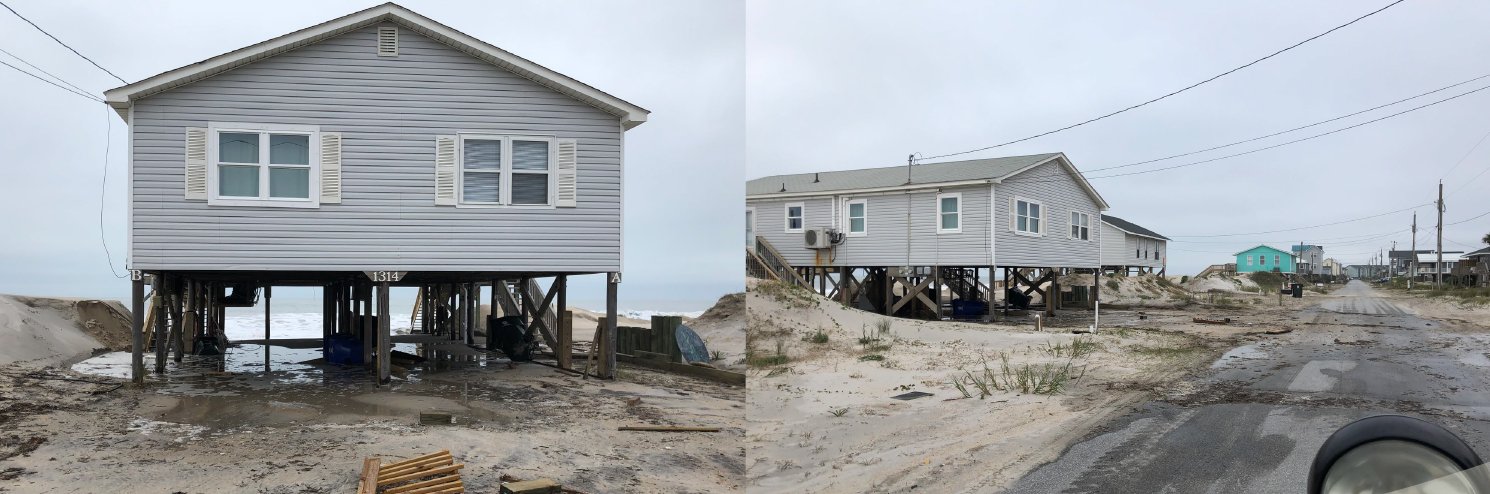
A strong non-tropical low developed along the Southeast coast on November 15, bringing two days of strong winds and rain across eastern South and North Carolina on November 16 and 17. Widespread wind gusts of 45 to 55 mph were measured across the area, with offshore wind gusts exceeding 60 mph at the Frying Pan Shoals buoy and at a CORMP weather buoy east of Wrightsville Beach. Significant beach erosion occurred with large waves crashing ashore over multiple tide cycles. The worst erosion occurred on Topsail Island near Surf City where homes were undermined by the surf. Beach erosion and minor coastal flooding extended south of Cape Fear to Myrtle Beach as well.
 URMA-model analyzed wind gusts across the Southeastern U.S. coast Saturday into Sunday. Winds approached hurricane force offshore during this major coastal storm event. URMA-model analyzed wind gusts across the Southeastern U.S. coast Saturday into Sunday. Winds approached hurricane force offshore during this major coastal storm event. |
Photos provided by Surf City Emergency Management show the ocean scoured sand from beneath homes along North Shore Drive on Sunday November 17, 2019. |
More information about this strong coastal storm is available here: https://www.weather.gov/ilm/Nov2019CoastalStorm
Temperatures for the month ran 3 to 4 degrees below normal, and this was the chillest November since 2014.
DECEMBER
Showers and thunderstorms ahead of a cold front dropped over an inch of rain in spots on December 1. Winds gusted over 35 mph, and gale force winds occurred just offshore. Temperatures cooled off for several days behind the front, but warmed well above normal December 9 and 10 as subtropical air was pulled north ahead of the next front. High temperatures on December 10 reached 80 degrees in Florence, setting a new daily record high. Other very warm temperatures included 77 degrees in Lumberton and 76 in Wilmington. Another front on December 13 was accompanied by rain across the Carolinas which totaled 1.61 inches in Florence and 2 to 3 inches across large sections of Darlington and Marlboro counties in South Carolina.
The coldest weather of month occurred the morning of December 20 when temperatures fell into the 20s for most areas. Observed low temperatures included 26 in Florence, 25 in Wilmington and Lumberton, and a very chilly 19 degrees in the Holly Shelter Gameland in Pender County, NC.
A Nor'easter on December 23 dropped up to six inches of rain across Pawley's Island and Georgetown, SC. Minor flooding occurred in Florence and Dillon counties from three to five inches of rain that fell there. The storm was responsible for large surf and a few reports of wind gusts over 40 mph. Minor river flooding developed along the Lumber and Pee Dee rivers. Following the storm, mild weather with highs in the 60s and 70s developed from Christmas Eve through New Year's Eve to close out the year.
LOCAL CITY CLIMATE SUMMARIES
WILMINGTON NC

    Avg Hi/Dep  Avg Lo/Dep  Avg T/Dep  Warmest   Coolest   Precip/Dep
JAN  56.7/+0.3   36.5/+0.9  46.6/+0.6  77/1st    19/22nd   2.72/-1.04
FEB  65.8/+5.9   42.9/+5.0  54.3/+5.4  83/7th    26/1st    1.00/-2.62
MAR  66.0/-0.4   42.7/-1.1  54.3/-0.8  81/10th   27/7th    3.10/-1.11
APR  74.9/+0.7   55.7/+4.1  65.3/+2.4  88/24th   36/3rd    3.83/+1.01
MAY  86.9/+6.2   65.6/+5.6  76.3/+5.9 101/29th   48/15th   0.63/-3.86
JUN  88.3/+1.4   69.1/+0.4  78.7/+0.9  99/30th   55/15th   2.55/-2.63
JUL  92.0/+2.3   72.9/+0.3  82.4/+1.3  97/18th   63/29th   3.54/-3.94
AUG  90.0/+1.9   72.6/+1.3  81.3/+1.6  99/9th    66/31st   7.58/+0.17
SEP  87.7/+4.0   69.8/+4.2  78.7/+4.1  96/29th   58/21st  12.00/+4.16
OCT  80.8/+5.1   61.5/+6.9  71.2/+6.0  98/3rd    45/18th   3.66/-0.23
NOV  64.2/-3.8   42.2/-3.2  53.2/-3.5  78/7th    30/13th   4.61/+1.32
DEC  63.9/+4.6   42.8/+5.0  53.4/+4.8  76/10th   25/20th   3.86/+0.24
---------------------------------------------------------------------
ANN  76.4/+2.3   56.2/+2.4  66.3/+2.3 101        19       49.08/-8.53

Number of days with Temperatures...
 90 degrees of higher: 77 (37 more than normal)
 32 degrees or lower:  26 (9 fewer than normal)

Heating degree days: 2032 (380 fewer than normal)
Cooling degree days: 2628 (584 more than normal)

Number of days with precipitation...
 0.01" or greater: 114 (21 fewer than normal)
 0.10" or greater:  68 (10 fewer than normal)
 0.50" or greater:  26 (9 fewer than normal)
 1.00" or greater:  13 (4 fewer than normal)

Thunderstorms occurred on 49 days.
Snow or sleet fell on 1 day.
Measurable snow or sleet: T inches.

Average wind speed: 7.8 MPH
Maximum 2-minute wind speed: 43 mph on September 6th (Hurricane Dorian)
Maximum 5-second wind gust: 56 mph on September 5th (Hurricane Dorian)
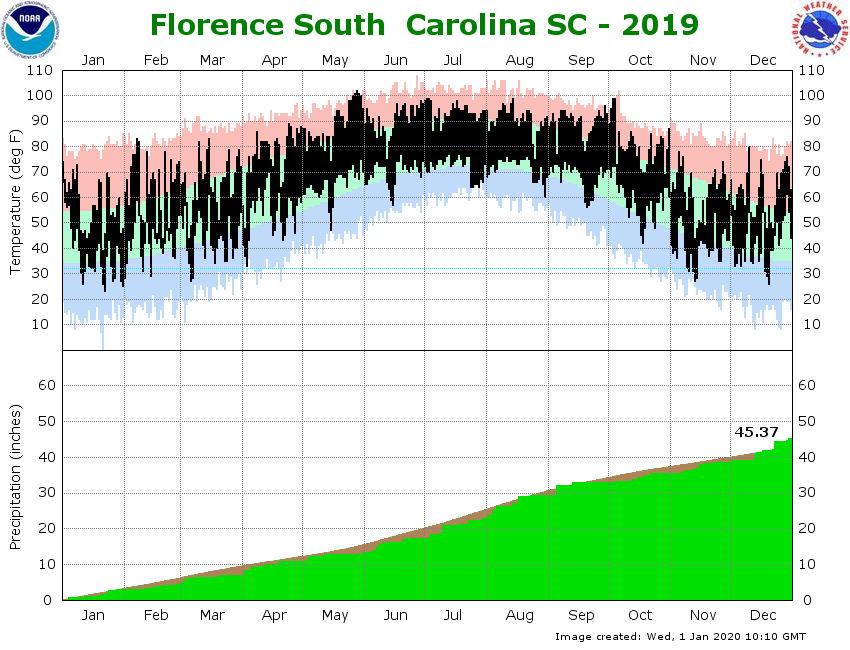
FLORENCE SC
    Avg Hi/Dep  Avg Lo/Dep  Avg T/Dep  Warmest   Coolest   Precip/Dep
JAN  57.4/+2.1   37.7/+3.1  47.6/+2.7  74/1st    23/22nd   2.88/-0.35
FEB  65.5/+5.9   42.5/+5.0  54.0/+5.5  83/7th    28/1st    1.63/-1.29
MAR  66.6/-1.0   43.4/-0.2  55.0/-0.6  83/15th   27/6th    2.53/-0.80
APR  77.5/+1.7   53.5/+2.8  65.5/+2.2  89/24th   33/3rd    3.87/+1.25
MAY  89.0/+6.3   65.0/+5.6  77.0/+5.9 102/28th   47/15th   2.43/-0.83
JUN  90.8/+2.4   69.7/+1.7  80.2/+2.0  98/29th   57/15th   3.96/-0.66
JUL  93.6/+2.6   71.7/+0.3  82.7/+1.5  99/2nd    64/24th   5.70/+0.44
AUG  90.8/+1.4   71.6/+1.1  81.2/+1.3  99/14th   60/30th   6.22/+0.98
SEP  89.7/+5.5   68.0/+3.7  78.8/+4.6  96/29th   56/20th   3.67/-0.00
OCT  80.9/+5.4   58.5/+5.4  69.7/+5.4  99/3rd    42/18th   2.74/-0.34
NOV  62.9/-4.2   40.0/-3.7  51.4/-4.0  78/5th    27/13th   3.07/+0.40
DEC  62.4/+4.6   41.8/+5.3  52.1/+5.0  80/10th   26/20th   6.67/+3.66
---------------------------------------------------------------------
ANN  77.3/+2.7   55.3/+2.5  66.3/+2.6 102        23       45.37/+2.46

Number of days with Temperatures...
90 degrees of higher: 107 (51 more than normal)
32 degrees or lower:   25 (15 fewer than normal)

Heating degree days: 2080 (444 fewer than normal)
Cooling degree days: 2666 (604 more than normal)

Number of days with precipitation...
0.01" or greater: 118 (12 more than normal)
0.10" or greater:  79 (9 more than normal)
0.50" or greater:  34 (5 more than normal)
1.00" or greater:  10 (2 fewer than normal)

Thunderstorms occurred on 49 days.
Snow or sleet fell on 1 days.

Average wind speed: 6.7 MPH
Maximum 2-minute wind speed: 41 mph on June 20th (Severe Thunderstorm)
Maximum 5-second wind gust: 55 mph on May 4th (Severe Thunderstorm)
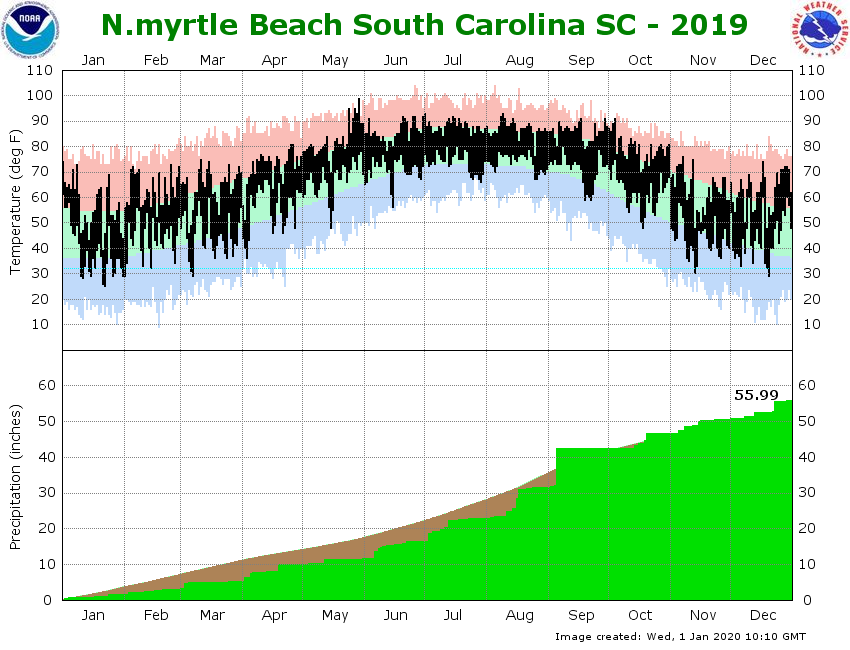
NORTH MYRTLE BEACH SC
    Avg Hi/Dep  Avg Lo/Dep  Avg T/Dep  Warmest   Coolest   Precip/Dep
JAN  56.9/+1.8   38.7/+2.5  47.8/+2.1   74/1st   25/22nd   1.74/-1.95
FEB  63.1/+5.7   43.8/+5.2  53.4/+5.4   73/24th  29/1st    1.26/-2.16
MAR  64.6/+0.5   44.7/+0.4  54.6/+0.4   75/11th  29/7th    2.26/-1.66
APR  71.9/+0.6   55.8/+3.9  63.8/+2.2   81/25th  36/3rd    4.88/+1.92
MAY  82.6/+4.0   67.0/+6.2  74.8/+5.1   99/29th  48/15th   1.47/-1.94
JUN  85.8/+1.3   70.7/+1.4  78.2/+1.3   92/25th  56/15th   4.85/+0.21
JUL  88.0/+0.4   73.6/+0.5  80.8/+0.5   93/1st   66/29th   6.55/+0.65
AUG  86.9/+0.8   73.8/+2.1  80.4/+1.5   93/9th   67/25th   8.66/+1.25
SEP  85.8/+2.4   70.9/+4.0  78.3/+3.2   91/17th  59/19th  10.90/+4.62
OCT  79.4/+4.3   61.9/+6.2  70.7/+5.3   91/4th   48/18th   4.14/+0.26
NOV  63.2/-3.4   43.3/-3.1  53.2/-3.3   76/7th   30/13th   3.86/+0.82
DEC  62.8/+4.3   44.2/+5.2  53.5/+4.7   74/17th  29/20th   5.42/+1.96
---------------------------------------------------------------------
ANN  74.2/+1.8   57.4/+2.8  65.8/+2.3   99       25       55.99/+3.98

Number of days with Temperatures...
90 degrees of higher: 29 (13 more than normal)
32 degrees or lower:  18 (12 fewer than normal)

Heating degree days: 1976 (472 fewer than normal)
Cooling degree days: 2383 (480 more than normal)

Number of days with precipitation...
0.01" or greater: 113
0.10" or greater:  69
0.50" or greater:  26
1.00" or greater:  13

Thunderstorms occurred on 47 days.
Snow or sleet fell on 0 days.

Average wind speed: 7.8 MPH
Maximum 2-minute wind speed: 41 mph on April 19th (Severe Thunderstorm)
Maximum 5-second wind gust: 61 mph on September 5th (Hurricane Dorian)
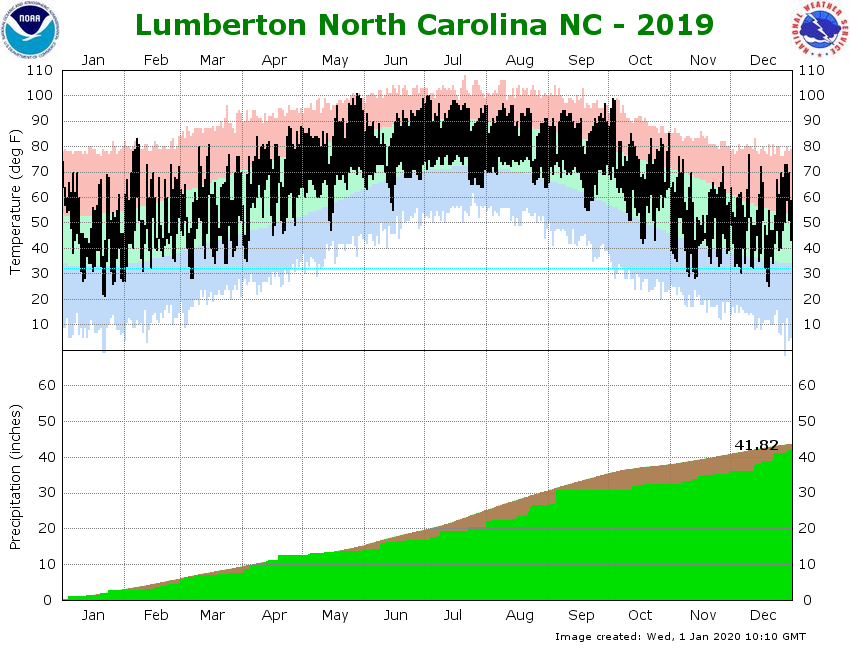
LUMBERTON NC
    Avg Hi/Dep  Avg Lo/Dep  Avg T/Dep  Warmest   Coolest   Precip/Dep
JAN  56.1/+2.4   37.1/+3.9  46.6/+3.2   74/1st   21/22nd   2.75/-0.22
FEB  63.5/+5.5   41.5/+5.9  52.5/+5.7   83/7th   27/1st    1.81/-1.09
MAR  64.5/-1.8   42.4/+0.4  53.5/-0.6   81/15th  28/6th    3.01/-0.32
APR  76.1/+1.6   54.6/+5.6  65.3/+3.6   88/24th  35/3rd    4.90/+2.08
MAY  88.4/+6.3   64.8/+7.2  76.6/+6.8  101/28th  47/15th   1.46/-1.59
JUN  88.5/-0.0   68.4/+1.0  78.4/+0.4   99/30th  55/15th   2.89/-1.45
JUL  93.9/+2.9   71.9/+0.6  82.9/+1.8  100/2nd   64/29th   3.67/-1.81
AUG  90.3/+2.0   71.4/+1.7  80.8/+1.8   97/9th   64/30th   6.02/+0.52
SEP  88.9/+5.2   67.5/+5.2  78.2/+5.2   97/29th  55/20th   4.18/-0.62
OCT  79.1/+3.6   57.4/+6.1  68.2/+4.8   99/3rd   42/18th   1.81/-0.76
NOV  60.9/-6.3   39.1/-2.3  50.0/-4.3   76/5th   28/13th   2.97/+0.10
DEC  59.5/+2.7   40.0/+4.4  49.7/+3.5   77/10th  25/20th   6.35/+3.46
---------------------------------------------------------------------
ANN  75.8/+1.9   54.7/+3.3  65.2/+2.6  101       21       41.82/-1.70

Number of days with Temperatures...
90 degrees of higher:  94 (43 more than normal)
32 degrees or lower:   26 (23 fewer than normal)

Heating degree days: 2326 (435 fewer than normal)
Cooling degree days: 2527 (617 more than normal)

Number of days with precipitation...
0.01" or greater: 112 (2 more than normal)
0.10" or greater:  75 (Exactly normal)
0.50" or greater:  26 (5 fewer than normal)
1.00" or greater:  12 (1 fewer than normal)

Thunderstorms occurred on MM days.*
Snow or sleet fell on MM days.*

Average wind speed: MM MPH*
Maximum 2-minute wind speed: MM mph on MM*
Maximum 5-second wind gust: MM mph on MM*

* The LBT ASOS went down beginning in Feb. due to airport maintenance and upgrades. Temperatures
  and precipitation values were taken from a nearby RAWS station which serves as the climate
  backup. Unfortunately, there is no weather or wind data from this site.
2019 Annual Rainfall Map estimated from Doppler Radar Data
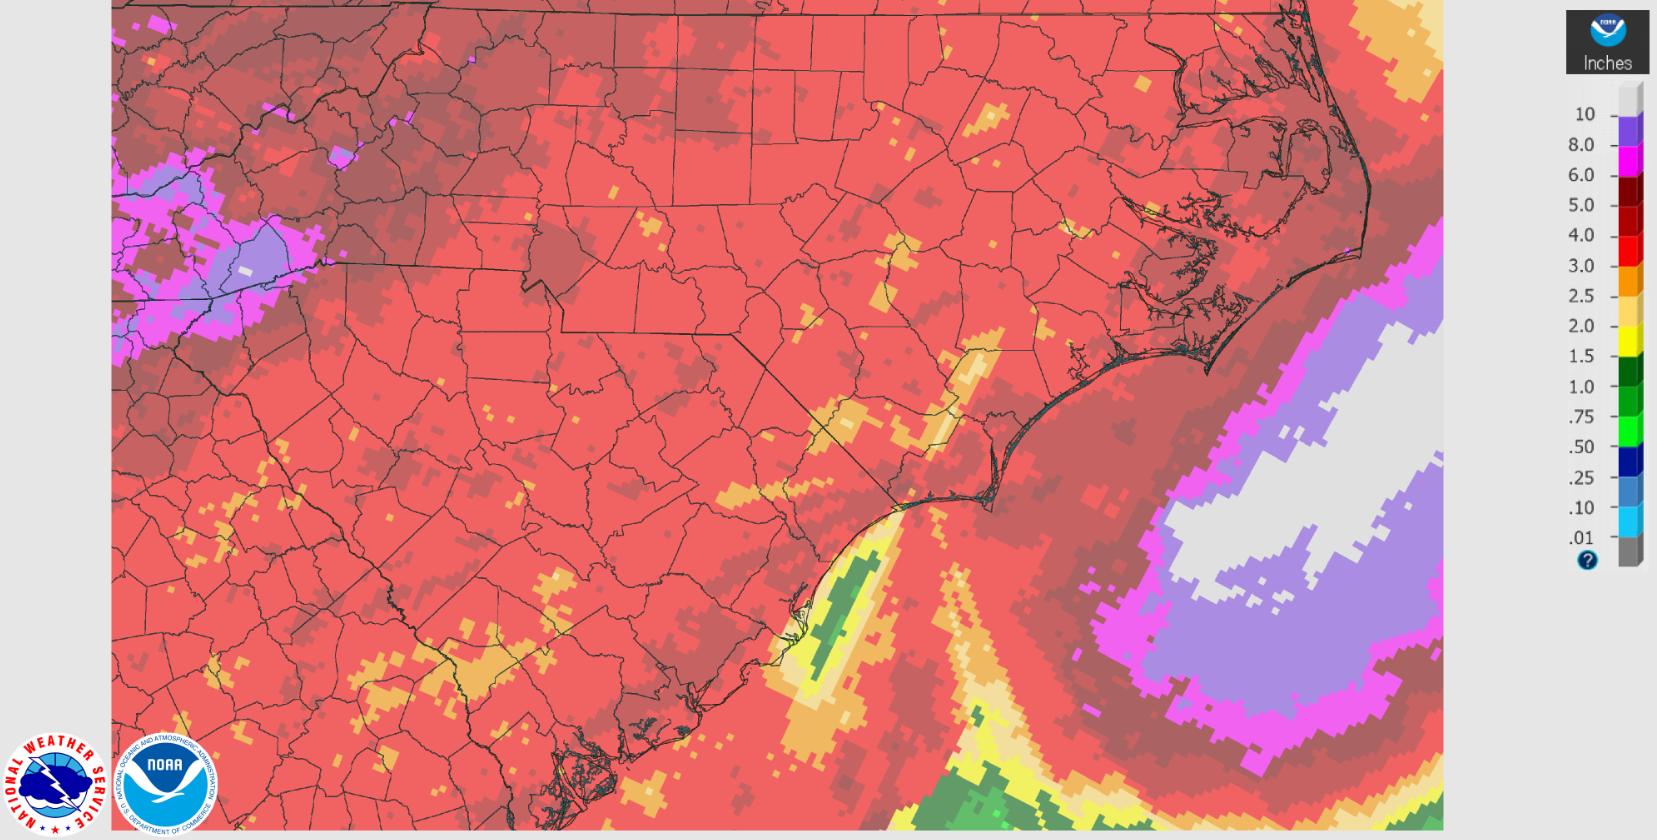
Researchers and Page Authors: Jordan Baker and Tim Armstrong
Page Created: January 1, 2020
Last Updated: January 2, 2020


 Coastal Flood
  Follow us on YouTube