The months of September, October, and November constitute meteorological fall, the transition season when falling sun angles and shorter days cause temperatures to plummet. Wilmington's normal high temperature of 87 degrees on September 1 falls to just 64 degrees by November 30. Summer thunderstorms are often replaced by calm and cooler weather -- although the peak of hurricane season in September can bring devastating storms to the area. Why is meteorological fall different than fall on the calendar?
 Pacific Ocean water temperature anomalies. The blue area along the west coast of South America is cold water associated with developing La Nina;. Pacific Ocean water temperature anomalies. The blue area along the west coast of South America is cold water associated with developing La Nina;. |
This fall there will be several factors influencing the weather and climate of eastern North and South Carolina:
The tropical eastern Pacific Ocean displays a natural cycle in water temperatures which is part of the El Niño Southern Oscillation (ENSO). The warm phase of this cycle is called El Niño, and the cold phase is called La Niña. Learn more about El Niño and La Niña...
This fall, signs point toward La Niña conditions developing as tropical east Pacific water temperatures remain below normal. La Niña causes global changes in weather patterns that extend across the Carolinas and differ by season. During the fall, La Niña typically enhances Atlantic hurricane activity by suppressing wind shear that can weaken or inhibit tropical cyclones.
Over the past 70 years La Niña has developed between July and November ten times:
| 1970, 1983, 1984, 1995, 1998, 2005, 2007, 2011, 2016, 2017 |
|
Atlantic Multidecadal Oscillation (AMO) index. The current warm phase began around 1997. |
Another important and naturally occurring climate cycle is called the Atlantic Multidecadal Oscillation (AMO). This approximately 60 year long cycle consists of 30 years of above-normal water temperatures across the Atlantic Ocean followed by 30 years of below-normal water temperatures.
The warm phase of the AMO is associated with enhanced hurricane activity in the Atlantic Ocean and warm air temperatures along the U.S. East Coast. The cold phase is associated with less Atlantic hurricane activity and cooler air temperatures along the East Coast, particularly in winter. More info about the AMO...
The current warm phase we're in began around 1996 and may continue for several more years.
Of the ten years (listed above) when La Niña began in late summer or fall, the most recent six occurrences have been during the warm phase of the AMO:
By studying how the weather and climate behaved during these six fall seasons when climate conditions were similar to now, we can attempt to forecast how the fall of 2020 will develop.
Temperatures
|
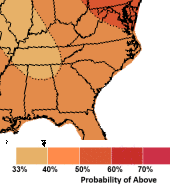
NWS Climate Prediction Center temperature outlook for Fall 2020 |
The combination of developing La Niña and a warm AMO should provide above-normal temperatures across the eastern Carolinas this Fall. Looking back at weather observations from local cities during six similar seasons, temperatures averaged 1 to 2 degrees above normal with consistently above-normal temperatures observed during five of the six seasons.
Above normal temperatures in fall can have beneficial effects by improving weather for outdoor activities and by reducing the demand for heating in late October and November. Negative effects can include higher demand for air conditioning in September and October, changes in the timing of bird and insect migration, and weather conditions better suited for invasive plants and insects to flourish. See Gallinat, Primack, and Wagner (2015) for more.
The NWS Climate Prediction Center is forecasting a 40 to 50 percent chance of above-normal temperatures this fall across the Carolinas. Their outlook also includes input from dynamical climate models plus the observed trend over the past 10 to 20 years toward warmer temperatures regardless of other weather and climate patterns.
| Wilmington | Lumberton | Florence | North Myrtle Beach | |
| NORMAL FALL AVERAGE TEMPERATURE | 65.5° | 63.6° | 64.6° | 65.7° |
| Fall 1998 observed (and anomaly) | 66.9° (+1.4°) | 64.7° (+1.1°) | 67.8° (+3.2°) | 67.0° (+1.3°) |
| Fall 2005 observed (and anomaly) | 67.4° (+1.9°) | 66.0° (+2.4°) | 66.4° (+1.8°) | 67.0° (+1.3°) |
| Fall 2007 observed (and anomaly) | 67.1° (+1.6°) | 65.8° (+2.2°) | 67.1° (+2.5°) | 67.4° (+1.7°) |
| Fall 2011 observed (and anomaly) | 65.7° (+0.2°) | 63.6° (+0.0°) | 64.3° (-0.3°) | 65.4° (-0.3°) |
| Fall 2016 observed (and anomaly) | 66.6° (+1.1°) | 66.0° (+2.4°) | 67.4° (+2.8°) | 67.1° (+1.4°) |
| Fall 2017 observed (and anomaly) | 67.0° (+1.5°) | 63.8° (+0.2°) | 65.6° (+1.0°) | 66.8° (+1.1°) |
| 1998, 2005, 2007, 2011, 2016, 2017 AVG. TEMP | 66.8° (+1.3°) | 65.0° (+1.4°) | 66.4° (+1.8°) | 66.8° (+1.1°) |
Freezing temperatures typically are first observed during November across the eastern Carolinas. The average date of the first freeze is November 16 in Wilmington, and November 10 in Florence. Read more about the probabilities and average dates of freezes here: https://www.weather.gov/ilm/freeze
Rainfall
During the six fall seasons with similar climate conditions to now (listed previously), extremely large season-to-season differences in rainfall were observed. Four of the six fall seasons experienced dry weather with rainfall three to seven inches below normal. The other two experienced extreme rainfall amounts due to hurricanes. In 2005 Hurricane Ophelia moved very close to Cape Fear while dumping over eight inches on rain in Wilmington. In 2016 Hurricane Matthew struck and dropped 10 to 18 inches of rain across large sections of eastern South and North Carolina including Georgetown, Florence, and Lumberton. Matthew was responsible for 25 deaths in North Carolina and four in South Carolina -- almost all due to flooding.
| Wilmington | Lumberton | Florence | North Myrtle Beach | |
| NORMAL FALL RAINFALL TOTALS | 15.02" | 10.24" | 9.42" | 13.20" |
| Fall 1998 observed (and anomaly) | 7.71" (-7.31") | 6.70" (-3.54") | 4.24" (-5.18") | 7.34" (-5.86") |
| Fall 2005 observed (and anomaly) | 27.44" (+12.42") | 6.91" (-3.33") | 7.14" (-2.28") | 21.21" (+8.01") |
| Fall 2007 observed (and anomaly) | 7.37" (-7.65") | 3.00" (-7.24") | 5.43" (-3.99") | 6.49" (-6.71") |
| Fall 2011 observed (and anomaly) | 12.36" (-2.66") | 8.92" (-1.32") | 5.74" (-3.68") | 8.78" (-4.42") |
| Fall 2016 observed (and anomaly) | 24.74" (+9.72) | 20.84" (+10.60") | 23.51" (+14.09") | 27.93" (+14.73") |
| Fall 2017 observed (and anomaly) | 11.40" (-3.62") | 7.94" (-2.30") | 6.39" (-3.03") | 10.06" (-3.14") |
| 1998, 2005, 2007, 2011, 2016, 2017 AVERAGE | 15.17" (+0.15") | 9.05" (-1.19") | 8.74" (-0.68") | 13.64" (+0.44) |
|
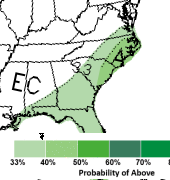
NWS Climate Prediction Center rainfall outlook for Fall 2020. There is a 40-50% chance of above normal rainfall. |
In fall seasons without hurricanes, our weather pattern tends to be dry with monthly rainfall amounts among the lowest of the year. However La Niña increases the likelihood of an active Atlantic hurricane season with infrequent but very impactful hurricanes affecting the Carolinas. This creates an odd situation where very dry and very wet seasons are favored, with less likelihood of "normal" rainfall occurring.
Since seasonal factors, including La Niña, continue to indicate the 2020 Atlantic hurricane season will remain extremely active, the odds of above normal rainfall appear high for the eastern Carolinas. The rainfall outlook from the NWS Climate Prediction Center also suggests heightened odds of above normal rainfall for the eastern Carolinas.
Hurricanes
This year's Atlantic hurricane season has produced more storms up through August than any other season in the historic record. A combination of the Atlantic Multidecadal Oscillation (AMO) in its warm phase, ample rainfall across the Sahel region of Africa where many tropical cyclones get their start, and a developing La Niña should allow more tropical storms and hurricanes to develop through the fall.
In the six fall seasons (listed previously) with similar climate conditions to now, hurricanes occurred during two of the six years with significant impacts from flooding rainfall, storm surge, and wind. The odds of a hurricane strike on the Carolinas this fall are certainly higher than normal, and we should remain vigilant. Click here for hurricane preparedness tips...
| Year | Named Atlantic Tropical Storms | Local Hurricane Impacts during Fall |
| 1998 | 14 | none* |
| 2005 | 28 | Hurricane Ophelia (September 14) |
| 2007 | 15 | none |
| 2011 | 19 | none** |
| 2016 | 15 | Hurricane Matthew (October 8) |
| 2017 | 17 | none |
| AVERAGES | 18 (Long term average is 11) |
* Hurricane Bonnie struck during the summer on August 26, 1998
** Hurricane Irene struck during the summer on August 26-27, 2011
Numerous Atlantic hurricanes this fall plus above-normal air temperatures mean more people could be exposed to the risk of rip currents while at the beaches. Rip currents are narrow channels of fast-moving water that can pull swimmers away from the shoreline. Large waves produced by hurricanes (even hurricanes thousands of miles out in the ocean) can still produce rip currents at South and North Carolina beaches. Local surf height and rip current forecasts are available here: https://www.weather.gov/beach/ilm
Coastal and River Flooding
Minor tidal flooding at the beaches will be possible during each of the three new moons this fall. Strong onshore winds, hurricanes, or other storm systems could produce more significant coastal flooding and beach erosion, especially if they occur around a new moon. Periods of concern include:
| Dates | Astronomical High Tides (not including weather or surge) | Date of New Moon |
| September 15-23 | Wrightsville Beach: 5.2 to 5.4 feet MLLW Myrtle Beach: 6.5 to 6.8 feet MLLW |
September 17 |
| October 15-21 | Wrightsville Beach: 5.2 to 5.9 feet MLLW Myrtle Beach: 6.5 to 7.2 feet MLLW |
October 16 |
| November 13-18 | Wrightsville Beach: 5.2 to 5.8 feet MLLW Myrtle Beach: 6.5 to 7.2 feet MLLW |
November 15 |
Three day water level forecasts incorporating weather and surge factors are available for Wrightsville Beach, Myrtle Beach, and the Cape Fear River at downtown Wilmington.
|
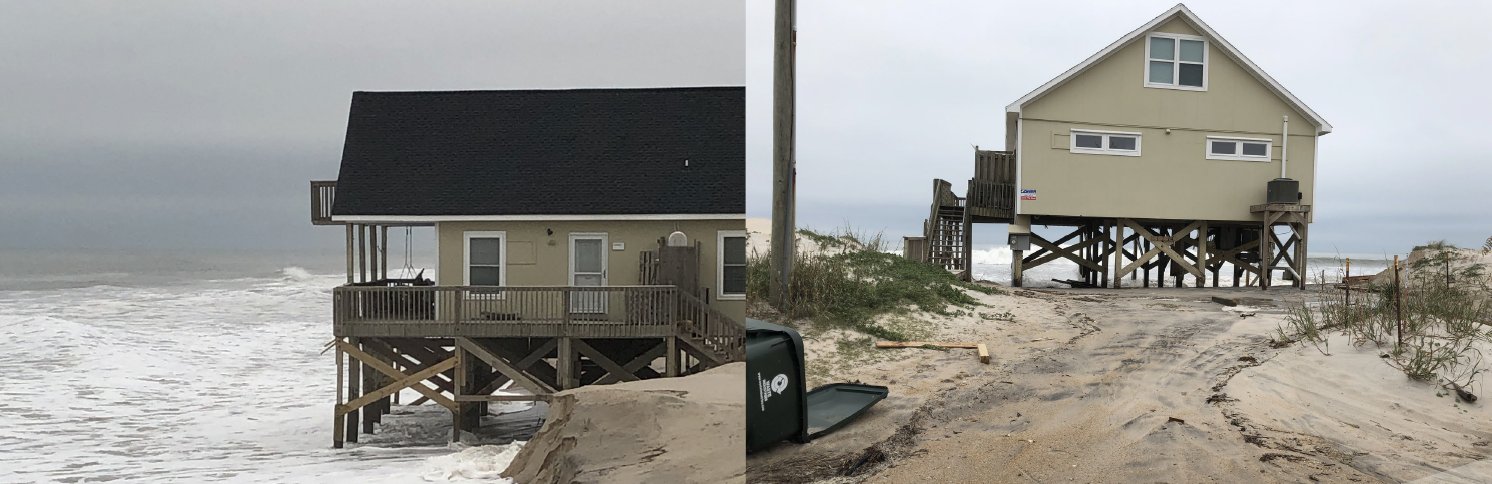
Coastal flooding and severe beach erosion occurred in Surf City, NC during a strong non-tropical storm on November 16-17, 2019. Photos courtesy of Surf City Emergency Management. |
River floods across the eastern Carolinas during fall are usually linked to tropical storms or hurricanes. Probabilistic river stage simulations produced by the Southeast River Forecast Center show weekly chances for flooding no higher than 10 to 25 percent through September and October. However these simulations cannot predict the impact of hurricanes at such long timescales, and any hurricane strike will significantly increase river flood risk. Hurricane Matthew's landfall in October of 2016 resulted in deadly flooding across eastern North and South Carolina and record river stages on the Waccamaw, Lumber Rivers, and Cape Fear rivers.
|
Probabilistic river stage forecasts for the Northeast Cape Fear River at Burgaw, NC |
Probabilistic river stage forecasts for the Waccamaw River at Conway, SC |
Probabilistic river stage forecasts for the Lumber River at Lumberton, NC |
Additional Reading
Climate Prediction Center ENSO Status Briefing: https://www.cpc.ncep.noaa.gov/products/analysis_monitoring/lanina/enso_evolution-status-fcsts-web.pdf
Climate Prediction Center Seasonal Outlook Discussion: https://www.cpc.ncep.noaa.gov/products/predictions/long_range/fxus05.html
NOAA Seasonal Hurricane Outlook (August 2020 update): https://www.cpc.ncep.noaa.gov/products/outlooks/hurricane.shtml
Hurricane Ophelia September 14, 2005: https://www.weather.gov/ilm/2005-Sep-14hurricane
Hurricane Matthew October 8, 2016: https://www.weather.gov/ilm/Matthew
Daily Climate Normals and Records for Wilmington, Florence, North Myrtle Beach, and Lumberton
Research and Page Author: Tim Armstrong
Created: August 26, 2020


 Coastal Flood
  Follow us on YouTube