 |
|
| Latest Water Temp |
| 68° |
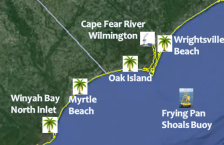
The Haw and Deep Rivers combine about 25 miles southwest of Raleigh forming the Cape Fear River. This river drains a large portion of central and southeastern North Carolina. The Cape Fear passes by Downtown Wilmington on its way to the Atlantic Ocean -- the actual mouth of the river is between Southport and Bald Head Island, about 25 miles south of Wilmington. At Wilmington the river is strongly influenced by tides and flows "backwards" as brackish water moves upstream with the rising tide. As a result, water temperatures here are influenced by both the ocean and downstream flow from interior North Carolina. Rising sea level and recent dredging has led to an increase in salinity within the lower Cape Fear River with freshwater marshes and cypress trees being replaced by saltmarshes along the river and its tributary creeks.
Average Water Temperatures for the Cape Fear River at Downtown Wilmington, NC
|
January |
February |
March |
April |
May |
June |
||||||||||||
|
1-10 |
11-20 |
21-31 |
1-10 |
11-20 |
21-29 |
1-10 |
11-20 |
21-31 |
1-10 |
11-20 |
21-30 |
1-10 |
11-20 |
21-31 |
1-10 |
11-20 |
21-30 |
|
48 |
47 |
46 |
48 |
48 |
51 |
53 |
56 |
59 |
62 |
64 |
67 |
70 |
73 |
75 |
78 |
81 |
82 |
|
July |
August |
September |
October |
November |
December |
||||||||||||
|
1-10 |
11-20 |
21-31 |
1-10 |
11-20 |
21-31 |
1-10 |
11-20 |
21-30 |
1-10 |
11-20 |
21-31 |
1-10 |
11-20 |
21-30 |
1-10 |
11-20 |
21-31 |
|
83 |
84 |
84 |
84 |
83 |
83 |
81 |
78 |
76 |
73 |
71 |
68 |
64 |
60 |
57 |
54 |
51 |
50 |
Average values are given for early (1st-10th), mid (11th-20th), and late (21st-31st) each month.
Detailed Water Temperature Statistics for the Cape Fear River at Downtown Wilmington, NC
Box and Whisker statistical plot. Colored boxes indicate the 25th through 75th percentiles, with the red/blue center of each box indicating the mean (average) value. The black whiskers indicate the highest and lowest temperatures ever ever observed during each roughly 10 day time period throughout the year.
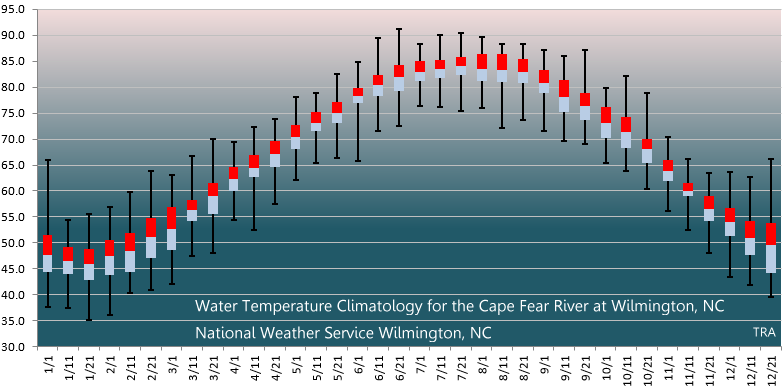
Statistical table of water temperature data. In addition to mean, highest and lowest values for each time period, various percentiles are displayed.
|
|
|
Jan |
|
|
Feb |
|
|
Mar |
|
|
Apr |
|
|
May |
|
|
Jun |
|
|
|
1-10 |
11-20 |
21-31 |
1-10 |
11-20 |
21-29 |
1-10 |
11-20 |
21-31 |
1-10 |
11-20 |
21-30 |
1-10 |
11-20 |
21-31 |
1-10 |
11-20 |
21-30 |
|
Highest |
66.0 |
54.3 |
55.6 |
56.8 |
59.7 |
63.9 |
63.1 |
66.7 |
70.0 |
69.4 |
72.3 |
73.9 |
78.1 |
78.8 |
82.6 |
84.9 |
89.4 |
91.2 |
|
Upper 0.1% |
66.0 |
54.3 |
55.4 |
56.5 |
59.1 |
63.7 |
63.0 |
66.4 |
69.6 |
69.3 |
72.0 |
73.6 |
77.7 |
78.3 |
82.0 |
84.6 |
88.9 |
90.0 |
|
Upper 1% |
63.7 |
53.8 |
55.0 |
55.9 |
57.7 |
63.1 |
62.6 |
65.8 |
68.9 |
68.7 |
70.7 |
72.9 |
77.0 |
77.7 |
80.6 |
84.0 |
87.6 |
89.1 |
|
Upper 5% |
55.4 |
53.1 |
54.0 |
55.2 |
56.5 |
60.6 |
60.6 |
63.5 |
67.8 |
67.6 |
69.6 |
72.0 |
75.7 |
77.0 |
79.0 |
83.1 |
85.5 |
88.0 |
|
Upper 10% |
53.6 |
52.0 |
52.2 |
53.8 |
55.4 |
58.6 |
58.6 |
60.6 |
64.6 |
66.6 |
68.9 |
71.2 |
74.7 |
76.3 |
78.4 |
82.0 |
84.7 |
85.8 |
|
Upper 25% |
51.4 |
49.3 |
48.7 |
50.5 |
52.0 |
54.9 |
56.8 |
58.3 |
61.5 |
64.6 |
66.9 |
69.6 |
72.7 |
75.2 |
77.2 |
79.9 |
82.4 |
84.2 |
|
MEAN |
47.7 |
46.6 |
46.0 |
47.5 |
48.4 |
51.1 |
52.8 |
56.3 |
59.0 |
62.2 |
64.4 |
67.0 |
70.3 |
73.2 |
75.0 |
78.2 |
80.5 |
81.9 |
|
Lower 25% |
44.4 |
44.1 |
42.8 |
43.9 |
44.4 |
47.1 |
48.6 |
54.1 |
55.6 |
59.9 |
62.6 |
64.6 |
68.0 |
71.6 |
73.0 |
77.0 |
78.3 |
79.3 |
|
Lower 10% |
40.6 |
41.7 |
40.8 |
41.4 |
43.2 |
44.8 |
46.6 |
51.6 |
54.0 |
57.4 |
60.6 |
62.1 |
65.3 |
69.8 |
70.5 |
75.4 |
77.0 |
77.7 |
|
Lower 5% |
39.2 |
39.7 |
39.4 |
40.5 |
41.9 |
42.6 |
45.9 |
49.5 |
53.2 |
56.7 |
57.9 |
60.8 |
64.4 |
67.6 |
69.6 |
70.9 |
76.3 |
76.3 |
|
Lower 1% |
38.5 |
38.5 |
36.0 |
36.7 |
41.0 |
41.5 |
43.5 |
48.2 |
48.9 |
55.6 |
54.0 |
59.4 |
63.1 |
66.6 |
68.0 |
67.6 |
73.4 |
74.5 |
|
Lower 0.1% |
38.1 |
37.6 |
35.2 |
36.1 |
40.5 |
41.0 |
42.3 |
47.7 |
48.4 |
54.9 |
52.9 |
57.9 |
62.4 |
65.5 |
66.7 |
66.4 |
71.8 |
73.0 |
|
Lowest |
37.6 |
37.4 |
35.1 |
36.1 |
40.3 |
41.0 |
42.1 |
47.5 |
48.0 |
54.5 |
52.5 |
57.6 |
62.1 |
65.3 |
66.4 |
65.8 |
71.6 |
72.5 |
|
|
|
Jul |
|
|
Aug |
|
|
Sep |
|
|
Oct |
|
|
Nov |
|
|
Dec |
|
ANNUAL |
|
|
1-10 |
11-20 |
21-31 |
1-10 |
11-20 |
21-31 |
1-10 |
11-20 |
21-30 |
1-10 |
11-20 |
21-31 |
1-10 |
11-20 |
21-30 |
1-10 |
11-20 |
21-31 |
|
|
Highest |
88.3 |
90.1 |
90.5 |
89.6 |
88.3 |
88.3 |
87.1 |
86.0 |
87.1 |
79.9 |
82.2 |
78.8 |
70.3 |
66.2 |
63.5 |
63.7 |
62.6 |
66.2 |
91.2 |
|
Upper 0.1% |
88.3 |
89.4 |
90.1 |
89.2 |
88.3 |
88.2 |
86.9 |
85.8 |
82.4 |
79.7 |
82.0 |
78.6 |
70.2 |
65.8 |
63.5 |
63.5 |
62.4 |
65.8 |
89.1 |
|
Upper 1% |
87.8 |
88.2 |
89.2 |
88.5 |
88.0 |
87.8 |
85.6 |
85.3 |
82.0 |
79.2 |
81.3 |
77.9 |
69.4 |
64.6 |
62.6 |
63.0 |
61.7 |
64.0 |
87.6 |
|
Upper 5% |
86.9 |
87.3 |
88.3 |
87.6 |
87.6 |
87.3 |
85.1 |
83.3 |
81.1 |
78.4 |
78.4 |
76.1 |
68.4 |
63.3 |
61.7 |
62.1 |
60.3 |
57.7 |
85.6 |
|
Upper 10% |
86.4 |
86.7 |
87.6 |
87.4 |
87.1 |
86.7 |
84.7 |
82.6 |
79.7 |
77.9 |
77.2 |
73.9 |
67.6 |
62.6 |
60.8 |
58.8 |
56.7 |
56.8 |
84.0 |
|
Upper 25% |
85.1 |
85.3 |
85.8 |
86.4 |
86.4 |
85.5 |
83.3 |
81.3 |
78.8 |
76.1 |
74.3 |
70.0 |
66.0 |
61.5 |
59.0 |
56.7 |
54.1 |
53.8 |
79.5 |
|
MEAN |
83.0 |
83.6 |
84.0 |
83.6 |
83.3 |
82.9 |
80.8 |
78.0 |
76.3 |
73.2 |
71.4 |
68.1 |
63.8 |
60.1 |
56.5 |
54.0 |
50.9 |
49.6 |
67.3 |
|
Lower 25% |
81.1 |
81.9 |
82.4 |
81.1 |
81.0 |
80.8 |
78.8 |
75.2 |
73.8 |
70.2 |
68.2 |
65.5 |
61.9 |
59.0 |
54.1 |
51.3 |
47.7 |
44.1 |
55.6 |
|
Lower 10% |
79.2 |
80.1 |
80.6 |
79.7 |
79.3 |
79.2 |
76.1 |
72.9 |
72.0 |
68.4 |
66.7 |
63.9 |
60.8 |
57.6 |
51.6 |
48.7 |
45.0 |
42.1 |
47.5 |
|
Lower 5% |
78.3 |
79.2 |
79.2 |
78.8 |
76.8 |
78.1 |
75.0 |
71.6 |
71.1 |
67.3 |
65.8 |
63.1 |
60.1 |
55.8 |
51.1 |
47.1 |
43.7 |
41.5 |
44.4 |
|
Lower 1% |
77.4 |
77.5 |
76.6 |
77.2 |
73.6 |
74.8 |
73.0 |
70.2 |
70.0 |
66.2 |
64.8 |
62.1 |
58.1 |
53.8 |
49.3 |
45.3 |
43.0 |
40.6 |
41.0 |
|
Lower 0.1% |
76.6 |
76.5 |
75.9 |
76.1 |
72.5 |
73.8 |
72.1 |
69.6 |
69.4 |
65.5 |
64.0 |
60.8 |
56.8 |
52.7 |
48.4 |
44.1 |
42.1 |
39.7 |
37.2 |
|
Lowest |
76.3 |
76.1 |
75.4 |
75.9 |
72.1 |
73.8 |
71.6 |
69.6 |
69.1 |
65.3 |
63.9 |
60.4 |
56.1 |
52.5 |
48.0 |
43.3 |
41.9 |
39.6 |
35.1 |
After quality control, a total of 1,461,471 individual water temperature observations were available to calculate the values used in this climatology. Data was collected by the NOAA National Ocean Service over the period from 2000 through 2018. Current weather and tide data for this site is available here.
Page Author and Statistical Analysis: Tim Armstrong
Page Created: July 16, 2015
Last Updated: February 28, 2019


 Coastal Flood
  Follow us on YouTube