 |
|
| Latest Water Temp |
| 65° |
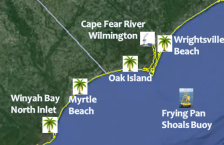
Winyah Bay is a large, natural embayment near Georgetown, South Carolina. The Pee Dee and Waccamaw Rivers both drain to the Atlantic Ocean through Winyah Bay. Water temperatures can change much more quickly here than in the ocean due to tidal flows, shallow water depth, and rainfall-induced drainage from nearby land. At low tide the shallow water is quickly heated by the sun during the day, and can become quite cold during a long winter night. Data presented here should give a good approximation of water temperatures in most South Carolina saltmarshes.
Average Water Temperatures for North Inlet-Winyah Bay, SC
|
January |
February |
March |
April |
May |
June |
||||||||||||
|
1-10 |
11-20 |
21-31 |
1-10 |
11-20 |
21-29 |
1-10 |
11-20 |
21-31 |
1-10 |
11-20 |
21-30 |
1-10 |
11-20 |
21-31 |
1-10 |
11-20 |
21-30 |
|
51 |
51 |
50 |
52 |
53 |
56 |
57 |
60 |
62 |
65 |
67 |
71 |
73 |
75 |
78 |
80 |
83 |
83 |
|
July |
August |
September |
October |
November |
December |
||||||||||||
|
1-10 |
11-20 |
21-31 |
1-10 |
11-20 |
21-31 |
1-10 |
11-20 |
21-30 |
1-10 |
11-20 |
21-31 |
1-10 |
11-20 |
21-30 |
1-10 |
11-20 |
21-31 |
|
84 |
84 |
85 |
84 |
85 |
84 |
82 |
80 |
79 |
75 |
73 |
68 |
65 |
61 |
59 |
56 |
54 |
53 |
Average values are given for early (1st-10th), mid (11th-20th), and late (21st-31st) each month.
Detailed Water Temperature Statistics for North Inlet-Winyah Bay, SC
Box and Whisker statistical plot. Colored boxes indicate the 25th through 75th percentiles, with the red/blue center of each box indicating the mean (average) value. The black whiskers indicate the highest and lowest temperatures ever observed during each roughly 10 day time period throughout the year.

Statistical table of water temperature data. In addition to mean, highest and lowest values for each time period, various percentiles are displayed.
|
|
Jan |
Feb |
Mar |
Apr |
May |
Jun |
||||||||||||
|
|
1-10 |
11-20 |
21-31 |
1-10 |
11-20 |
21-29 |
1-10 |
11-20 |
21-31 |
1-10 |
11-20 |
21-30 |
1-10 |
11-20 |
21-31 |
1-10 |
11-20 |
21-30 |
|
Highest |
70.3 |
68.4 |
70.9 |
71.1 |
71.1 |
74.7 |
77.0 |
76.6 |
81.3 |
81.9 |
87.3 |
88.2 |
88.7 |
89.1 |
91.2 |
94.1 |
97.2 |
95.7 |
|
Upper 0.1% |
69.8 |
67.6 |
68.5 |
69.8 |
69.4 |
73.9 |
75.4 |
75.9 |
79.3 |
81.1 |
85.3 |
86.2 |
87.4 |
88.2 |
90.7 |
93.4 |
96.1 |
94.6 |
|
Upper 1% |
64.9 |
63.9 |
63.5 |
64.2 |
65.7 |
71.2 |
70.9 |
73.8 |
76.6 |
77.9 |
81.3 |
83.1 |
84.9 |
86.0 |
88.7 |
90.9 |
93.2 |
92.5 |
|
Upper 5% |
61.7 |
60.4 |
60.3 |
60.8 |
62.2 |
66.0 |
66.6 |
68.7 |
72.1 |
74.5 |
77.0 |
79.3 |
81.7 |
82.4 |
85.6 |
87.6 |
89.8 |
90.0 |
|
Upper 10% |
59.4 |
58.3 |
57.9 |
58.8 |
59.9 |
63.5 |
64.4 |
67.1 |
69.6 |
72.1 |
74.5 |
77.0 |
79.7 |
80.6 |
83.7 |
85.8 |
87.8 |
88.3 |
|
Upper 25% |
55.6 |
54.7 |
53.8 |
55.0 |
56.3 |
59.2 |
60.6 |
63.1 |
65.7 |
68.5 |
70.5 |
73.6 |
76.3 |
77.7 |
80.6 |
82.9 |
84.7 |
85.6 |
|
MEAN |
50.9 |
50.8 |
50.2 |
51.7 |
52.7 |
55.8 |
56.9 |
59.6 |
61.8 |
65.2 |
67.4 |
70.6 |
73.2 |
75.2 |
78.0 |
80.4 |
82.6 |
83.4 |
|
Lower 25% |
46.0 |
46.9 |
46.2 |
48.2 |
48.9 |
52.2 |
53.1 |
55.6 |
57.6 |
61.5 |
63.7 |
67.1 |
70.0 |
72.3 |
75.4 |
77.9 |
80.1 |
81.1 |
|
Lower 10% |
41.7 |
43.3 |
43.2 |
45.9 |
46.0 |
49.3 |
50.0 |
52.7 |
54.7 |
58.8 |
61.0 |
64.9 |
67.3 |
70.3 |
72.7 |
75.4 |
78.3 |
79.2 |
|
Lower 5% |
39.6 |
41.2 |
41.5 |
43.7 |
44.4 |
46.2 |
48.2 |
51.1 |
53.4 |
57.4 |
59.7 |
63.5 |
65.3 |
68.9 |
71.1 |
73.6 |
77.2 |
77.5 |
|
Lower 1% |
35.6 |
38.5 |
38.7 |
40.5 |
41.7 |
43.3 |
45.1 |
48.1 |
50.7 |
55.2 |
57.0 |
60.4 |
60.4 |
65.7 |
67.8 |
67.5 |
74.5 |
75.4 |
|
Lower 0.1% |
32.2 |
35.6 |
34.2 |
36.5 |
39.0 |
40.5 |
42.2 |
44.5 |
47.3 |
52.9 |
54.7 |
57.9 |
55.8 |
61.9 |
65.7 |
64.0 |
71.1 |
73.0 |
|
Lowest |
30.7 |
34.5 |
32.5 |
36.0 |
37.6 |
39.2 |
41.4 |
42.6 |
45.1 |
51.6 |
53.4 |
56.5 |
54.9 |
60.3 |
64.8 |
63.7 |
70.7 |
71.2 |
|
|
Jul |
Aug |
Sep |
Oct |
Nov |
Dec |
ANNUAL |
||||||||||||
|
|
1-10 |
11-20 |
21-31 |
1-10 |
11-20 |
21-31 |
1-10 |
11-20 |
21-30 |
1-10 |
11-20 |
21-31 |
1-10 |
11-20 |
21-30 |
1-10 |
11-20 |
21-31 |
|
|
Highest |
96.1 |
95.5 |
97.7 |
99.0 |
96.3 |
95.7 |
92.8 |
91.4 |
89.6 |
87.3 |
84.7 |
82.2 |
79.2 |
75.4 |
72.3 |
71.8 |
72.0 |
74.8 |
99.0 |
|
Upper 0.1% |
95.5 |
94.8 |
95.7 |
95.9 |
95.0 |
93.7 |
91.6 |
90.1 |
88.6 |
86.3 |
83.8 |
80.8 |
78.1 |
74.0 |
70.5 |
70.3 |
70.7 |
73.8 |
93.9 |
|
Upper 1% |
93.6 |
93.2 |
93.7 |
93.0 |
92.7 |
91.9 |
89.8 |
87.4 |
86.9 |
84.0 |
81.3 |
77.7 |
76.3 |
71.1 |
68.5 |
67.8 |
67.1 |
70.7 |
90.7 |
|
Upper 5% |
90.7 |
90.3 |
91.2 |
90.7 |
90.1 |
89.2 |
87.4 |
85.3 |
84.4 |
81.9 |
79.2 |
75.4 |
73.0 |
68.0 |
66.2 |
65.3 |
63.7 |
63.5 |
86.5 |
|
Upper 10% |
88.9 |
88.5 |
89.4 |
89.1 |
88.9 |
87.6 |
86.0 |
84.0 |
83.1 |
81.0 |
77.7 |
73.8 |
71.6 |
66.6 |
64.9 |
63.5 |
61.9 |
60.6 |
84.6 |
|
Upper 25% |
86.0 |
86.2 |
86.7 |
86.4 |
86.5 |
85.5 |
83.8 |
82.0 |
81.1 |
78.3 |
75.1 |
70.9 |
68.9 |
63.7 |
62.4 |
59.7 |
57.9 |
56.7 |
80.8 |
|
MEAN |
84.2 |
84.3 |
84.7 |
84.4 |
84.5 |
83.6 |
81.8 |
79.8 |
78.5 |
75.2 |
72.5 |
68.1 |
65.1 |
60.9 |
58.7 |
56.3 |
54.4 |
53.0 |
68.7 |
|
Lower 25% |
81.9 |
82.2 |
82.6 |
82.2 |
82.4 |
81.5 |
79.7 |
77.5 |
75.9 |
72.3 |
70.0 |
65.5 |
61.5 |
58.1 |
55.2 |
52.7 |
50.9 |
48.9 |
57.6 |
|
Lower 10% |
80.1 |
80.6 |
80.8 |
80.2 |
80.4 |
79.5 |
77.4 |
75.0 |
73.6 |
69.8 |
67.3 |
61.9 |
59.0 |
55.2 |
52.2 |
49.5 |
48.4 |
44.8 |
50.7 |
|
Lower 5% |
79.0 |
79.5 |
79.5 |
79.2 |
78.8 |
78.3 |
75.9 |
73.6 |
71.8 |
68.4 |
65.5 |
60.1 |
57.6 |
53.4 |
50.4 |
47.5 |
46.4 |
42.6 |
47.7 |
|
Lower 1% |
77.5 |
75.9 |
77.0 |
76.5 |
75.2 |
76.3 |
73.4 |
70.9 |
68.9 |
64.0 |
62.1 |
56.7 |
54.9 |
50.4 |
47.5 |
43.9 |
39.7 |
39.7 |
42.1 |
|
Lower 0.1% |
75.6 |
72.5 |
74.5 |
74.1 |
73.9 |
74.3 |
71.4 |
68.2 |
66.6 |
59.2 |
59.2 |
55.4 |
52.7 |
46.9 |
45.5 |
41.0 |
34.5 |
36.5 |
37.4 |
|
Lowest |
74.5 |
71.8 |
74.3 |
72.7 |
73.0 |
73.8 |
69.8 |
67.5 |
66.0 |
58.6 |
57.9 |
48.9 |
51.8 |
45.5 |
43.9 |
40.1 |
33.4 |
35.1 |
30.7 |
After quality control, a total of 768,179 individual water temperature observations were available to calculate the values used in this climatology. Data was collected by the Baruch Marine Lab at the North Inlet-Winyah Bay National Estuarine Research Reserve over the period 1996 through 2018. Current water temperature data for this site is available here; weather and tide data is available here.
Page Author and Statistical Analysis: Tim Armstrong
Page Created: July 16, 2015
Last Updated: February 28, 2019


 Coastal Flood
  Follow us on YouTube