
|
The NWS definition of a heat wave is a period of abnormally and uncomfortably hot and unusually humid weather, typically lasting two or more days. The Carolinas have suffered through vicious heat waves throughout history, particularly during the decades of the 1950s, 1980s, and now more recently beginning in 2007. In some cases the heat was accompanied by severe drought, causing massive agricultural impacts and stress to local water supplies. |
Each summer brings hot weather to the Carolinas, but occasionally a period of exceptional heat develops and lingers for days or weeks. These heat waves can injure or kill people, animals, and plants exposed to the sun and hot temperatures for long periods of time. Large electrical demand for air conditioning can, in exceptional cases, lead to local or regional power disruptions. Crops and livestock can also be affected by drought, which has accompanied many of our worst heat waves. Destructive wildfires can spread in the dry conditions during these drought/heat wave combinations.
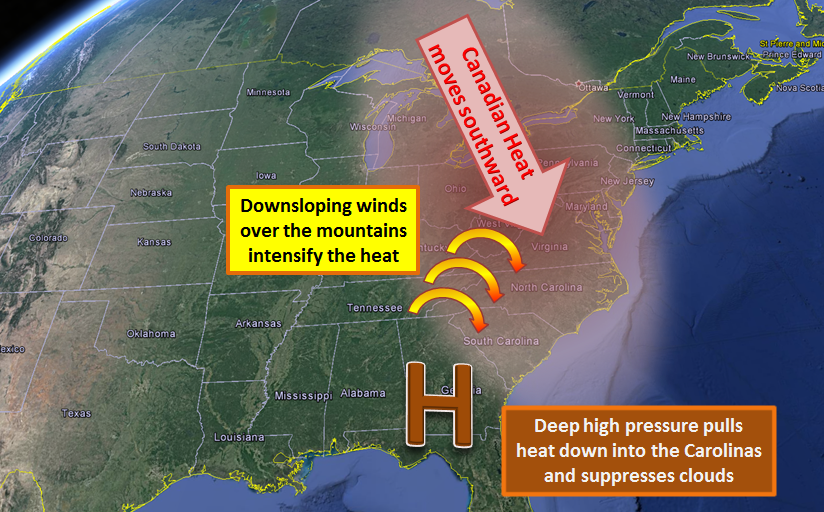
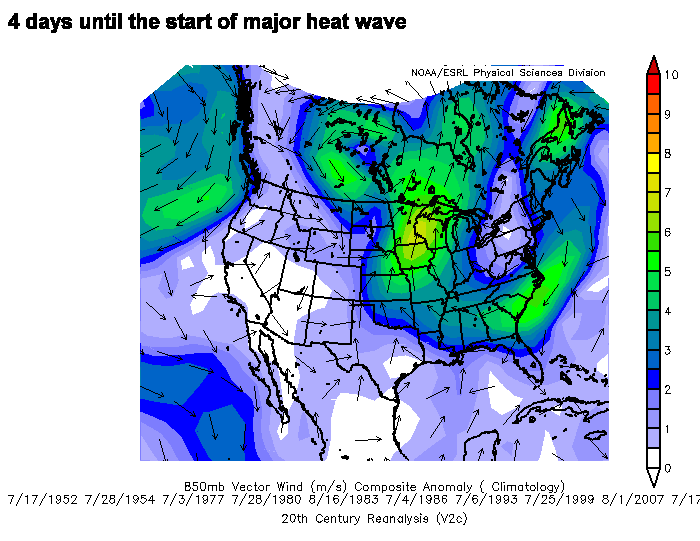
Interestingly, most Carolina heat waves originate as a region of well-above normal temperatures in Ontario, Canada three or four days before reaching the Carolinas. This Canadian heat is typically the result of high pressure over the Great Lakes and unusual upper level ridging over eastern Canada. If this high pressure region is forced to move south, the heat will follow it down through the eastern United States. The heat wave then begins across the Carolinas as the high moves into Georgia, often merging with the Bermuda High offshore. Westerly winds blowing across the Appalachians experience compressional heating as they descend the eastern slopes of the mountains, adding to the already hot temperatures. Sinking atmospheric motion associated with the upper level ridge further heats and dries the air aloft, creating an environment where clouds and afternoon thunderstorms cannot easily develop.
Very few Carolina heat waves extend south to the Gulf Coast or Florida as this typically requires the high pressure region to be located farther west. Since our heat waves often originate to the north, many of the dates associated with the worst Carolina heat waves also show up in heat wave studies for Virginia through the Midwest and Great Lakes.
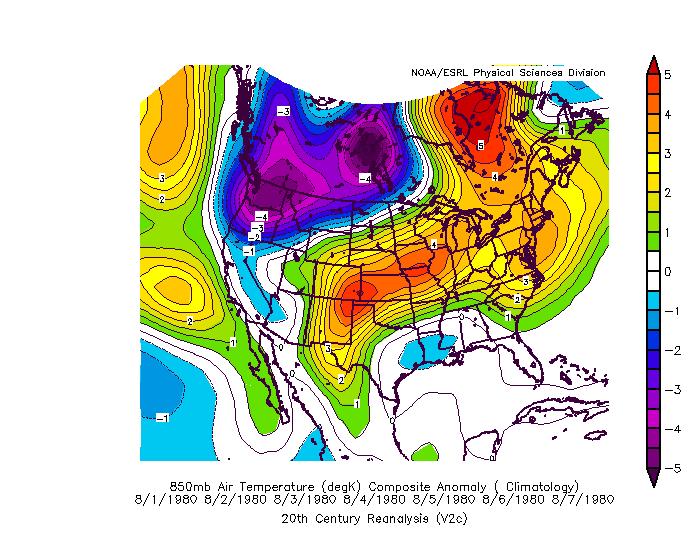
Heat waves across the Carolinas also correlate very well with below-normal temperatures along the Pacific Coast of the United States and the Canadian Rockies, and sometimes across eastern Quebec and Newfoundland, too. This is the result of cold troughs both west and east of the anomalously hot ridge that covers the eastern United States during these heat events.
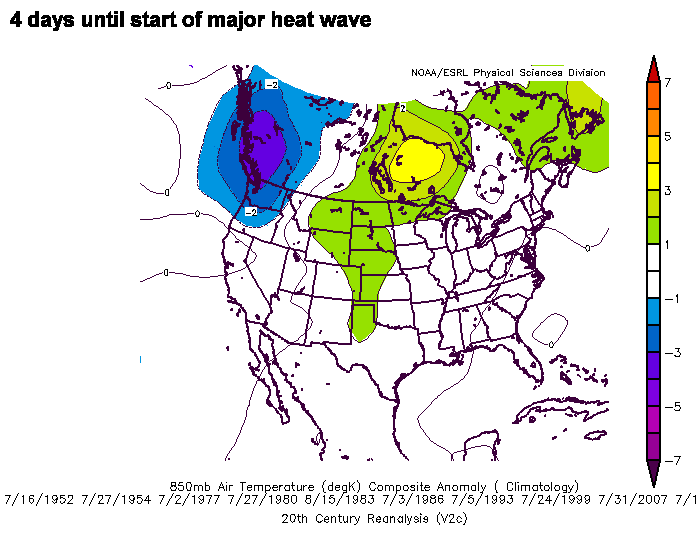
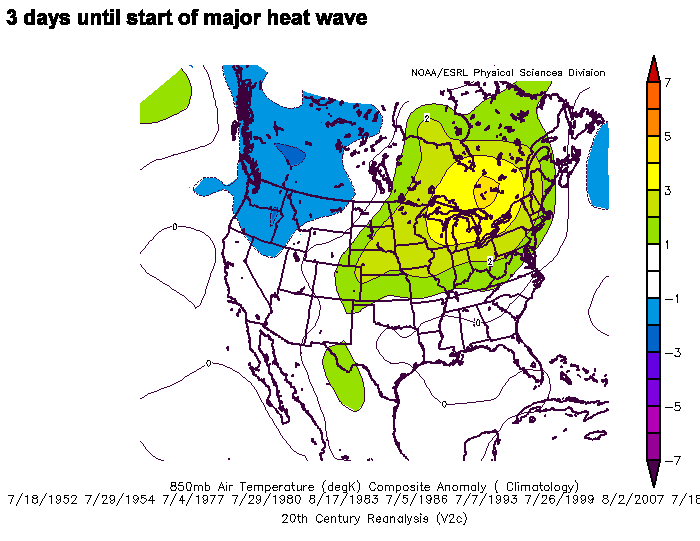
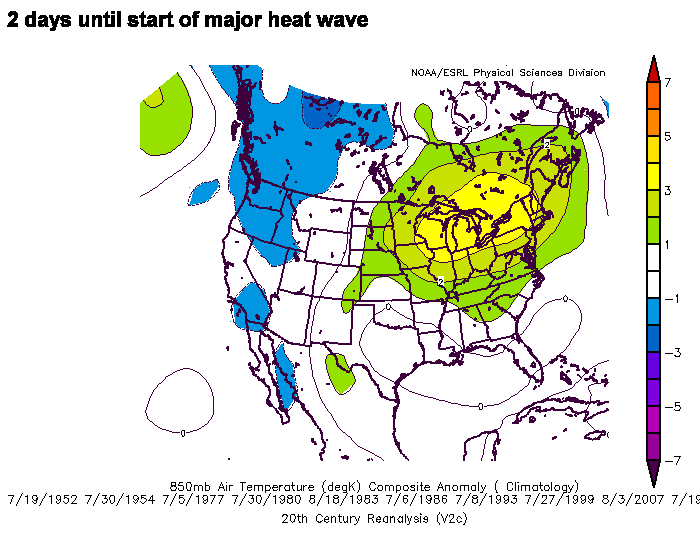
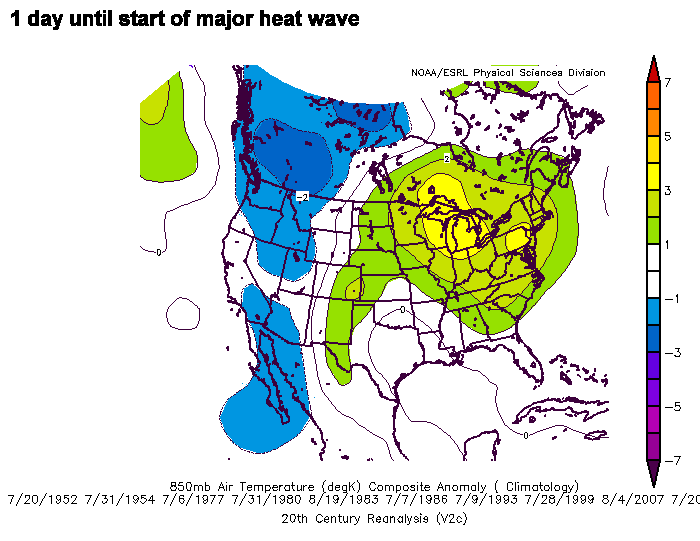
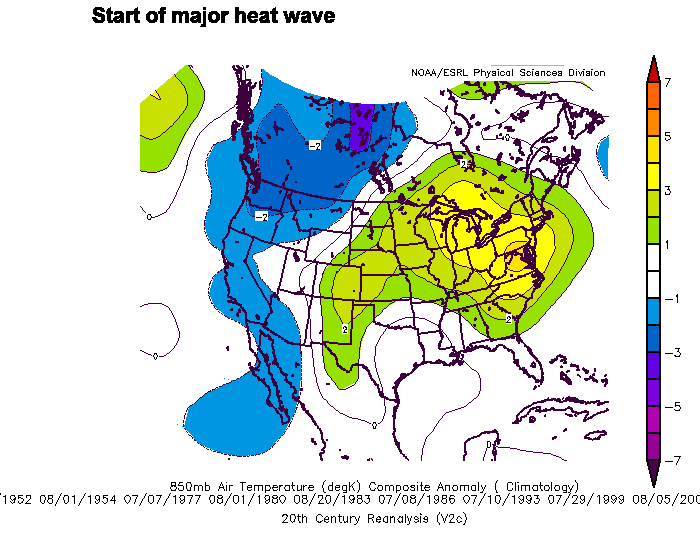
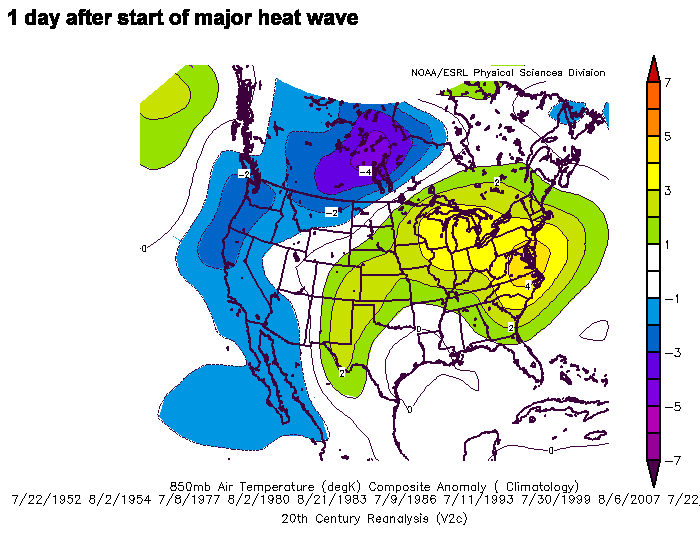
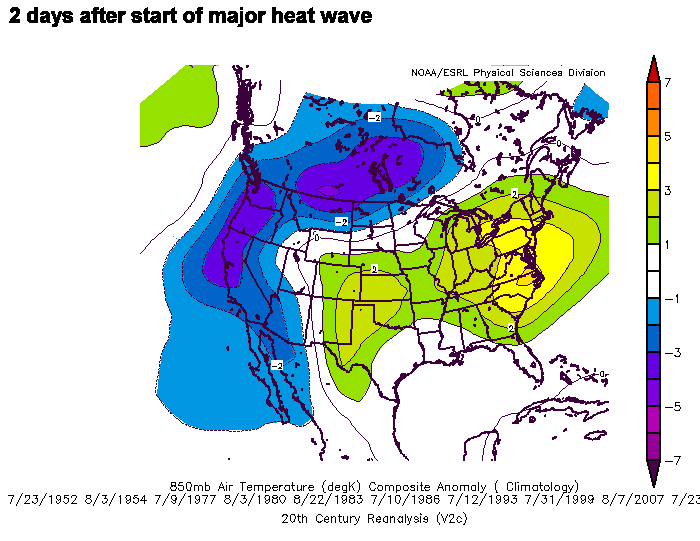
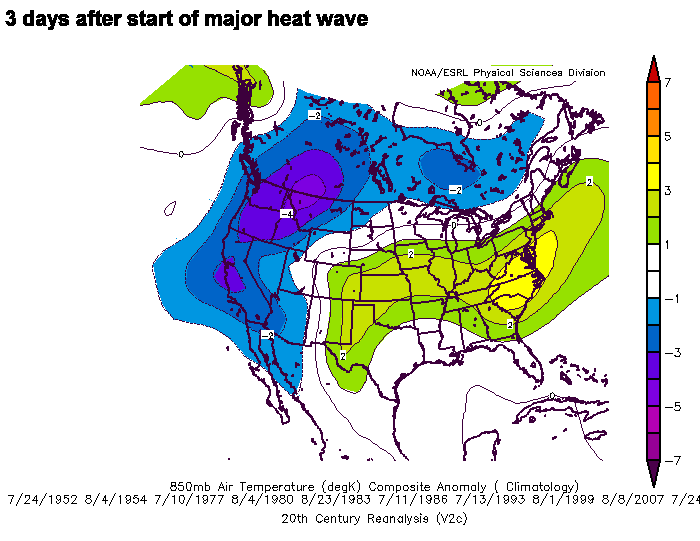
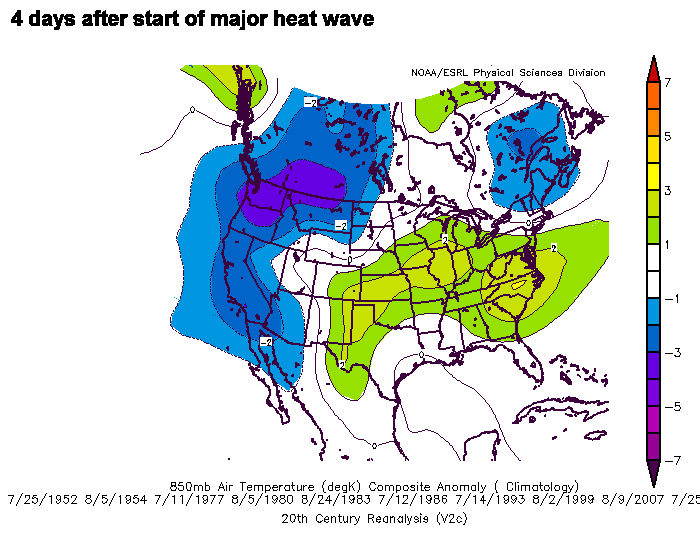
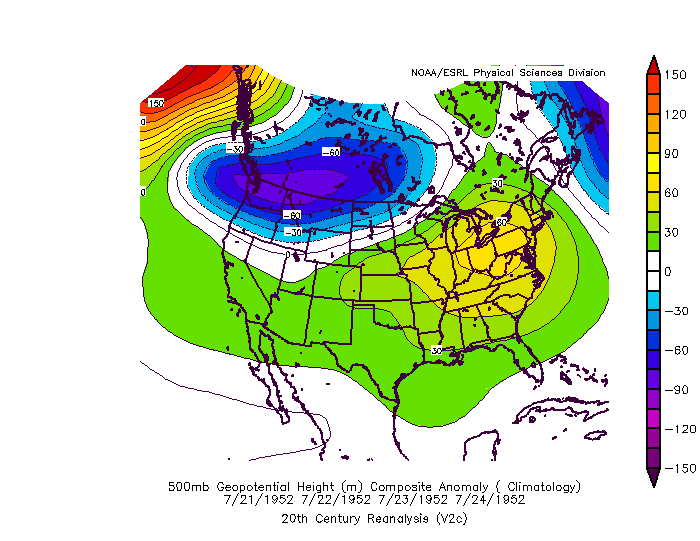
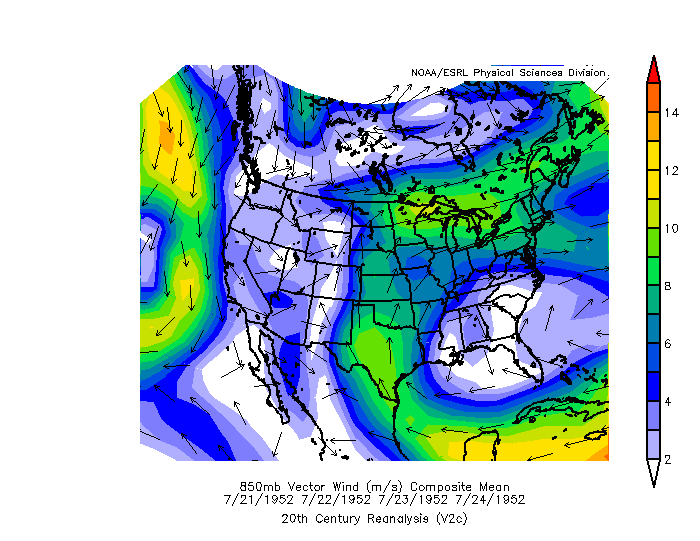
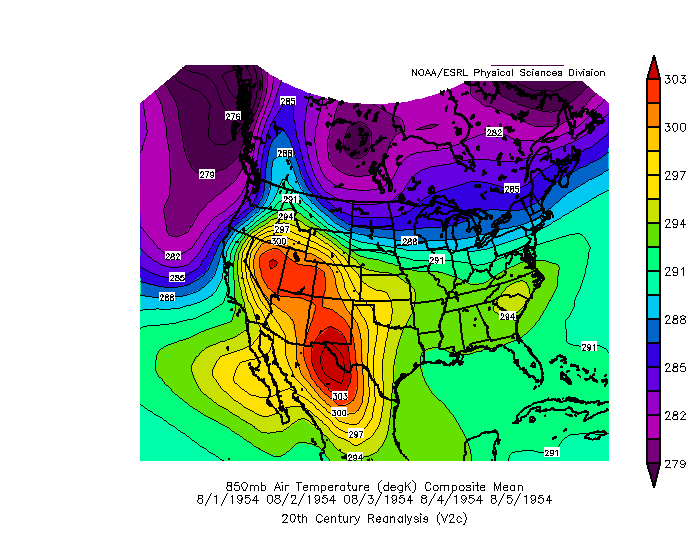
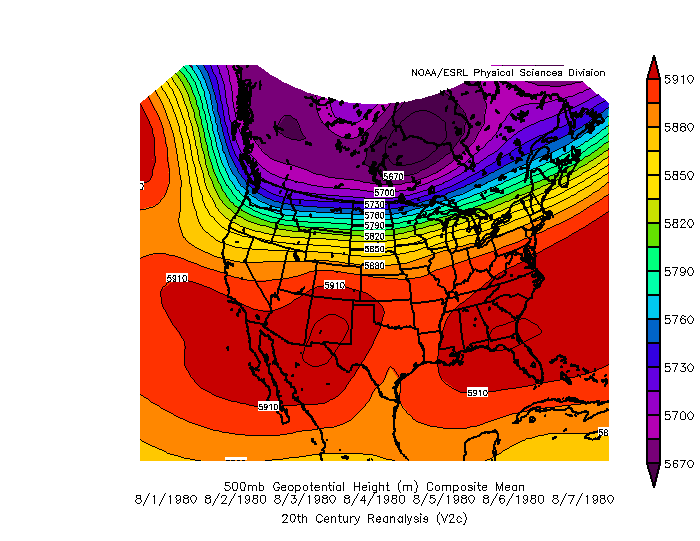
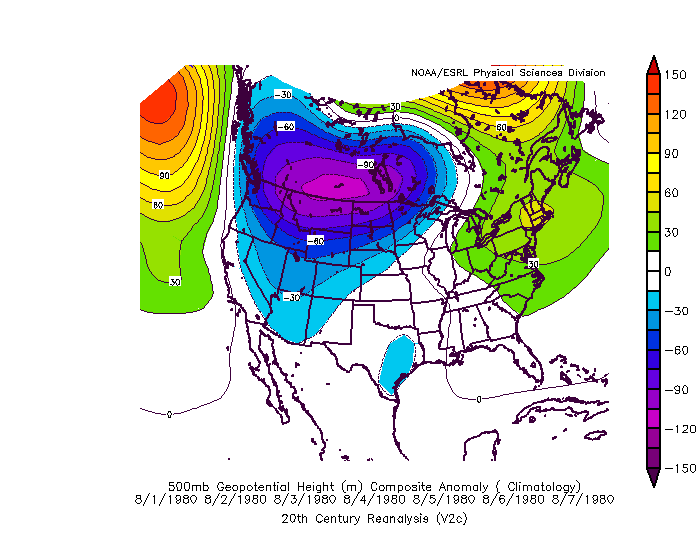
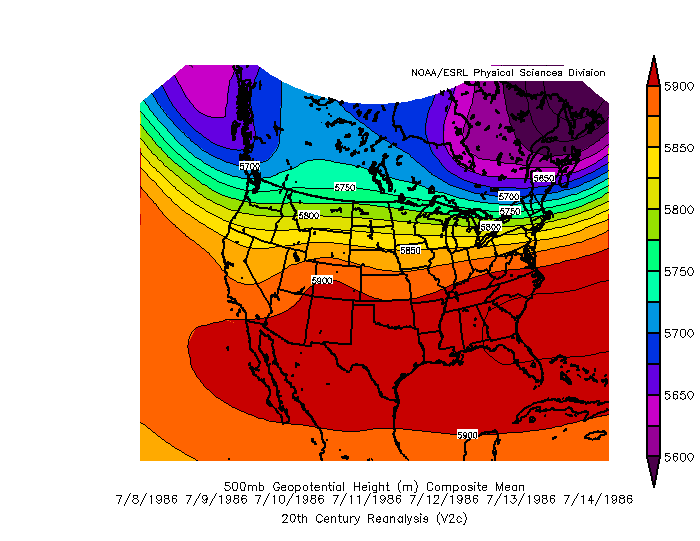
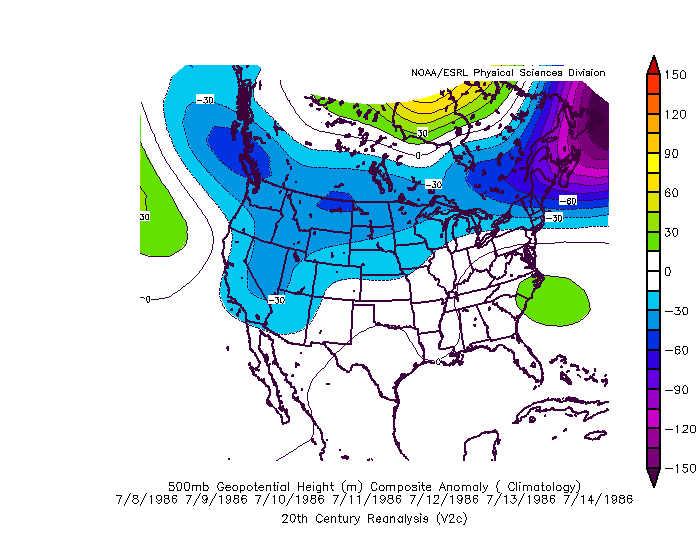
Below are shown composite 850 millibar temperature anomalies leading into the eleven worst heat wave events in North and South Carolina history dating back to 1952. Four days before the heat wave begins, large positive temperature anomalies are noted across Ontario, Canada. This positive temperature anomaly moves southward through the Mid-Atlantic states and into the Carolinas where it remains throughout the duration of the heat event.
|
Composite 500 millibar height anomalies before & during Carolina heat waves |
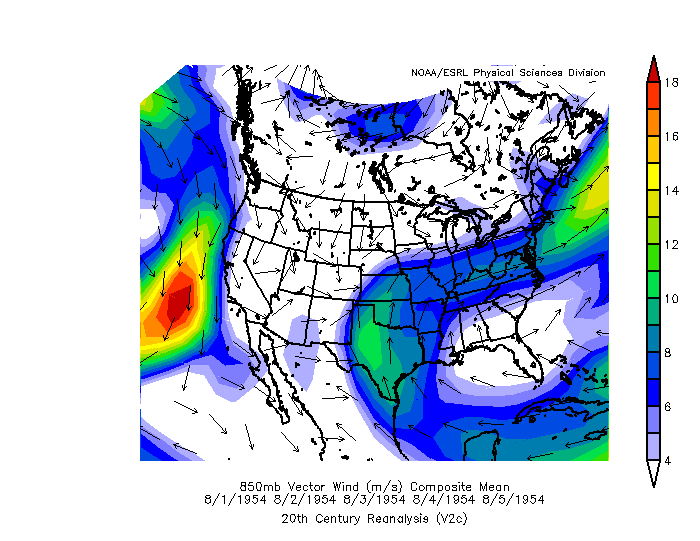
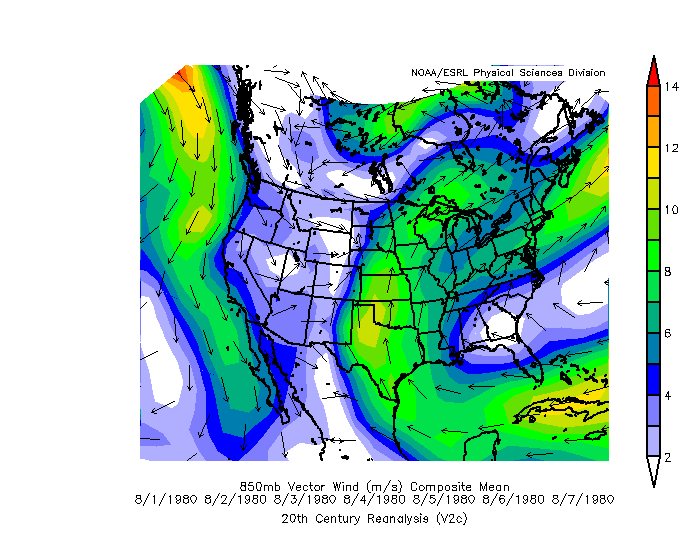
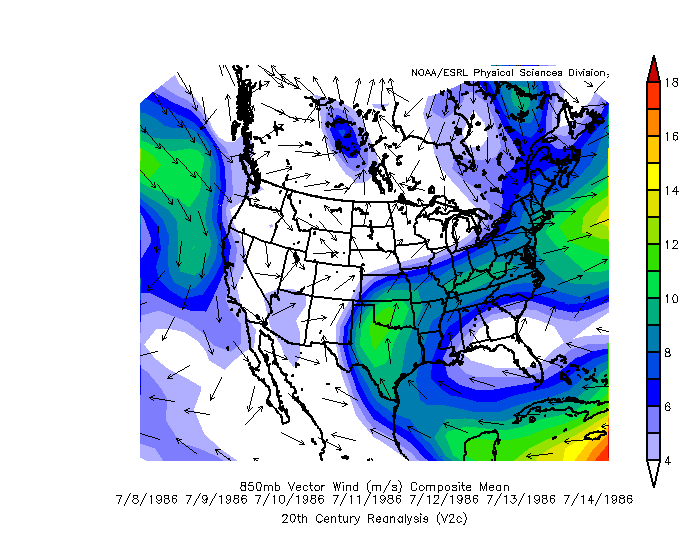
Composite 850 millibar wind anomalies before & during Carolina heat waves |
Here are some of the most significant heat waves to affect the Carolinas, in chronological order:
1952 1954 1977 1980 1983 1986 1993 1999 2007 2011 2012
|
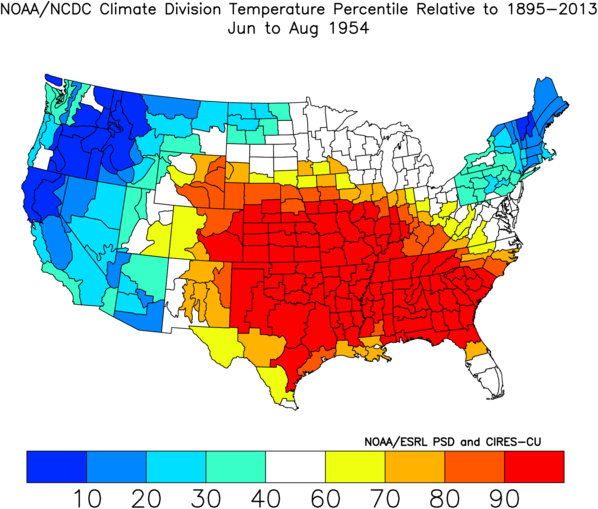
Climate Division Temperature Percentile Rankings: June-July 1952 |
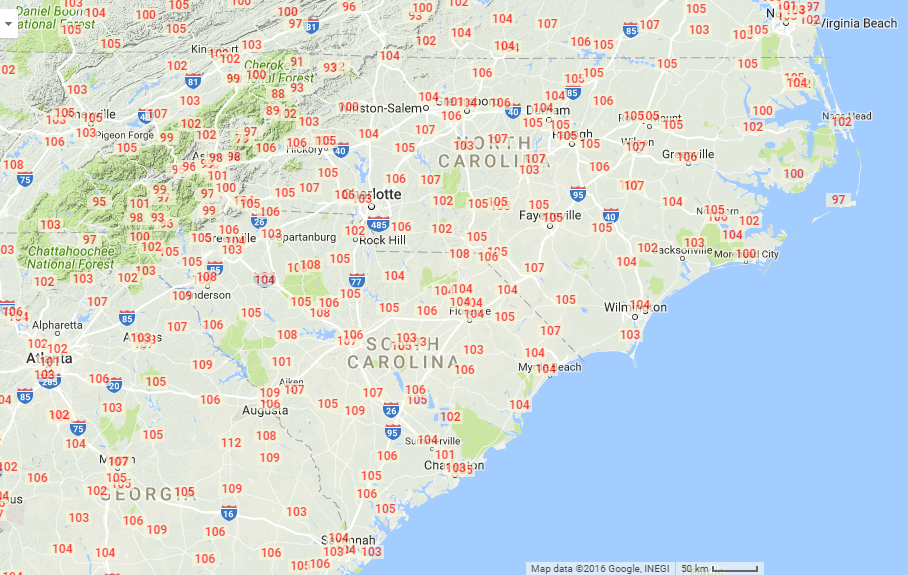
The summer of 1952 was (at the time) the hottest summer ever recorded across the eastern half of the United States. Well above-normal temperatures during most of June became exceptionally hot for the last week of the month as surface high pressure developed across Florida and upper level high pressure centered itself overhead. All-time high temperatures were recorded in a number of locations including Wilmington, NC where the temperature hit 104 degrees on June 27th, 1952, a record that still stands today. New Bern, NC reached 106 degrees on July 22, 1952, setting not just their all-time record high temperature but also their all-time highest daily average temperature of 93.5 degrees. (The morning low was a sticky 81 degrees)
High temperatures were only in the 80s and lower 90s for the first half of July, but the heat wave came roaring back on July 18th. In Florence and Columbia, SC 100+ degree temperatures occurred on 8 out of 11 days from July 20th through July 30th. New Bern, NC recorded its all-time record high temperature of 106 on July 22th, and Hickory, NC set its all-time record high of 105 on July 29th. At least six deaths were blamed on the heat, and agricultural losses to the tobacco crop in North Carolina alone may have approached $10 million. The impact this heat wave had on the people living here is magnified by the fact that very few homes had air conditioning in 1952.
Other all-time record highs established during this event include 103 in Southport, NC; 104 in Winston-Salem, NC; 106 in Marion, NC; 108 in Cheraw, SC; and 109 in Bamberg, SC. Charlotte, NC's morning low of 79 degrees on June 27th is still the warmest low temperature on record for the Queen City.
Highest temperatures observed during the summer 1952 heat wave
| Asheville, NC | 98 | Fayetteville, NC | 105 | Columbia, SC | 107 |
| Hickory, NC | 105* | Wilmington, NC | 104* | Florence, SC | 104 |
| Charlotte, NC | 103 | New Bern, NC | 106* | Myrtle Beach, SC | 104* |
| Greensboro, NC | 101 | Hatteras, NC | 97* | Georgetown, SC | 104 |
| Raleigh, NC | 105* | Greenville-Spartanburg, SC | 104 | Charleston, SC | 101 |
* red highlight indicates all-time record high temperature for this location
|
Highest temperatures observed during the 1952 summer heat wave |
NOAA/ESRL Reanalysis maps (V2c) for the period July 21 through July 24, 1952 |
Additional Reading:
|
|
Just two years after the intense heat of 1952, another historic heat wave developed during the summer of 1954. All-time high temperature records were established including 104 degrees in Charlotte, NC; 106 degrees in Conway, SC; and 108 in Florence, SC. Temperatures over 100 degrees were recorded virtually everywhere across the Carolinas except for the mountains and the Outer Banks. Roxboro, NC got to 104 degrees on July 14th, and Gastonia, NC set its all-time record high of 107 on June 27th. Camden, SC had a sizzling 111 degrees on June 28, 1954, the all-time record high for that town.
Hot weather occurred in multiple periods throughout the summer, separated by periods of near-normal temperatures. Temperatures somewhere in North or South Carolina were above 100 degrees almost every day from June 22nd through July 8th. A second period of sustained hot weather developed July 29th and lasted through August 5th, followed by a third period from August 16th through August 27th. The final 100 degree readings of the year occurred on September 6th with 104 degrees recorded in both Raleigh and Charlotte, NC.
The persistent heat this summer also extended into the Midwest, with all-time record highs established in St. Louis, MO (115 degrees) where 104 heat-related fatalities occurred.
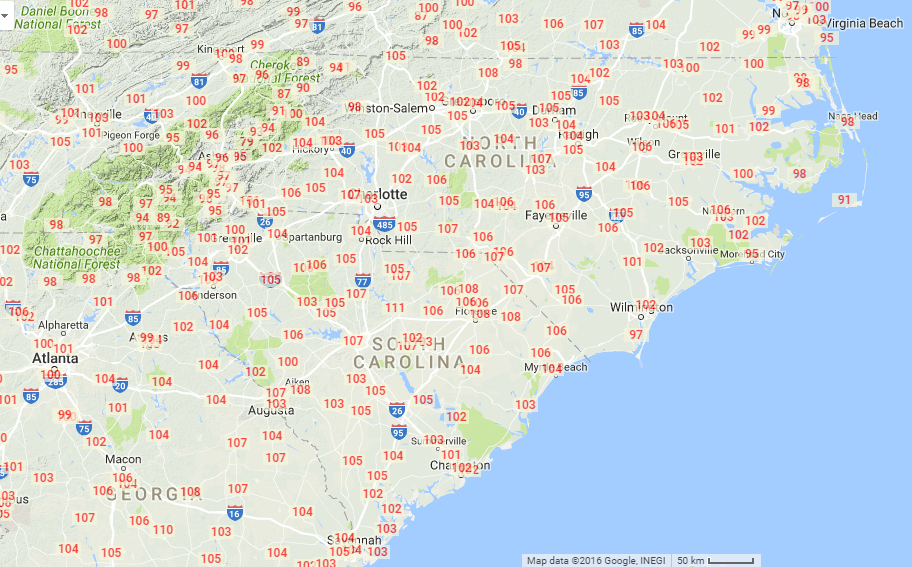
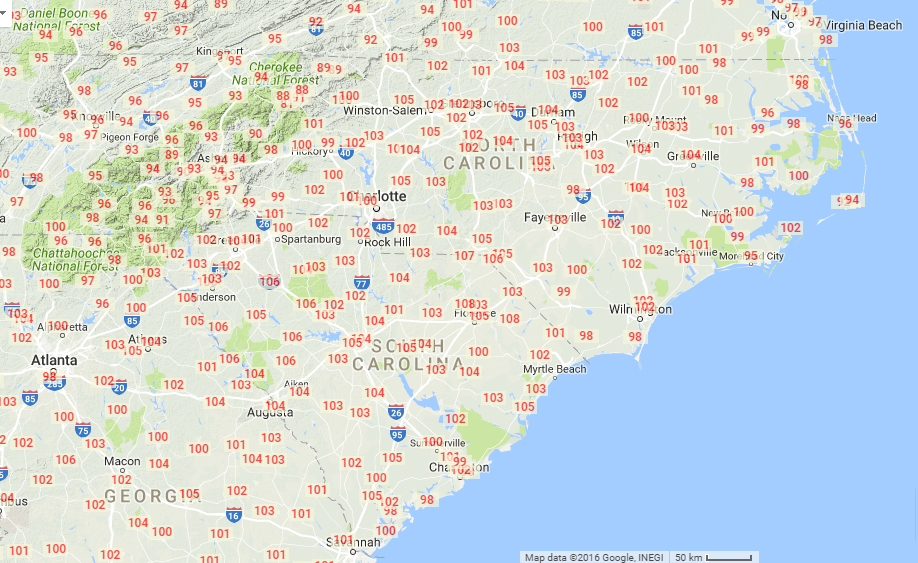
Highest temperatures observed during the summer 1954 heat wave
| Asheville, NC | 96 | Fayetteville, NC | 105 | Columbia, SC | 107 |
| Hickory, NC | 104 | Wilmington, NC | 102 | Florence, SC | 108* |
| Charlotte, NC | 104* | New Bern, NC | 103 | Myrtle Beach, SC | 103 |
| Greensboro, NC | 102 | Hatteras, NC | 91 | Georgetown, SC | 104 |
| Raleigh, NC | 104 | Greenville-Spartanburg, SC | 101 | Charleston, SC | 102 |
* red highlight indicates all-time record high temperature for this location
|
Highest temperatures observed during the 1954 summer heat wave |
NOAA/ESRL Reanalysis maps (V2c) for the period August 1 through August 5, 1954 |
Additional Reading:
|
|
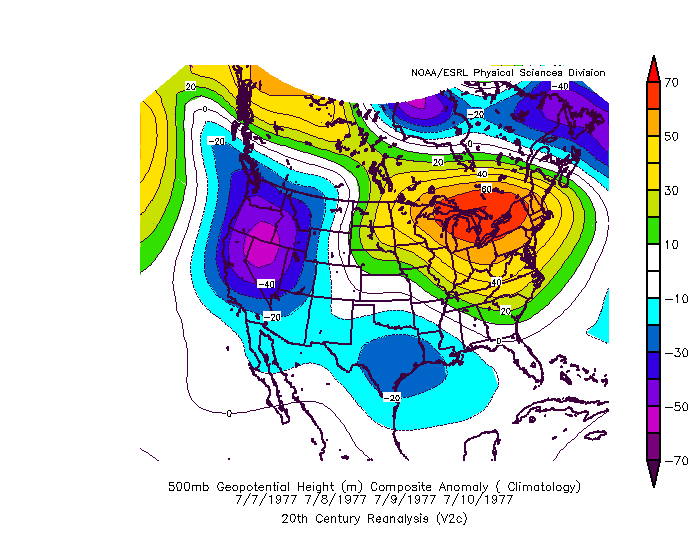
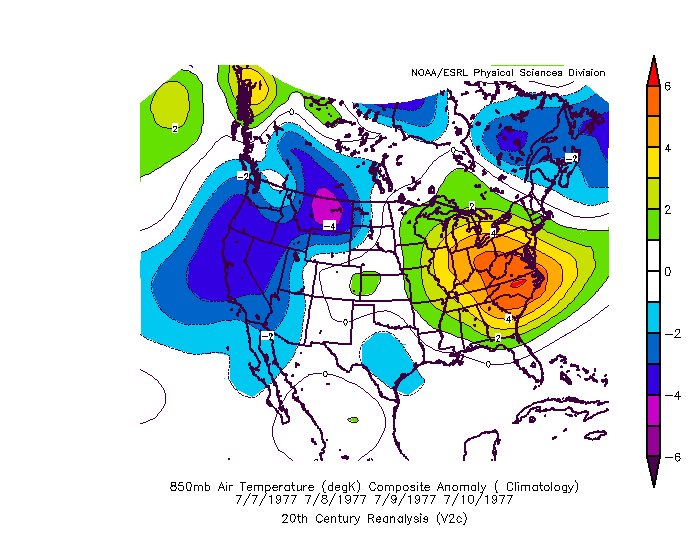
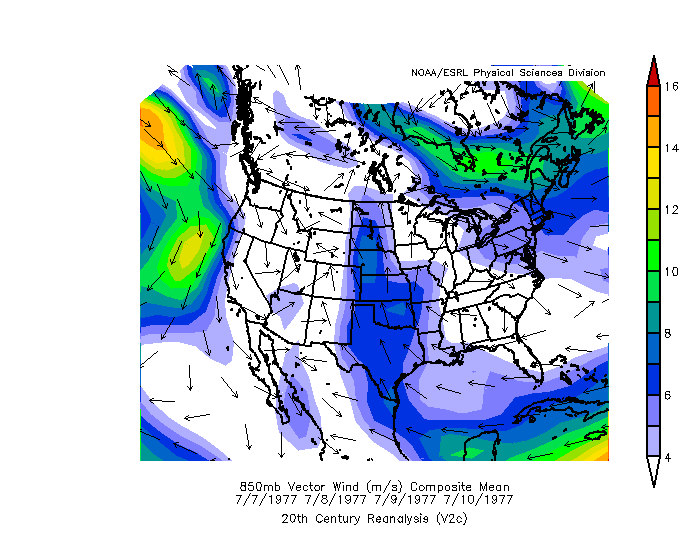
After a period of over 20 years without a significant heat wave, temperatures soared above 100 degrees across most of the Carolinas during July of 1977. Darlington, SC recorded 12 consecutive days with high temperatures at or above 100 degrees from July 5th to July 16th followed by 108 degrees on July 21st, the second hottest recorded in Darlington's history. Burlington and Yadkinville, NC both recorded their all-time record highs of 105 degrees July 8th. Chapel Hill, NC hit 105 on July 9th while in the middle of a string of five consecutive 100+ days. North Carolina's poultry industry suffered heavy losses during this heat wave; many tens of thousands of chickens and turkeys died on farms in Penderlea and Rose Hill, NC. Drought conditions coupled with the high temperatures led to a large fish kill on the Neuse River in eastern North Carolina.
This heat wave wasn't confined to just the Carolinas; exceptionally hot weather was experienced in the Northeast as well. New York City's Central Park recorded 102 degrees on July 19th, then 104 degrees on July 21st. Heat was responsible for at least seven deaths in the St. Louis, MO area.
Interestingly, this heat wave occurred immediately after one of the coldest winters of the 20th century for the eastern half of the United States. The winter of 1976-1977 brought temperatures of 3 to 8 degrees below normal to locations east of the Mississippi River. The average temperature in January 1977 of 35.7 degrees in Wilmington, NC is the coldest recorded for any month in the city's history.
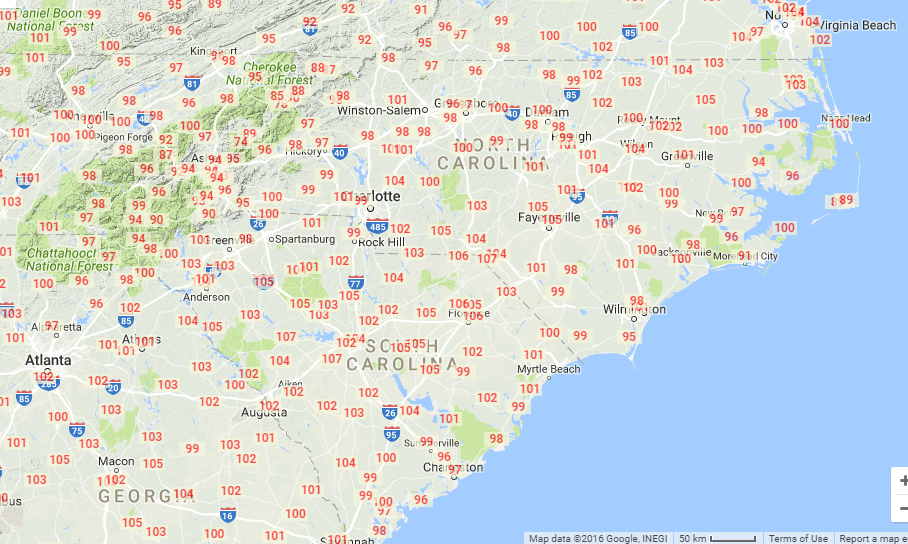
Highest temperatures observed during the July 1977 heat wave
| Asheville, NC | 94 | Fayetteville, NC | 103 | Columbia, SC | 105 |
| Hickory, NC | 99 | Wilmington, NC | 102 | Florence, SC | 105 |
| Charlotte, NC | 100 | New Bern, NC | 100 | Myrtle Beach, SC | 100 |
| Greensboro, NC | 102 | Hatteras, NC | 94 | Georgetown, SC | 105 |
| Raleigh, NC | 103 | Greenville-Spartanburg, SC | 101 | Charleston, SC | 101 |
* red highlight indicates all-time record high temperature for this location
|
Highest temperatures observed during the 1977 July heat wave |
NOAA/ESRL Reanalysis maps (V2c) for the period July 7 through July 10, 1977 |
Additional Reading:
 July 7, 1977: Hot. Washington Burning Too, Sumter, SC Daily Item
|
Climate Division Temperature Percentile Rankings: August 1980 |
Temperatures during the summer of 1980 weren't particularly extreme until the very end of July. High pressure over the Great Lakes on July 26th sunk south into southern Georgia by the 31st and temperatures across the Carolinas soared. Florence, SC recorded eight consecutive days with temperatures 100+ degrees from July 31 through August 7, 1980 -- the longest such string in Florence's history. Pelion, SC recorded its all-time high temperature of 107 on August 1st. This heat wave extended westward from the Carolinas to cover Illinois, Missouri, Kansas and West Texas. Newspaper reports at the time said eight people died in South Carolina with over 900 fatalities nationwide during the summer. However, a post-event analysis by the National Climate Data Center (now NCEI) claims when indirect deaths are considered the final toll could be as high as 10,000 people.
This heat wave was accompanied by dry conditions with rainfall totals well below normal during the spring and summer months. As a whole, 1980 was particularly dry in Greensboro, NC and Florence, SC with annual rainfall totals of only 33.98 and 34.99 inches, respectively, about eight inches below normal. The Hazards and Vulnerability Research Institute at the University of South Carolina calculates the 1980 drought and heat wave caused $20 billion in agricultural damage with the most significant losses across the Plains states.
The second half of August 1980 turned refreshingly cool across the Carolinas with temperatures averaging a few degrees below normal after August 15th.
Highest temperatures observed during the August 1980 heat wave
| Asheville, NC | 94 | Fayetteville, NC | 105 | Columbia, SC | 102 |
| Hickory, NC | 97 | Wilmington, NC | 101 | Florence, SC | 106 |
| Charlotte, NC | 99 | New Bern, NC | 99 | Myrtle Beach, SC | 96 |
| Greensboro, NC | 96 | Hatteras, NC | 89 | Georgetown, SC | 99 |
| Raleigh, NC | 98 | Greenville-Spartanburg, SC | 98 | Charleston, SC | 96 |
* red highlight indicates all-time record high temperature for this location
|
Highest temperatures observed during the August 1980 heat wave |
NOAA/ESRL Reanalysis maps (V2c) for the period August 1 through August 7, 1980 |
Additional Reading:
|
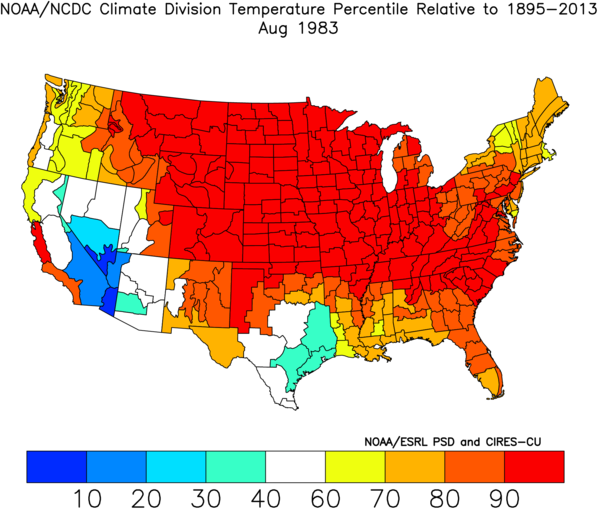
Climate Division Temperature Percentile Rankings: August 1983 |
The late spring and summer of 1983 the Carolinas experienced low rainfall totals and worsening drought conditions. Average rainfall across North Carolina was some of the lowest on record in July. Temperatures soared well into the 90s August 17th and 18th, beginning a severe heat wave that would last for a solid week. The worst of the heat wave occurred from August 20th through 23rd when most Piedmont locations had high temperatures above 100 degrees for four consecutive days.
The Fayetteville, NC airport recorded a high temperature of 110 degrees on August 21, 1983, establishing a new record for the highest temperature ever recorded in the state of North Carolina. The North Carolina State Climate Office has a scan of Fayetteville's official observation form for that historic day, showing 109 on two hourly observations (3 pm and 4 pm) and a remark on the 8 pm observation that the day's high temperature reached 110 degrees.
Pageland, SC set its all-time record high of 106, and Newberry, SC set its all-time record high of 108 on August 21, 1983. Extreme heat wasn't limited to just the Piedmont and Coastal Plain; Asheville, NC reached 100 degrees, the hottest ever recorded in that mountain city. North Wilkesboro in the North Carolina foothills reached 102 degrees and established a new all-time record high. Caesar's Head, SC, at nearly 3,000 feet elevation in northern Greenville County, SC, reached 99 degrees on August 21st to set their all-time record high. Hickory, NC's morning low of 79 degrees and Asheville's low of 75 degrees on July 22nd are the warmest daily low temperatures ever recorded in both cities.
Impacts from the heat included at least 15 fatalities across the nation, the loss of 600,000 domestic turkeys in North Carolina and 900,000 chickens in Georgia, and all-time high electrical usage on both the Duke Power and Carolina Power & Light systems.
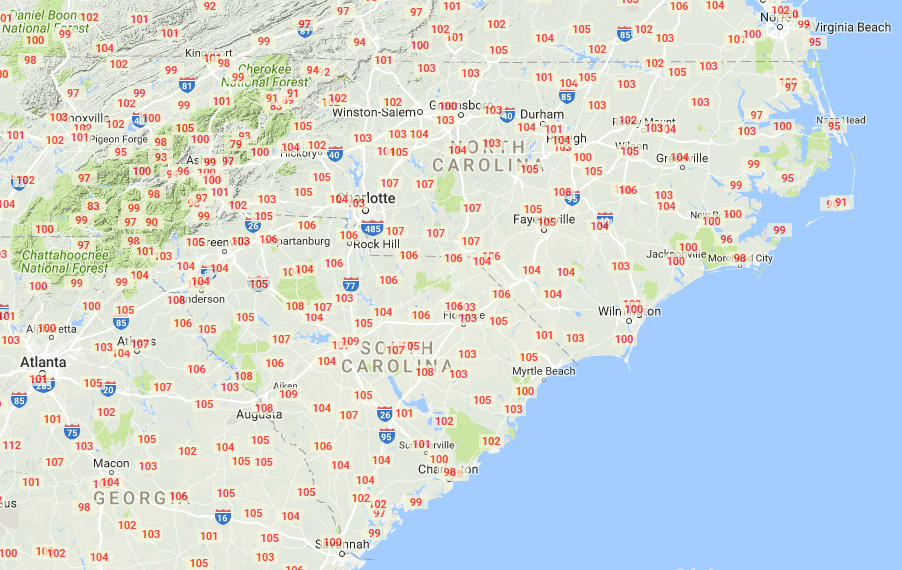
Highest temperatures observed during the August 1983 heat wave
| Asheville, NC | 100* | Fayetteville, NC | 110* | Columbia, SC | 107 |
| Hickory, NC | 102 | Wilmington, NC | 100 | Florence, SC | 103 |
| Charlotte, NC | 103 | New Bern, NC | 100 | Myrtle Beach, SC | 100 |
| Greensboro, NC | 100 | Hatteras, NC | 90 | Georgetown, SC | 103 |
| Raleigh, NC | 101 | Greenville-Spartanburg, SC | 103 | Charleston, SC | 100 |
* red highlight indicates all-time record high temperature for this location
|
Highest temperatures observed during the August 1983 heat wave |
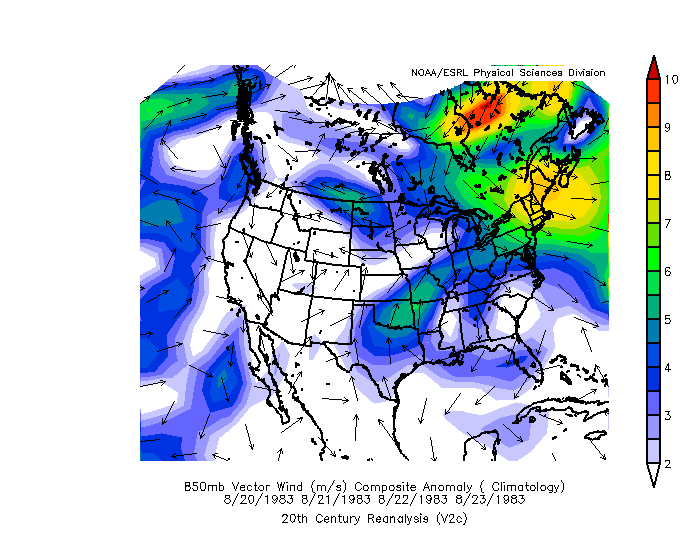
NOAA/ESRL Reanalysis maps (V2c) for the period August 20 through August 23, 1983 |
Additional Reading:
Eagle.png) State Climate Office of North Carolina: Our History of Record Heat, including Fayetteville record temperature
State Climate Office of North Carolina: Our History of Record Heat, including Fayetteville record temperature
|
|
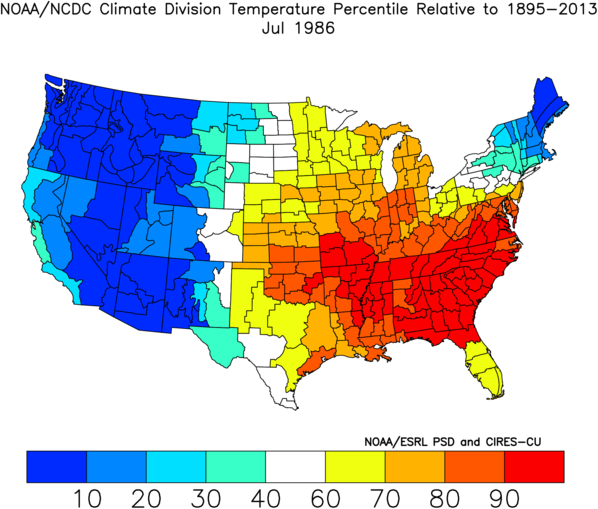
The winter of 1985-1986 was very dry across the Southeastern United States, particularly in North Carolina where it was the driest winter of the 20th century. Drought conditions intensified during the spring and into the summer months, helping create one of the most extreme periods of historic drought for farmers across the Carolinas, Georgia and east Tennessee. When extreme heat developed in July, people, animals, and crops were not able to easily withstand the combination of heat and extreme drought. An historic wildfire swept through the Holly Shelter Swamp in Pender County in May, 1986, scorching over 70,000 acres.
Manning, SC reached 100 degrees a remarkable 23 times in July of 1986. Columbia, SC hit 100 degrees 15 times that month, including all but two days between July 7th and July 21st. Florence, SC hit 100 degrees 11 times in July, the most ever recorded in a single month there. Even along the coast in Charleston, SC the thermometer reached 100 degrees on 11 different days that month. Charleston also set a new all-time record high temperature of 104 degrees on July 19th, only to tie it the very next day. (This record would stand for only 13 years until broken by a 105 degree temperature on August 1, 1999) Charlotte, NC reached 100 degrees on nine days, while Fayetteville, NC hit 100 six times. In Georgia, Savannah set a new all-time record high of 105 on July 20, 1986, topping off a brutal month where the temperature reached 100 degrees on 10 different days.
At least 22 people died from this heat wave. Water conservation orders were issued from many cities and municipalities across the area, mainly in North Carolina. Hay from Midwestern farmers was sent by train, truck, and even by U.S. Air Force cargo planes to needy farmers across the Carolinas who were unable to grow grass for their livestock in parched fields.
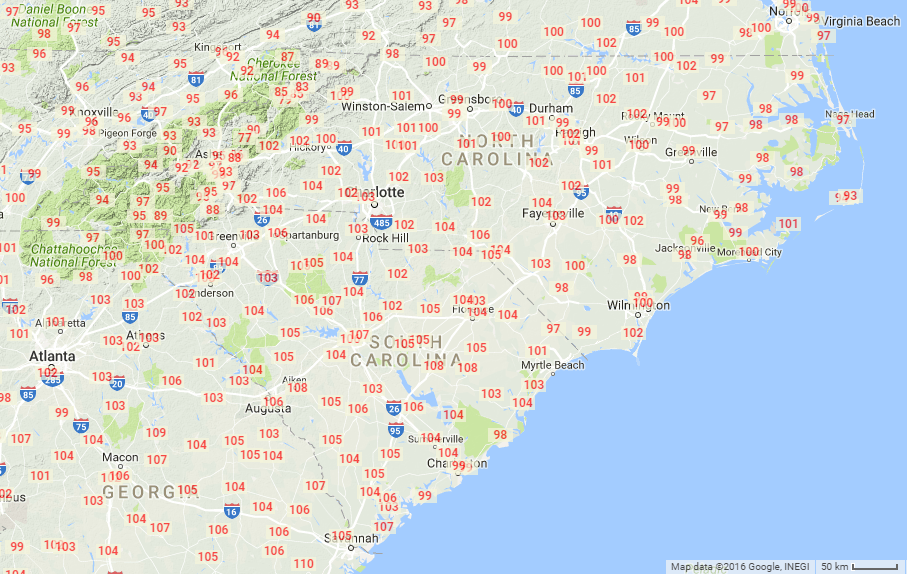
Highest temperatures observed during the July 1986 heat wave
| Asheville, NC | 94 | Fayetteville, NC | 103 | Columbia, SC | 106 |
| Hickory, NC | 100 | Wilmington, NC | 100 | Florence, SC | 104 |
| Charlotte, NC | 103 | New Bern, NC | 99 | Myrtle Beach, SC | 102 |
| Greensboro, NC | 99 | Hatteras, NC | 94 | Georgetown, SC | 104 |
| Raleigh, NC | 99 | Greenville-Spartanburg, SC | 103 | Charleston, SC | 104 |
* red highlight indicates all-time record high temperature for this location
|
Highest temperatures observed during the July 1986 heat wave |
NOAA/ESRL Reanalysis maps (V2c) for the period July 8 through July 14, 1986 |
Additional Reading:
Citizen.png)
|
|
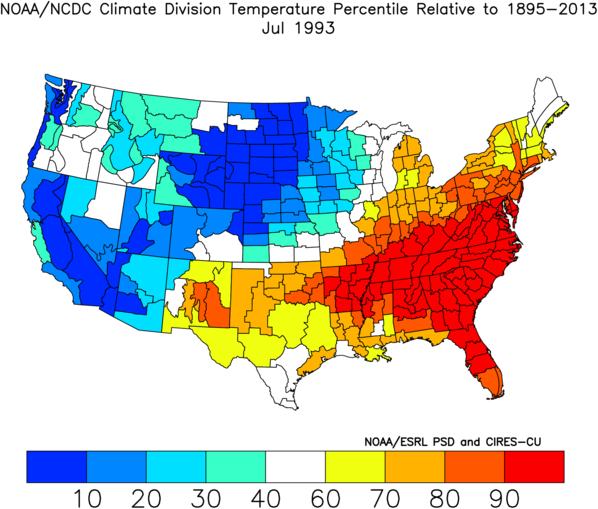
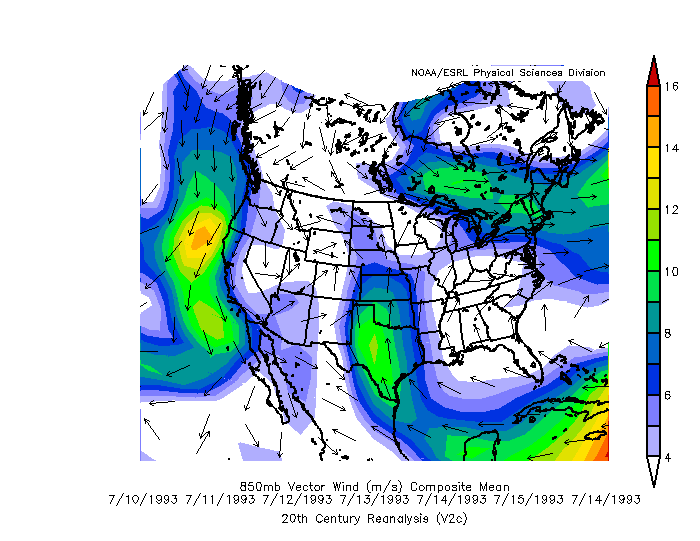
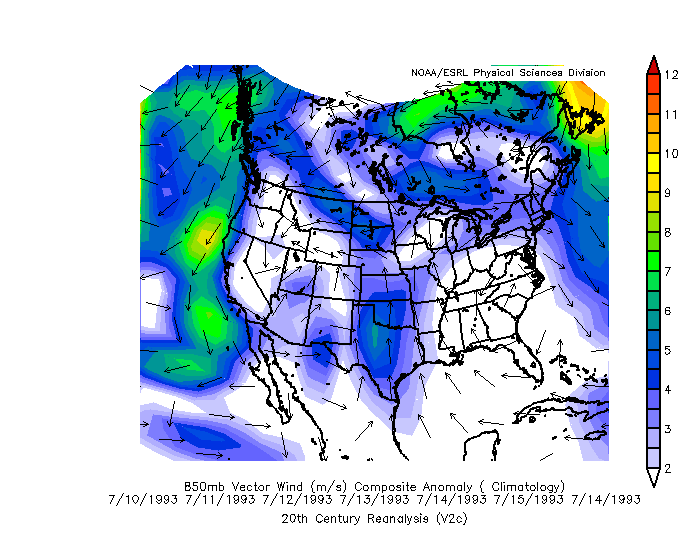
Rainfall across much of the Southeastern United States was well below normal during June and July of 1993. According to research from the National Climatic Data Center, July rainfall across the region was the second lowest since 1895. This can be attributed to unusually strong and persistent Bermuda High Pressure just off the Southeast coast. Along the western periphery of this high, very heavy rainfall occurred across the center of the nation with record river flooding observed along the Mississippi and Missouri Rivers and their tributaries.
Persistent Bermuda High pressure suppressed clouds and thunderstorms and allowed heat to build; July of 1993 became the hottest July ever observed in Florence, SC with an average monthly temperature 86.6 degrees, and in Charlotte, NC where the monthly average temperature was 85.4 degrees, 6.3 degrees above normal. July monthly average temperature records were also broken in Savannah, GA (86.7 degrees); Orangeburg, SC (84.6 degrees); Greenville-Spartanburg, SC (83.2 degrees); Hickory, NC (82.0 degrees); Greensboro, NC (81.3 degrees); Asheville, NC (78.0 degrees); and Mt. Mitchell, NC (64.1 degrees) at an elevation of 6,240 feet. In Wilmington, NC, July 1993 produced the hottest average temperature ever seen at the time, but that record has since been superseded by the heat of July 2012.
The South Carolina towns of Saluda and Newberry both recorded 100 degree or hotter temperatures on 20 days in July 1993. Florence and Darlington, SC both had 10 days with temperatures at or above 100 degrees. The heat and drought made conditions favorable for wildfires; over 2,000 acres burned in the Holly Shelter Swamp in Pender County, NC, and over 600 wildfires were reported to officials across the state of South Carolina in just the first half of July.
Agricultural losses exceeded one billion dollars, with a human death toll of over 100 across the eastern United States.
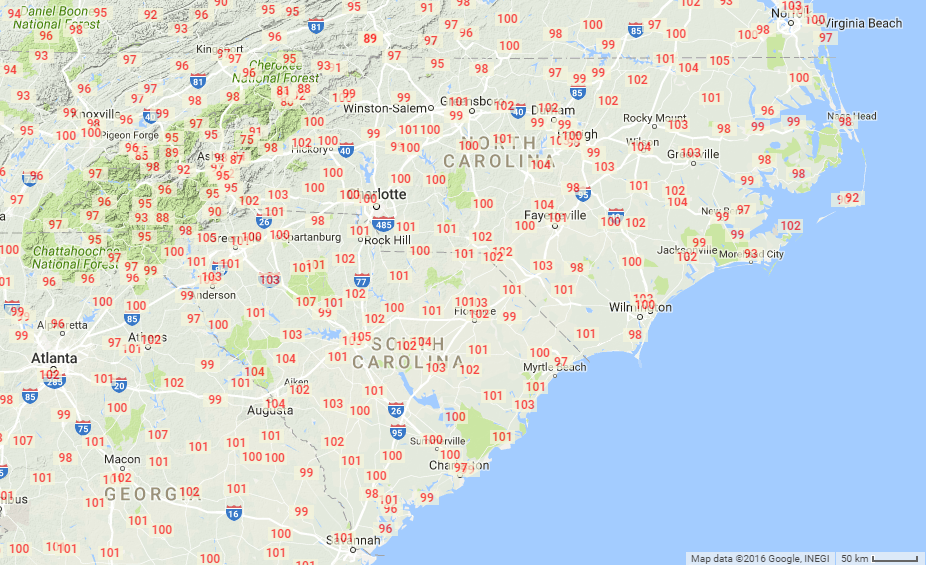
Highest temperatures observed during the July 1993 heat wave
| Asheville, NC | 95 | Fayetteville, NC | 101 | Columbia, SC | 103 |
| Hickory, NC | 100 | Wilmington, NC | 100 | Florence, SC | 102 |
| Charlotte, NC | 100 | New Bern, NC | 101 | Myrtle Beach, SC | 97 |
| Greensboro, NC | 101 | Hatteras, NC | 92 | Georgetown, SC | 103 |
| Raleigh, NC | 99 | Greenville-Spartanburg, SC | 100 | Charleston, SC | 100 |
* red highlight indicates all-time record high temperature for this location
|
Highest temperatures observed during the July 1993 heat wave |
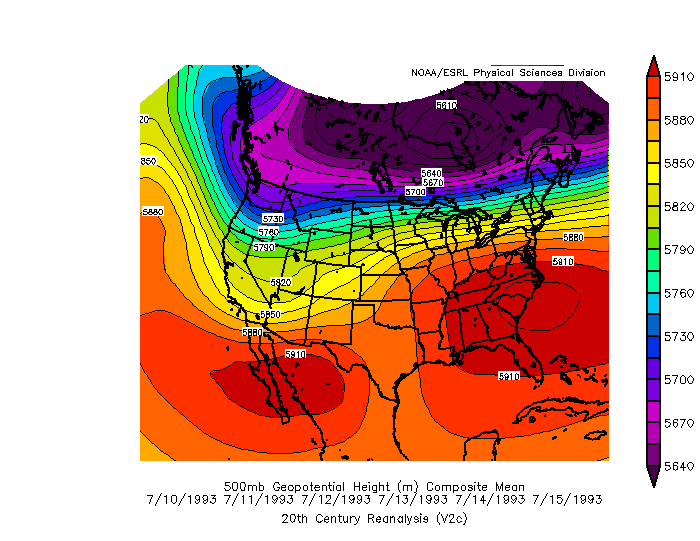
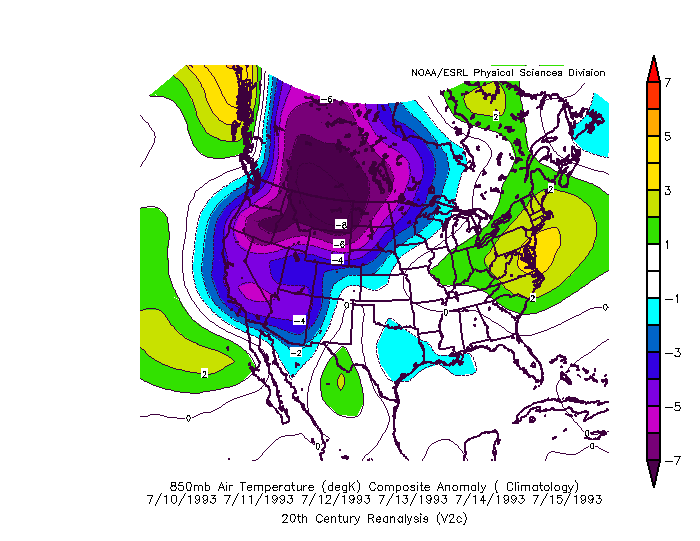
NOAA/ESRL Reanalysis maps (V2c) for the period July 10 through July 15, 1993 |
Additional Reading:
|
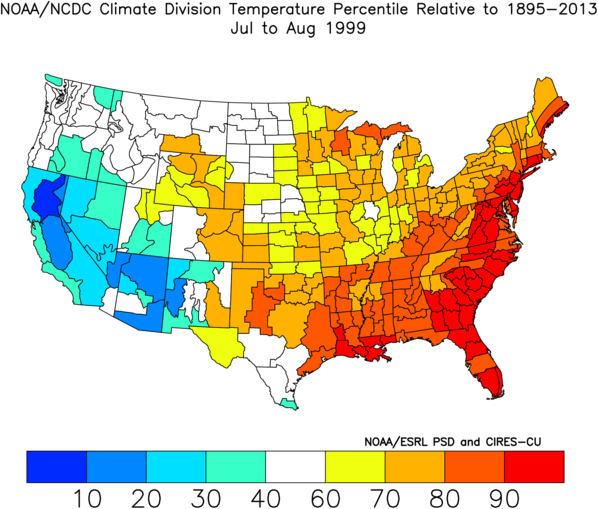
Climate Division Temperature Percentile Rankings: July-August 1999 |
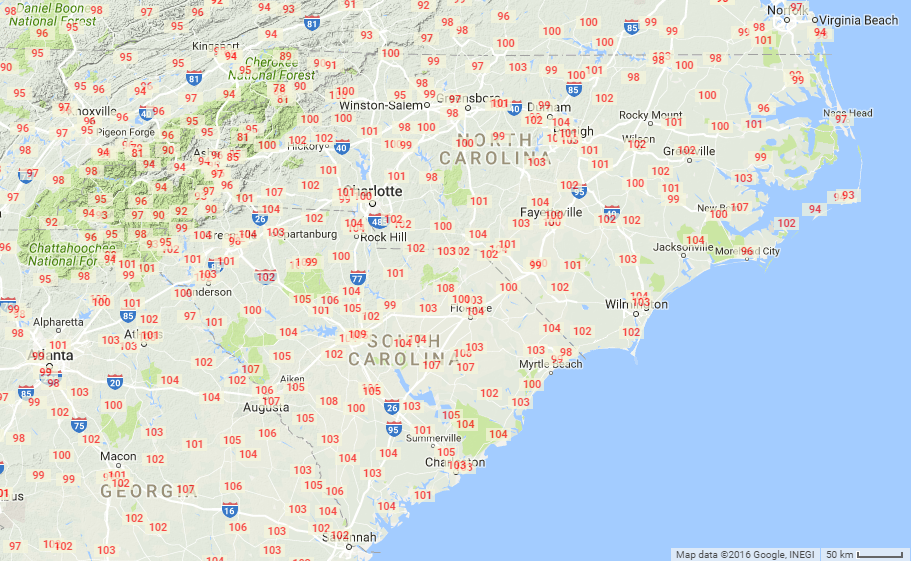
Blistering heat developed across the Carolinas during this final heat wave of the 20th century. During this event, the upper level ridge developed across the lower Mississippi Valley and retreated for a time into the Southwestern United States, a position farther west than is typically observed during our worst heat waves. The airmass was still exceptionally hot, and with westerly downsloping winds over the Appalachians, temperatures reached 108 in Hartsville and Cades, SC. The 105 degree temperatures that developed in Charleston, SC on August 1st broke the all-time record for heat in that coastal city. Temperatures also reached 105 in Orangeburg and Newberry, SC. In Kingstree, SC temperatures reached or exceeded 100 degrees for 10 consecutive days from July 24th through August 2nd.
In addition to very hot daytime highs, overnight lows were exceedingly warm during this heat wave; Sullivans Island, SC recorded a daily low temperature of 84 degrees on August 1st! Wilmington, NC's high and low temperatures of 103 and 83 degrees on August 1st average out to 93 degrees -- the warmest average daily temperature in the Port City's history. Charleston, SC also had its hottest average temperature in history on August 1st, 93 degrees, after a high and low measured at the airport of 105 and 81, respectively. The downtown weather station at the harbor in Charleston had a morning low of 86 degrees that same day, the warmest ever recorded there.
The Mt. Mitchell, NC weather station, at 6,240 feet elevation, reached 81 degrees on August 1st and established a new all-time high temperature for that location.
This heat wave also affected the Mid-Atlantic and Northeastern United States. Temperatures exceeded 100 degrees from Richmond, VA through Baltimore and into Newark, NJ.
Highest temperatures observed during the Summer 1999 heat wave
| Asheville, NC | 95 | Fayetteville, NC | 100 | Columbia, SC | 104 |
| Hickory, NC | 102 | Wilmington, NC | 103 | Florence, SC | 104 |
| Charlotte, NC | 100 | New Bern, NC | 100 | Myrtle Beach, SC | 99 |
| Greensboro, NC | 97 | Hatteras, NC | 93 | Georgetown, SC | 103 |
| Raleigh, NC | 104 | Greenville-Spartanburg, SC | 104 | Charleston, SC | 105* |
* red highlight indicates all-time record high temperature for this location
|
Highest temperatures observed during the Summer 1999 heat wave |
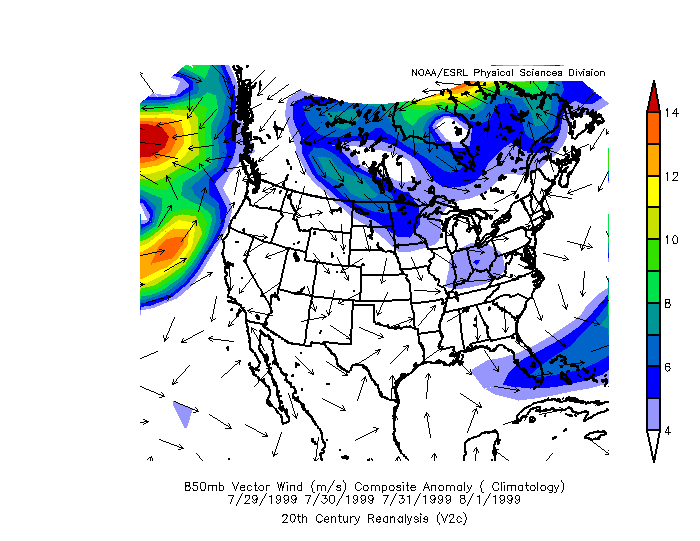
NOAA/ESRL Reanalysis maps (V2c) for the period July 29 through August 1, 1999 |
Additional Reading:
|
Climate Division Temperature Percentile Rankings: August 2007 |
The summer of 2007 was shaping up to be a mild one. Summer temperatures up through the end of July had averaged about a degree below normal, and only a few of the normally-hot stations in the Sandhills had reached 100 degrees even once the entire year. Florence, SC's hottest temperature during the month of July had only been 94 degrees, the coolest July monthly maximum temperature recorded since 1982.
This all changed abruptly during the first few days of August as a large ridge of high pressure built over the eastern third of the Nation. Temperatures soared well into the 90s and 100s across almost all of North and South Carolina for three solid weeks, with all-time records for heat tied or broken in a number of locations. Rocky Mount, NC set a new all-time high temperature record on August 9th with 106 degrees. Hamlet, NC reached an astounding 108 degrees on the same day, the hottest ever recorded in that town. Both Charlotte and Raleigh tied their all-time high temperature records during this heat wave with 104 and 105 degrees, respectively.
The National Climatic Data Center stated that more than 51 deaths, including 2 in South Carolina, were attributable to this heat wave. Severe to exceptional drought across the Southeast led to soil moisture values in the 1-2 percentile levels, extremely dry. The National Drought Monitor classified nearly all of North Carolina and northern South Carolina in extreme drought (D3) by the beginning of September. Research by Fuhrmann et al. (2011) at the Southeast Regional Climate Center shows that very dry soil can intensify a heat wave since a large proportion of the sun's energy turns into sensible heat with very little energy "wasted" on evaporating moisture normally present in the upper soil column. This also makes sense as many of our major Carolina heat waves have developed within a preexisting drought.
A number of stations across the Carolinas recorded their warmest-ever daily average temperatures during this heat wave including 90.5 degrees in Greensboro, NC (after an all-time warm low temperature of 80 degrees), 91.0 degrees in Raleigh, NC, and 93.5 degrees on Fayetteville, NC, all on August 9, 2007. Columbia, SC recorded its hottest daily average temperature of 93.0 degrees on August 10, 2007. Daily average temperatures are calculated by a simple mathematical average of that day's high and low temperatures. NWS Raleigh estimates maximum heat index values may have exceeded 120 degrees across portions of the North Carolina coastal plain.
Customers of the Tennessee Valley Authority set a new record for weekly power consumption (4,400 GW-hours) during this heat wave. Progress Energy Carolinas (now part of Duke Energy) reported record-high instantaneous power usage on their network of 12,656 MW.
Highest temperatures observed during the August 2007 heat wave
| Asheville, NC | 94 | Fayetteville, NC | 107 | Columbia, SC | 107 |
| Hickory, NC | 104 | Wilmington, NC | 98 | Florence, SC | 106 |
| Charlotte, NC | 104* | New Bern, NC | 101 | N. Myrtle Beach, SC | 94 |
| Greensboro, NC | 101 | Hatteras, NC | 91 | Georgetown, SC | 101 |
| Raleigh, NC | 105* | Greenville-Spartanburg, SC | 105 | Charleston, SC | 99 |
* red highlight indicates all-time record high temperature for this location
|
Highest temperatures observed during the August 2007 heat wave |
NOAA/ESRL Reanalysis maps (V2c) for the period August 5 through August 10, 2007 |
Additional Reading:
|
Climate Division Temperature Percentile Rankings: Summer 2011 |
The summer of 2011 was, at the time, the second hottest summer on record for the continental United States. According to records tabulated by the National Climatic Data Center, 2011's summer temperatures were exceeded only by those in 1936. Persistent high pressure helped maintain the heat across large sections of the central and eastern U.S. Reuters news service reported 22 people were killed by the heat during a single week in July 2011.
In the Carolinas, this heat wave occurred in two distinct episodes, punctuated by a period of typical summertime temperatures. During the first portion of the heat wave in June, high temperatures rose into the upper 90s and 100s for a solid week including back-to-back 100 degree days in Florence and Columbia, SC. Chesterfield, SC hit 103 degrees on June 22nd. This initial portion of the heat wave subsided by June 24th, however heat returned during the middle of July when temperatures rose into the 100s on five days in Wilmington, NC, the most number of 100 degree temperatures ever recorded in a single month. The community of Johnston, SC (near Edgefield) had 100+ degree temperatures on eleven days in July! Nighttime lows were also extremely warm, including an 82 degree low in Columbia, SC and an 83 degree low in Charleston, SC on August 4th, the warmest low temperatures ever recorded in these two cities.
The persistent ridge of high pressure across the area helped create drought conditions. The National Drought Monitor classified much of Georgia and the coastal Carolinas in severe to extreme drought (D2 to D4) as rainfall deficits increased throughout the summer. Several large wildfires developed including the Juniper Road fire in the Holly Shelter Swamp (Pender County, NC) which burned over 30,000 acres, and the Simmon's Road fire in Bladen County, NC which burned 5,400 acres.
The weather station on the NC State University campus in Raleigh recorded a temperature of 107 degrees on July 29th, 2011, setting a new all-time record high for this location. Weather records from the NC State campus date back to 1892. July's heat bled into August with widespread temperatures in the 90s and 100s recorded all the way up through August 12th.
Highest temperatures observed during the summer 2011 heat wave
| Asheville, NC | 92 | Fayetteville, NC | 105 | Columbia, SC | 104 |
| Hickory, NC | 95 | Wilmington, NC | 102 | Florence, SC | 102 |
| Charlotte, NC | 98 | New Bern, NC | 102 | N. Myrtle Beach, SC | 98 |
| Greensboro, NC | 97 | Hatteras, NC | 94 | Georgetown, SC | 102 |
| Raleigh, NC | 104 | Greenville-Spartanburg, SC | 105 | Charleston, SC | 102 |
* red highlight indicates all-time record high temperature for this location
|
Highest temperatures observed during the Summer 2011 heat wave |
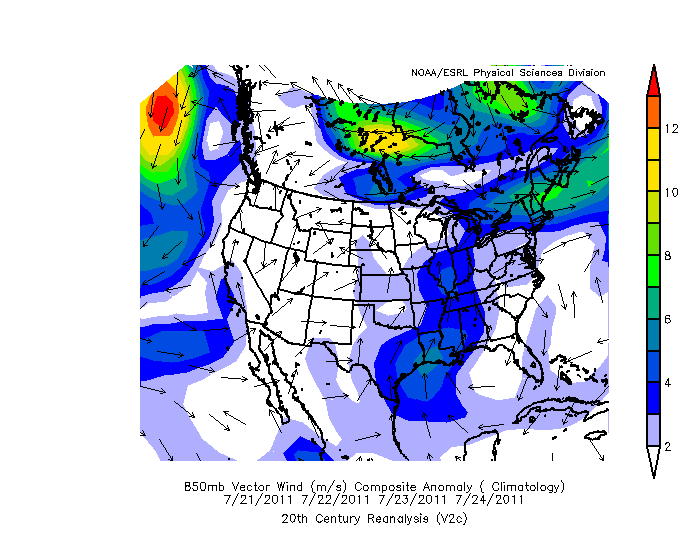
NOAA/ESRL Reanalysis maps (V2c) for the period July 21 through July 24, 2011 |
Additional Reading:
|
Climate Division Temperature Percentile Rankings: June-July 2012 |
One of the most widespread heat waves in recorded history affected most of the United States during June and July 2012. This heat wave was responsible for at least 82 reported deaths while breaking thousands of high temperature records from Colorado all the way to the East Coast. The worst portion of this heat wave developed across the Carolinas June 29th through July 9th, with another surge of extreme heat July 22nd through the 29th.
The campus of the University of South Carolina at Columbia registered a temperature of 113 degrees on June 29th, establishing a new all-time high temperature record for the state of South Carolina. Columbia, SC had back-to-back 109 degree days on June 29 and 30, 2012 -- the hottest two day stretch in that city's history. Columbia also recorded 11 days with temperatures of 100 degrees or higher during this heat wave. Laurinburg, NC set a new all-time record high of 107 on July 1st. Grandfather Mountain, in the North Carolina mountains at over 5,500 feet elevation, recorded its all-time record high of 82 degrees on July 2nd.
July 2012 was the hottest month ever recorded in history in Wilmington, NC with an average temperature of 84.7 degrees, 3.6 degrees above normal. Five days in July 2012 reached or exceeded 100 degrees in Wilmington. Overnight low temperatures remained at or above 80 degrees on four dates, establishing a new record as well.
At the time, 2012 was the warmest year on record for the continental United States, running 3.2 degrees above the long-term average and breaking the prior warmest year's record set in 1998 by a full degree. (This record has since been broken again in 2016) March, June, and July of 2012 were exceptionally warm and offset otherwise normal temperatures recorded during the fall and early winter.
Highest temperatures observed during the Summer 2012 heat wave
| Asheville, NC | 98 | Fayetteville, NC | 106 | Columbia, SC | 109* |
| Hickory, NC | 102 | Wilmington, NC | 103 | Florence, SC | 105 |
| Charlotte, NC | 104* | New Bern, NC | 99 | N. Myrtle Beach, SC | 98 |
| Greensboro, NC | 102 | Hatteras, NC | 91 | Georgetown, SC | 102 |
| Raleigh, NC | 105* | Greenville-Spartanburg, SC | 107* | Charleston, SC | 98 |
* red highlight indicates all-time record high temperature for this location
|
Highest temperatures observed during the Summer 2012 heat wave |
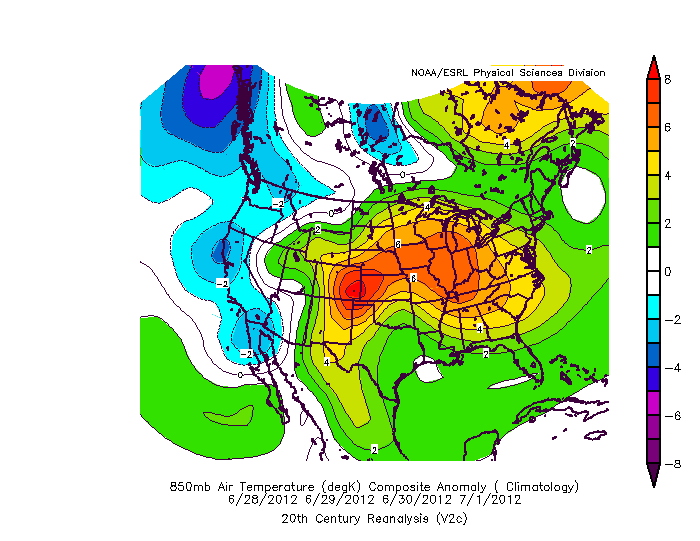
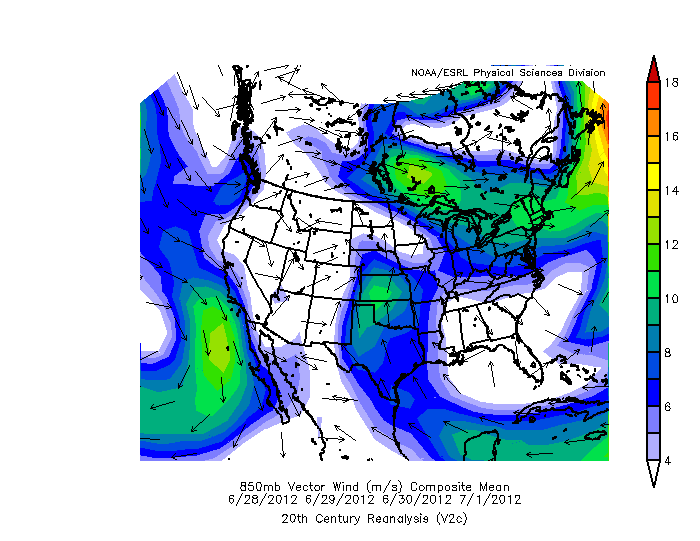
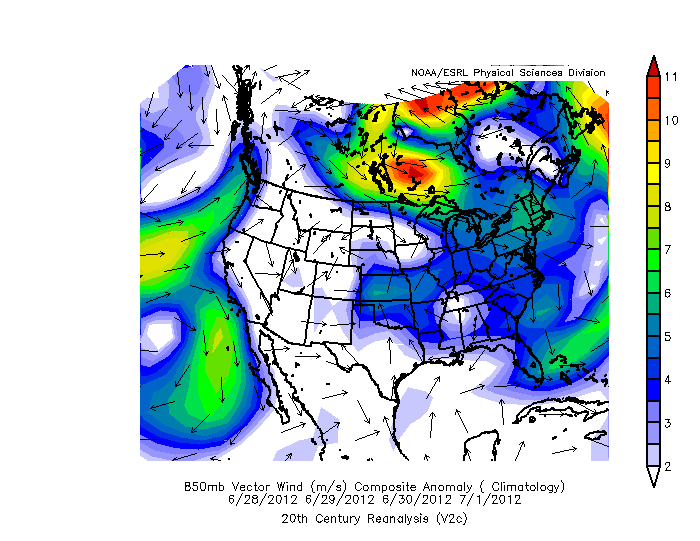
NOAA/ESRL Reanalysis maps (V2c) for the period June 28 through July 1, 2012 |
Additional Reading:
Other Significant Heat Events
Here are additional heat waves that are still historically significant and deserve mention:
July 13 to July 19, 1887: Temperatures reached 100 on two consecutive days in Wilmington, NC (July 17th and July 18th), three consecutive days in Raleigh, NC (July 16th through July 18th) and four consecutive days in Charlotte, NC (July 16th through July 19th). This was the first Carolinas heat wave in "modern" times where systematic weather observations were taken in a significant number of locations.
July 20 to July 28, 1940: Significant but localized heat wave over the Piedmont and Sandhills of the Carolinas, sparing the immediate coast. Highs reached 104 degrees in Raleigh, NC and 103 in Charlotte, NC on July 27th.
July 23 to July 28, 1949: Temperatures reached 100 degrees across most of the Piedmont and interior Coastal Plain of the Carolinas, including 104 degrees in Columbia, SC; 102 degrees in Fayetteville and Lumberton, NC; and 101 in Florence, SC. Columbia, SC had 101+ degree highs four days in a row!
August 15 to August 25, 1968: High temperatures reached or exceeded 100 degrees nine times this month in Laurinburg, NC, including six out of seven days over the period of August 18th through August 24th. Temperatures reached 106 in Columbia, SC; 102 in Florence, SC; 101 in Beaufort, SC.
June 21 to July 1, 1998: Columbia, SC sweltered at 104 degrees. Temperatures of 103 degrees were recorded in Conway, SC and Laurinburg, NC; and 102 in Fayetteville, NC and Florence, SC. Four consecutive days of 100 degree temperatures occurred in Florence, SC, June 27th through June 30th. After back-to-back days of 100-degree heat in Charlotte, NC, the low temperature of 79 degrees recorded on June 28th was the warmest daily low ever recorded there.
June 4 to June 11, 2008: Temps reached 103 degrees in Castle Hayne, NC and 102 in Lumberton and Laurinburg, NC. Raleigh, NC and Columbia, SC both hit 101. Raleigh suffered through four consecutive days of 100 degree heat from June 7th through June 10th. Temperatures in the higher elevations of the North Carolina mountains also got quite warm: 76 at Mt. Mitchell, NC (weather station at 6,240 feet above sea level) and 82 on Grandfather Mountain, NC (weather station at 5,280 feet above sea level).
June 19 to June 27, 2015: High temperature in Charlotte, NC reached 100 degrees on three consecutive days (June 22nd through June 24th), and in Florence, SC temperatures reached 101 on four consecutive days (June 15th through June 18th). Temperatures in Lumberton, NC peaked at 104 degrees, 102 in Fayetteville, NC, and 100 in Wilmington, NC.
Note: Temperature data used throughout this study is from official NWS/FAA airport observations in cities, and from NWS coooperative weather observers in smaller towns.
Page Created: June 9, 2017
Page Updated: June 9, 2017


 Coastal Flood
  Follow us on YouTube