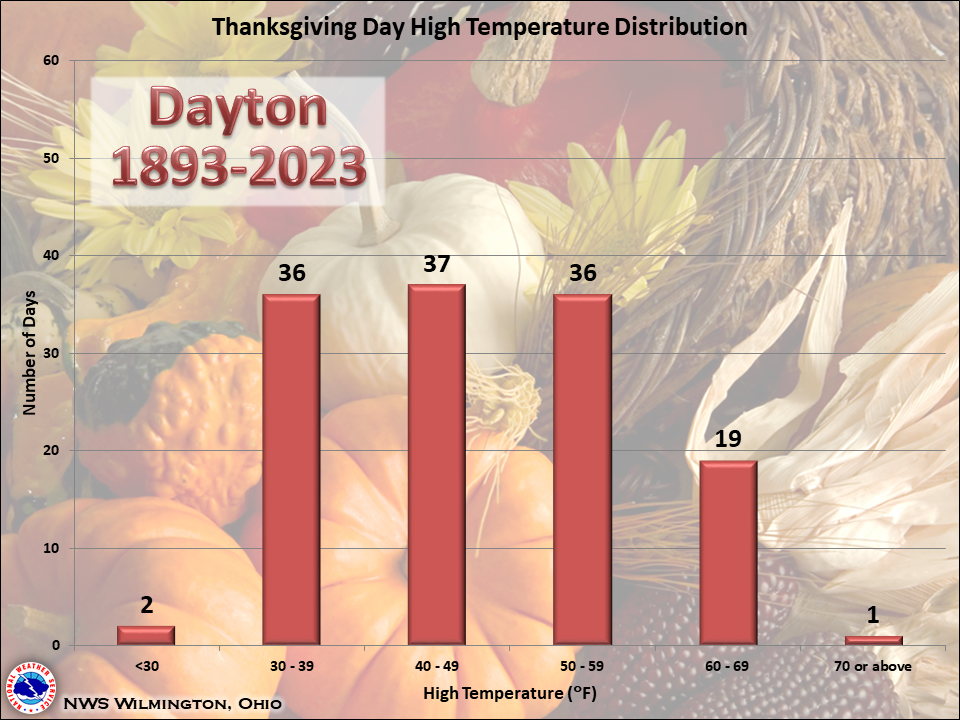
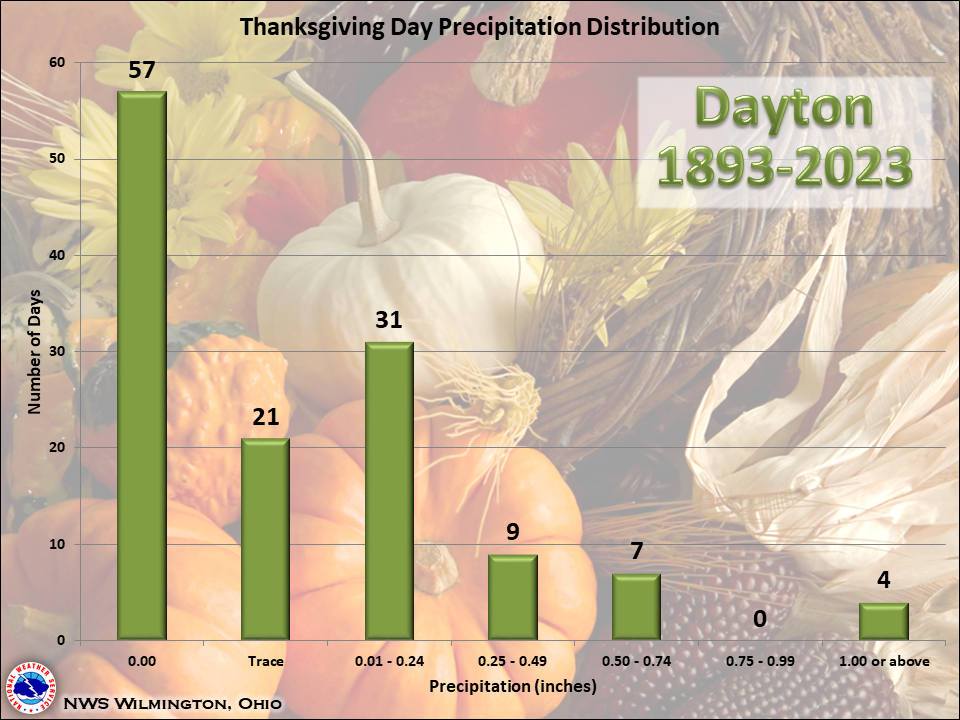
Here is a look at some Thanksgiving Day weather statistics for Dayton, with data going back to 1893. As can be seen in the data below, there has been a fairly wide spectrum of temperatures and precipitation on Thanksgiving in Dayton. Highs have generally ranged from the 30s to the 50s, and lows have typically been in the 20s or 30s. While many Thanksgivings in Dayton have been dry, it is not uncommon to see measurable precipitation. Only a small fraction of Thanksgivings in Dayton have had measurable snowfall, however.
Thanksgiving Day Climate Extremes (1893-2023):
Warmest High Temperature: 70 degrees (1896)
Coldest High Temperature: 13 degrees (1930)
Coldest Low Temperature: 0 degrees (1930)
Warmest Low Temperature: 56 degrees (1896)
Most Precipitation: 1.33 inches (2010)
Most Snowfall: 0.7 inches (1959)
Greatest Snow Depth: 2 inches (1975)
Thanksgiving Day Climate Averages (1893-2023):
Average High Temperature: 47 degrees
Average Low Temperature: 31 degrees
Average Precipitation: 0.14 inches
Average Snowfall: 0.0 inches
Below are graphs showing the frequency distribution of Thanksgiving Day high/low temperatures, precipitation, and snowfall for Dayton. Click here for a full listing of Dayton's Thanksgiving Day climate records.

 |


 Follow us on YouTube