An unusually warm February weather pattern brought several days of record breaking temperatures to central and southeast Illinois. The table below lists record highs and record warm lows, along with the observed high and low temperatures in 2017. Records set this year are highlighted in red.
Note the observation time for the 24 hour high and low temperature listed for each location. Readings for Charleston, Danville, Decatur, Effingham, Galesburg, Normal, and Urbana are provided by NWS Cooperative Weather Observers. The official measurement sites for Peoria and Springfield are at each airport. Lincoln's temperatures are measured at the NWS office.
| Date | Charleston (7 PM) |
Danville (5 PM) |
Decatur (midnight) |
Effingham (7 AM) |
Galesburg (7 AM) |
Lincoln (midnight) |
Normal (5 AM) |
Peoria (midnight) |
Springfield (midnight) |
Urbana (midnight) |
|
| 2/17 | Record 2017 |
72 / 56 69 / 44 |
71 / 51 68 / 36 |
61 / 48 66 / 42 |
68 / 49 60 / 20 |
60 / 43 57 / 27 |
63 / 47 72 / 32 |
64 / 45 52 / 22 |
64 / 47 72 / 37 |
68 / 52 73 / 45 |
69 / 47 70 / 37 |
| 2/18 | Record 2017 |
68 / 48 67 / 47 |
67 / 49 66 / 42 |
70 / 43 64 / 45 |
70 / 44 69 / 42 |
63 / 43 70 / 38 |
63 / 39 67 / 40 |
63 / 44 72 / 43 |
63 / 42 68 / 38 |
65 / 43 68 / 43 |
65 / 42 70 / 40 |
| 2/19 | Record 2017 |
72 / 53 66 / 48 |
70 / 54 67 / 46 |
66 / 48 65 / 45 |
70 / 45 65 / 49 |
63 / 52 66 / 33 |
71 / 46 69 / 36 |
70 / 47 64 / 38 |
71 / 50 69 / 34 |
70 / 54 71 / 41 |
68 / 46 68 / 44 |
| 2/20 | Record 2017 |
73 / 48 72 / 45 |
70 / 48 69 / 39 |
70 / 47 70 / 47 |
68 / 54 64 / 45 |
64 / 41 69 / 38 |
70 / 46 74 / 45 |
67 / 45 68 / 38 |
68 / 46 74 / 48 |
74 / 46 76 / 51 |
71 / 45 71 / 43 |
| 2/21 | Record 2017 |
71 / 52 65 / 53 |
67 / 50 66 / 52 |
68 / 48 61 / 52 |
73 / 52 73 / 46 |
68 / 40 71 / 48 |
69 / 45 65 / 51 |
69 / 46 73 / 45 |
69 / 46 68 / 53 |
69 / 48 64 / 53 |
67 / 47 62 / 48 |
| 2/22 | Record 2017 |
71 / 52 71 / 48 |
71 / 54 68 / 44 |
72 / 51 66 / 46 |
74 / 55 62 / 45 |
61 / 45 65 / 47 |
69 / 45 67 / 42 |
70 / 53 67 / 44 |
71 / 51 |
71 / 53 64 / 45 |
69 / 49 70 / 43 |
| 2/23 | Record 2017 |
69 / 52 71 / 52 |
67 / 51 67 / 42 |
73 / 53 | 68 / 52 74 / 46 |
65 / 44 67 / 41 |
68 / 50 58 / 39 |
66 / 52 67 / 44 |
64 / 49 53 / 43 |
70 / 50 60 / 42 |
65 / 50 |
| 2/24 | Record 2017 |
75 / 54 | 71 / 54 | 75 / 52 | 75 / 54 | 68 / 47 | 74 / 53 | 71 / 51 | 71 / 54 | 78 / 56 | 70 / 51 |
Other February Records:
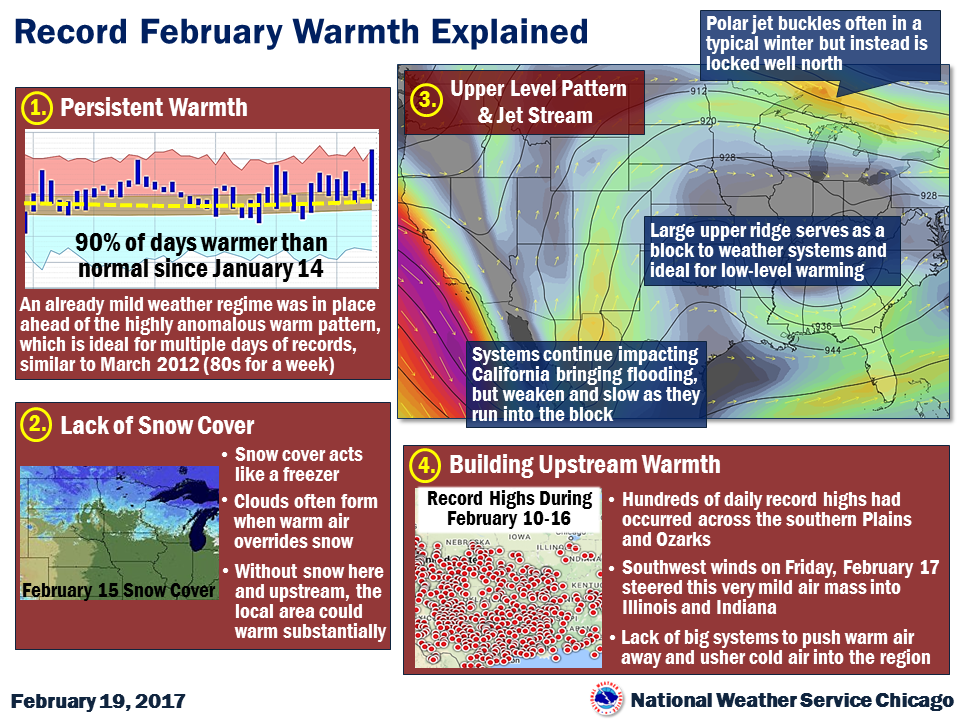
Why have conditions been so warm? NWS Chicago provides the explanation in this graphic:
Links to nearby NWS office's webpages on the record February warmth:


 Follow us on YouTube