National Weather Service United States Department of Commerce


Overview

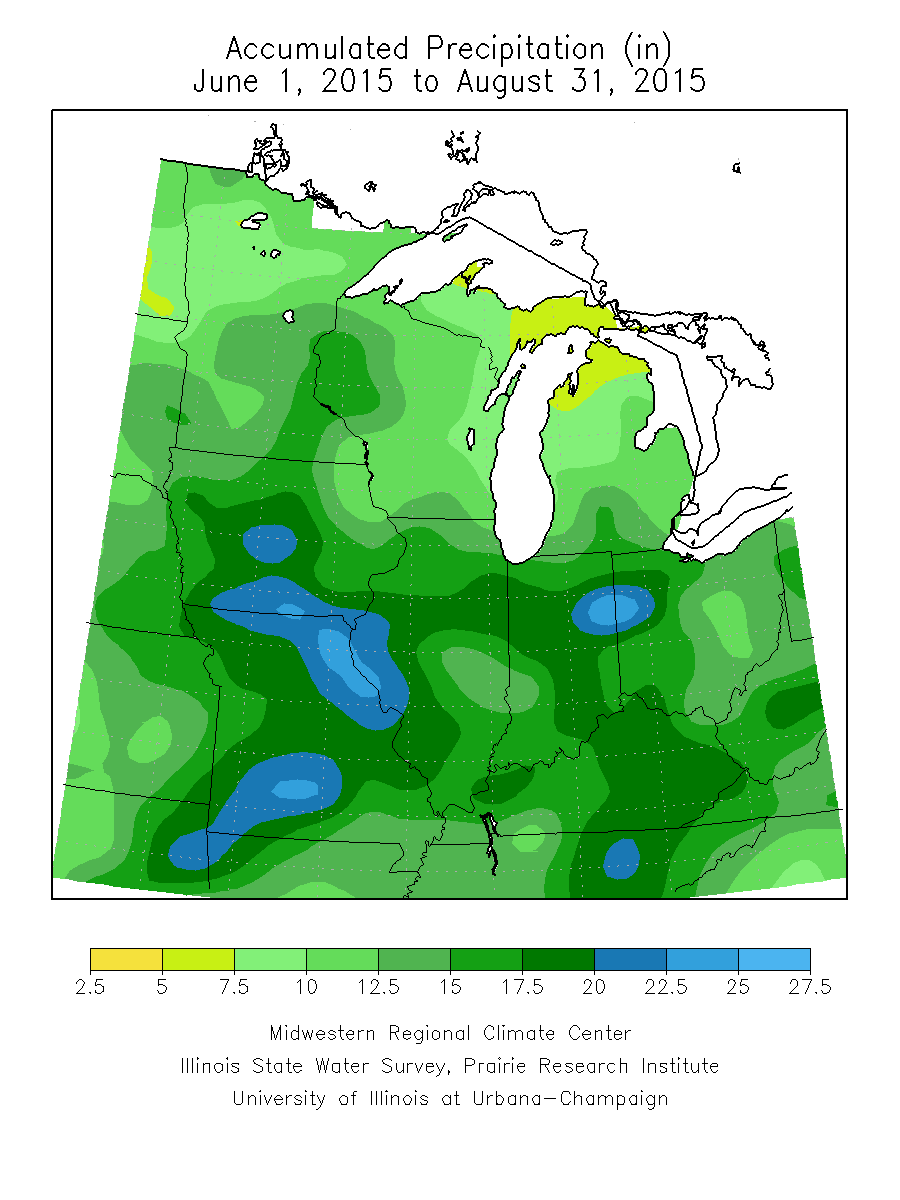
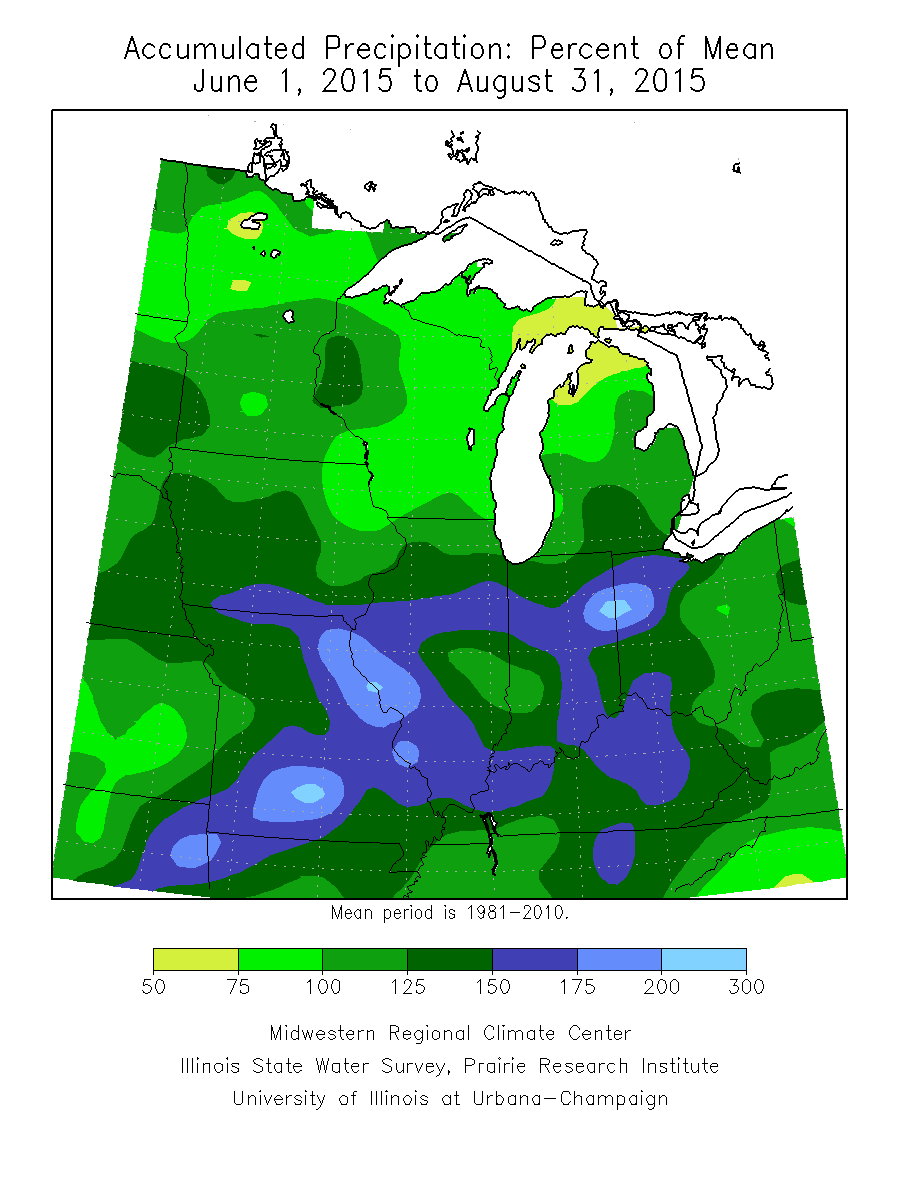
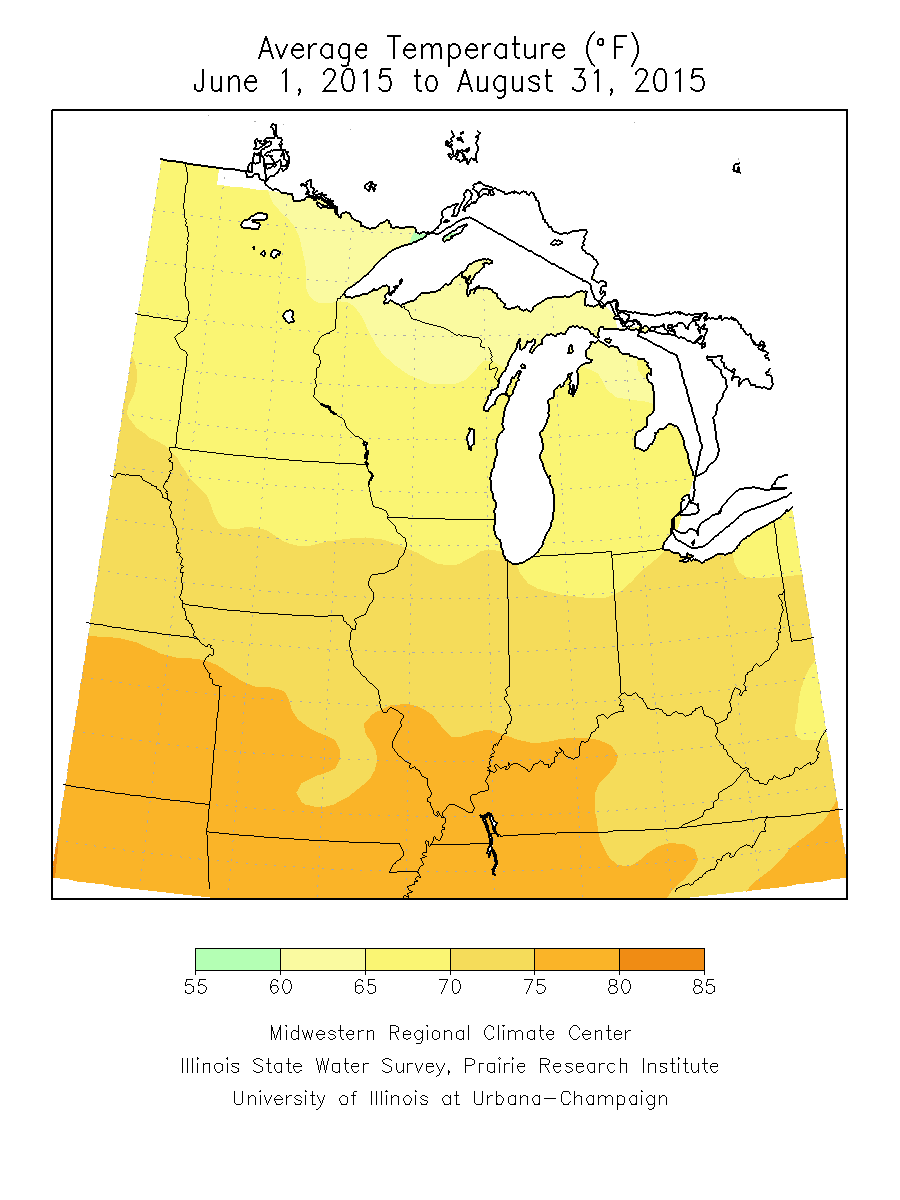
Meteorological summer (June through August) ended up producing above normal rainfall and slightly below normal temperatures for central and southeast Illinois.  The rainfall distribution was quite skewed however, with most of the heavy rain falling in June and early July, and drier weather prevailing for much of the second half of the period.  The rainfall maps below indicate that much of the Midwest saw above normal rainfall this summer, while parts of west-central Illinois had 1.5 to 2 times the normal amount.  Only one site broke in to the "Top 10" wettest summers, as Peoria was 4th wettest, at 19.47" (normal is 10.62").  Temperatures were unremarkable, averaging about 1 degree below normal.  


Links below are the seasonal climate summaries for area cities. Only the summaries for Peoria, Springfield and Lincoln are considered "official", meaning they are the station of record for their respective locations. The other summaries are "supplemental", meaning another location in the area is the official climate station for that city.

  • Peoria -- Peoria International Airport
  • Springfield -- Abraham Lincoln Capital Airport
  • Lincoln -- Lincoln NWS office
  • Champaign -- University of Illinois - Willard Airport
  • Decatur -- Decatur Airport
  • Lawrenceville -- Lawrenceville-Vincennes International Airport
  • Mattoon -- Coles County Airport

Climate data for other area cities is available at http://www.nws.noaa.gov/climate/xmacis.php?wfo=ilx 


June Review

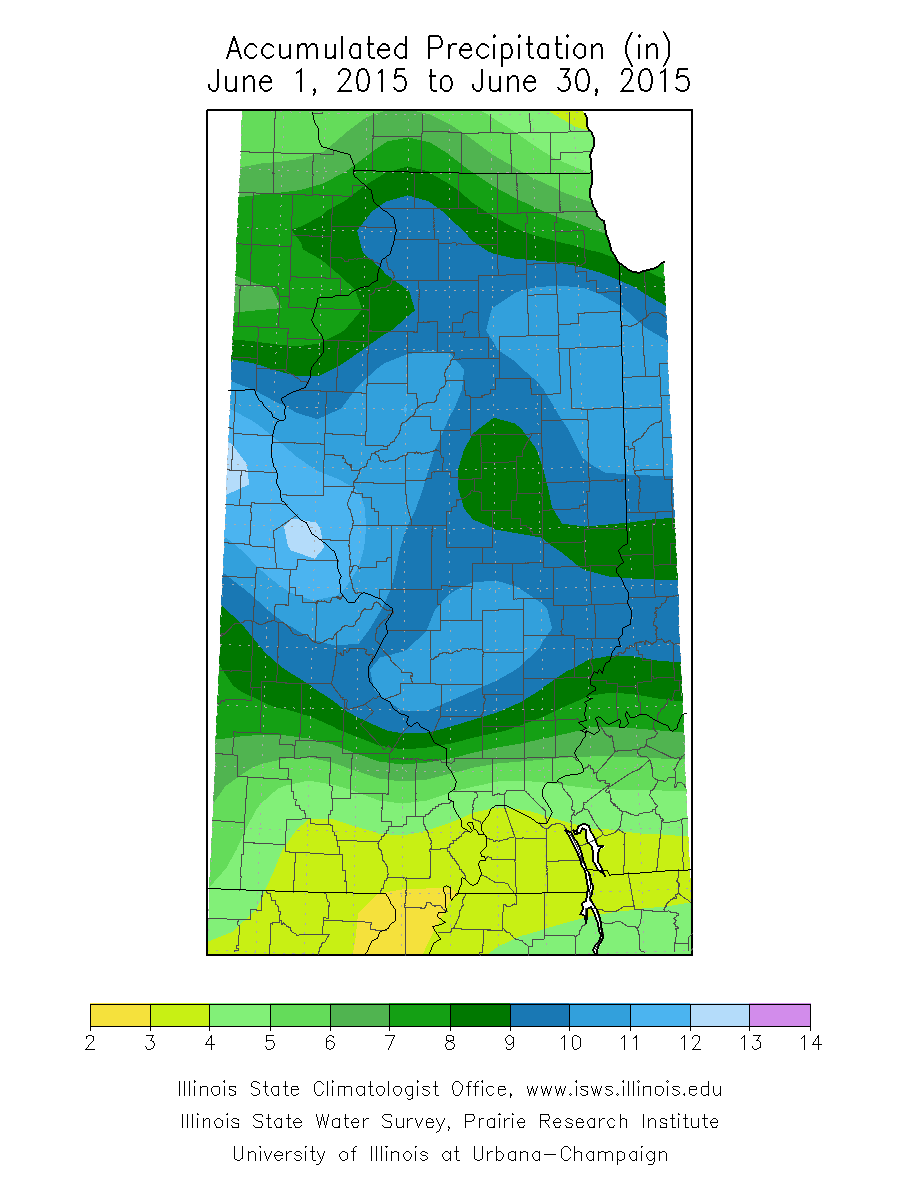
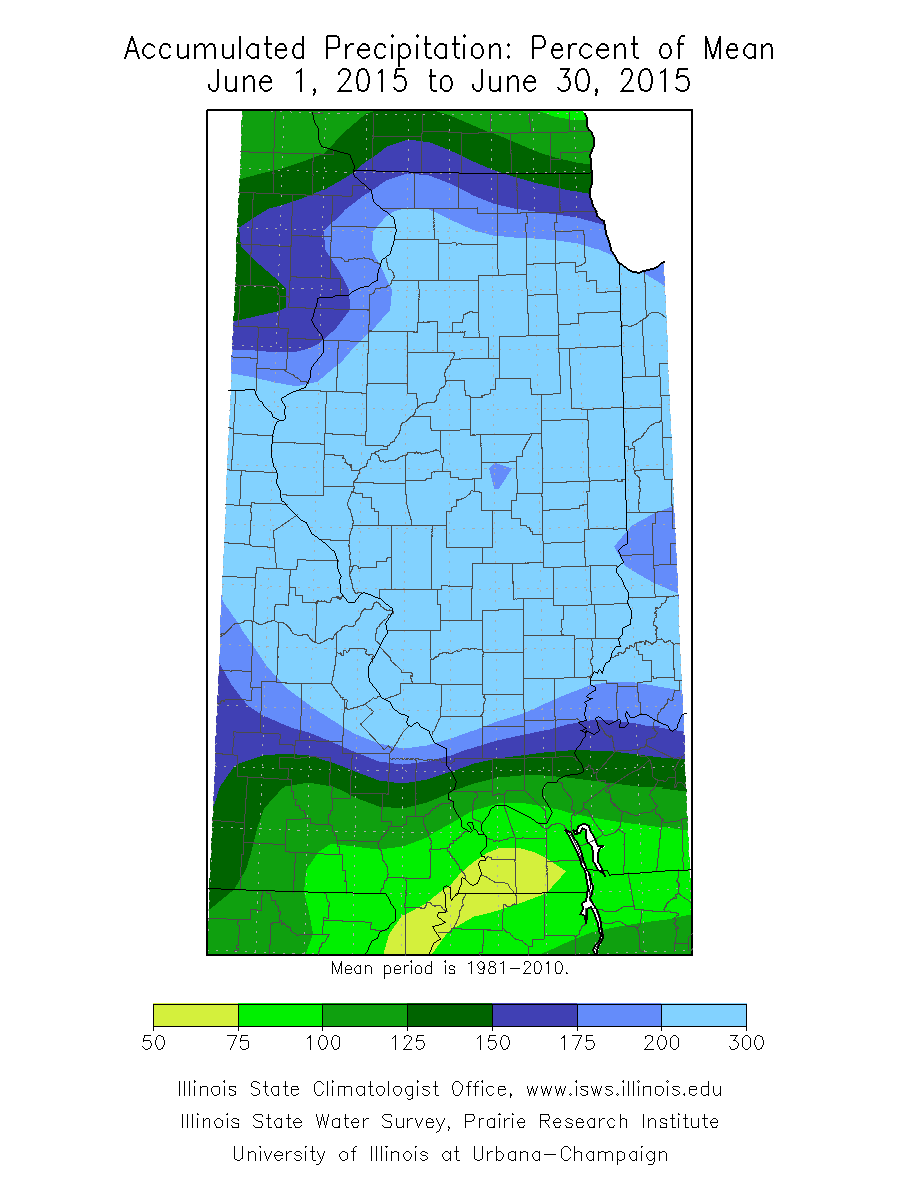
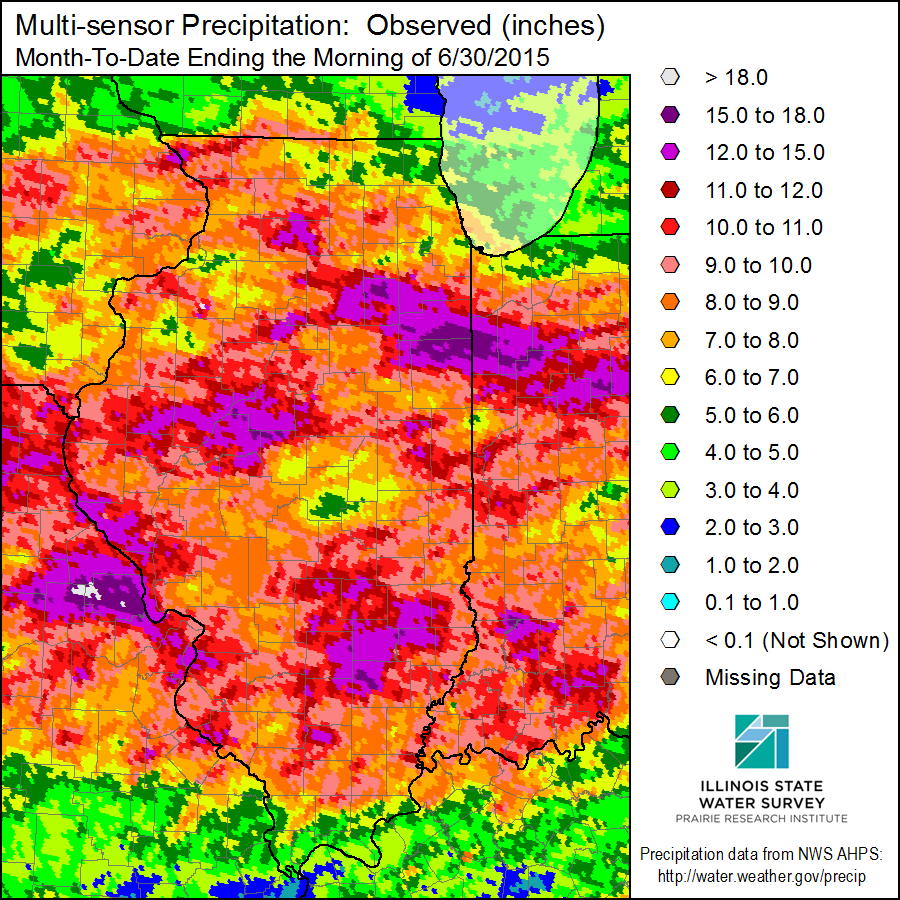
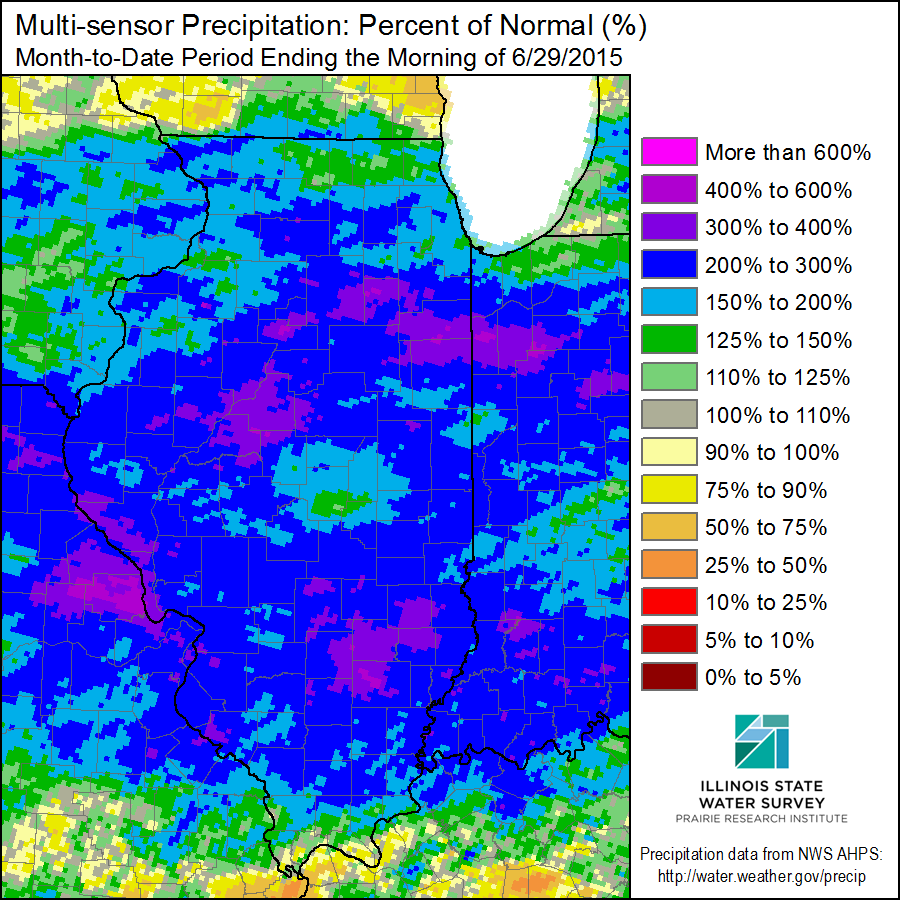
June was an extremely wet month for central and southeast Illinois, and was the wettest June on record for Illinois (statewide average) with 9.53". This put June 2015 as the second wettest month all-time, behind September 1926 (9.62").  An active jet stream brought numerous upper level disturbance and low pressure systems through the area, enhancing rain amounts, starting the week of June 7th.  The remnants of tropical storm Bill moved into the area on June 18-19, bringing more heavy rain of 2 to 5 inches to the southern half of Illinois.  Then, for the 20th through the end of the month, numerous frontal boundaries and upper level disturbances tracked across the area, bringing more heavy rain.  This put most reporting sites into their top 10 wettest June on record.  Cities that had their wettest June included: Canton (13.71"), Chenoa (11.83"), Danville (13.05"), Flora (14.63"), Havana (13.75"), Lacon (12.78"), Mackinaw (11.89"), Olney (11.12"), Petersburg (11.31"), Rushville (13.75"), and Sullivan (11.93").  Normal June rainfall across the region is generally 3.50" to 4.50". Flora's total was noteworthy because this was the second wettest month ever recorded, since 1893.  This amount of rain caused many area rivers to go above flood stage with major flooding along the Illinois river from Havana to Beardstown and areas downstream, which lasted well into July.

Notable sites with long-term records that approached record wet status:

  • Effingham: 3rd wettest June with 11.07".  Record wet June is 12.47" in 1974.  Records date back to 1892.  
  • Lincoln: 3rd wettest June with 9.67".  Record wet June is 10.79" in 2010.  Records date back to 1906.  
  • Normal: 4th wettest June with 8.39".  Record wet June is 12.45" in 1902.  Records date back to 1893. 
  • Peoria: 2nd wettest June with 11.60".  Record wet June is 11.69" in 1974.  June 2015 was also Peoria's 5th wettest month ever.  Records date back to 1883. 
  • Springfield: 5th wettest June with 9.14".  Record wet June is 12.71" in 1882.  Records date back to 1879. 
  • Urbana: 3rd wettest June with 9.16". Record wet June is 11.58" in 1902. Records date back to 1888.

June Rainfall Maps


July Review

July continued where June left off, with very wet conditions across much of central Illinois.  An active storm track that remained centered on the Midwest, resulted in repeated heavy rains.  In July, the heavier rains were focused on west-central IL, and areas along and north of the I-74 corridor. A pocket of drier (near to below normal) conditions developed during the second half of the month in east-central IL, and areas south of I-70. Increased clouds and frequent rainfall kept temperatures 1-2 degrees below normal, for the monthly average.  

A couple significant weather events impacted the area during the month: 

  • On July 8th, an area of low pressure tracked from the central Plains, into the southern Great Lakes.  Widespread rain accompanied this feature, with the heaviest rain falling along and north of the low track.  Rainfall amounts of 1 to 3 inches were common along and northwest of a Taylorville to Danville line and along and southeast of a Macomb to Henry line.  The maximum rainfall occurred from northern and eastern Logan County northeastward across much of McLean County.  These locations picked up in excess of 3 inches, with isolated amounts of around 4 inches across eastern McLean County.  Due to the heavy rainfall coming down in a short amount of time, flash flooding occurred in Bloomington-Normal, as well as across portions of northern Champaign County during the evening of the 8th. 
  • On July 16th, a tornado struck Delavan in southern Tazewell County, late in the evening.  51 homes were damaged on the south side of town, six of which were determinted to be a total loss.  While there were no fatalities, there were two injuries.  The NWS damage survey rated the tornado EF2, with wind speeds estimated at 120 MPH.  The tornado was on the ground for 1.3 miles. 

July Rainfall Maps

IL July 2015 Precipitation IL July 2015 Precipitation: Percent of Mean


August Review

The average temperature for the month of August was 1-2 degrees below normal for central and southeast IL. However, the first half of the month featured afternoon temperatures at or above normal with another wave of some very warm to hot temperatures again from the 15th through the 19th before a couple of strong cold fronts brought some fall-like temperatures to our area to during the period from the 20th through the 29th. Overnight lows dropped to the upper 40s to lower 50s during this late August "cool snap". Rainfall for the month averaged below normal across most of the area with several potent weather systems for August bringing scattered strong to severe storms to the area.

  • August 1-7: Temperatures overall averaged below normal during this time frame with below normal rainfall across the north, while rainfall averaged above normal across the south. A cold front moved across the area on the 2nd and 3rd of the month spawning strong to severe storms with the majority of the active storms staying to our north.  
  • August 8-14: Heaviest rainfall during this period concentrated over parts of west central Illinois, with precipitation amounts a bit below normal over southeast Illinois. Temperatures averaged close to normal with a small area from Peoria to Bloomington that trended above normal during the second week of August.
  • August 15-21: This was by far the most active week of the month, at least for severe storms, as a potent upper level storm system and surface cold front affected the area. Rainfall during this time frame averaged above normal except for a small area of extreme southeast Illinois where below normal precipitation was found. Temperatures for the most part were closer to where they should be for the third week of August, with only a small area of the far north seeing above normal temperatures, while areas over far southeast Illinois were trending a bit below normal. Severe storms, including one weak tornado near Mackinaw, pushed across the area on the 18th accompanied by reports of damaging straight line winds, large hail and isolated reports of heavy rainfall.
  •  August 22-31: Another strong cold front moved across the area on the 23rd, however, unlike the strong front that pushed through the Midwest about a week earlier, the timing of the frontal passage across our area was not favorable for widespread severe storms. In addition, the deeper moisture ahead of this front was still south of our region, thanks in part to the previous frontal passage that pushed the tropical air mass well to our south as it plowed through our area about 3 to 4 days ago. The cold front was tracking across our area during the morning and early afternoon hours with storms not redeveloping until later in the afternoon, and mainly to our east.  
 

August Rainfall Maps