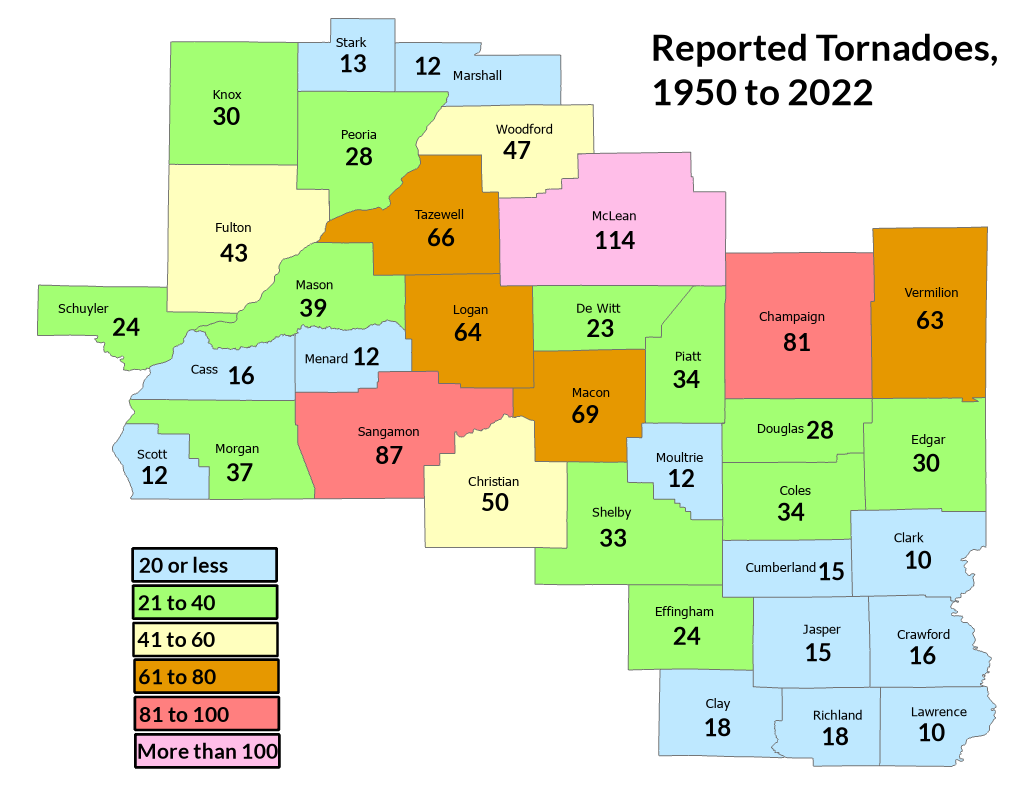
Tornadoes have been common across central Illinois over the years, with lesser totals reported across southeast portions of the state. The map below shows the number of tornadoes reported across the Lincoln NWS's County Warning Area between 1950 and 2022.
| Select a county for detailed listings: | ||||||
|---|---|---|---|---|---|---|
| Cass | Champaign | Clark | Clay | Christian | Coles | Crawford |
| Cumberland | De Witt | Douglas | Edgar | Effingham | Fulton | Jasper |
| Knox | Lawrence | Logan | McLean | Macon | Marshall | Mason |
| Menard | Morgan | Moultrie | Peoria | Piatt | Richland | Sangamon |
| Schuyler | Scott | Shelby | Stark | Tazewell | Vermilion | Woodford |
(Information on other counties in Illinois can be obtained from the Midwestern Regional Climate Center's Tornado Tracks page. Data available through 2022.)
While some of the disparity can be attributed to differing weather conditions, some of it is also due to the organization of storm spotter networks, with an overall upward trend in reported tornadoes as the years progressed. To try and account for this, we have also normalized the reports of tornadoes per 100 square miles, instead of just by county boundaries:
| Rank | County | Tornadoes within county boundary |
Rank | County | Tornadoes per 100 square miles |
| 1 | McLean | 114 | 1 | Logan | 10.356 |
| 2 | Sangamon | 87 | 2 | Tazewell | 10.169 |
| 3 | Champaign | 81 | 3 | Sangamon | 10.023 |
| 4 | Macon | 69 | 4 | McLean | 9.628 |
| 5 | Tazewell | 66 | 5 | Woodford | 8.902 |
| 6 | Logan | 64 | 6 | Macon | 8.244 |
| 7 | Vermilion | 63 | 7 | Champaign | 8.124 |
| 8 | Christian | 50 | 8 | Piatt | 7.727 |
| 9 | Woodford | 47 | 9 | Christian | 7.052 |
| 10 | Fulton | 43 | 10 | Mason | 7.050 |
| 11 | Mason | 38 | 11 | Vermilion | 7.008 |
| 12 | Morgan | 37 | 12 | Douglas | 6.715 |
| 13 (tie) | Coles | 34 | 13 | Coles | 6.693 |
| 13 (tie) | Piatt | 34 | 14 | Morgan | 6.503 |
| 15 | Shelby | 33 | 15 | De Witt | 5.779 |
| 16 (tie) | Knox | 30 | 16 | Schuyler | 5.492 |
| 16 (tie) | Edgar | 30 | 17 | Effingham | 5.010 |
| 18 (tie) | Peoria | 28 | 18 | Richland | 5.000 |
| 18 (tie) | Douglas | 28 | 19 | Fulton | 4.965 |
| 20 (tie) | Schuyler | 24 | 20 | Edgar | 4.808 |
| 20 (tie) | Effingham | 24 | 21 | Scott | 4.781 |
| 22 | De Witt | 23 | 22 | Cass | 4.521 |
| 23 (tie) | Clay | 18 | 23 | Peoria | 4.516 |
| 23 (tie) | Richland | 18 | 24 | Stark | 4.514 |
| 25 | Cass | 17 | 25 | Shelby | 4.348 |
| 26 | Crawford | 16 | 26 | Cumberland | 4.335 |
| 27 (tie) | Jasper | 15 | 27 | Knox | 4.190 |
| 27 (tie) | Cumberland | 15 | 28 | Clay | 3.838 |
| 29 | Stark | 13 | 29 | Menard | 3.822 |
| 30 (tie) | Scott | 12 | 30 | Crawford | 3.604 |
| 30 (tie) | Moultrie | 12 | 31 | Moultrie | 3.571 |
| 30 (tie) | Menard | 12 | 32 | Jasper | 3.034 |
| 33 | Marshall | 11 | 33 | Marshall | 2.850 |
| 34 (tie) | Clark | 10 | 34 | Lawrence | 2.688 |
| 34 (tie) | Lawrence | 10 | 35 | Clark | 1.992 |
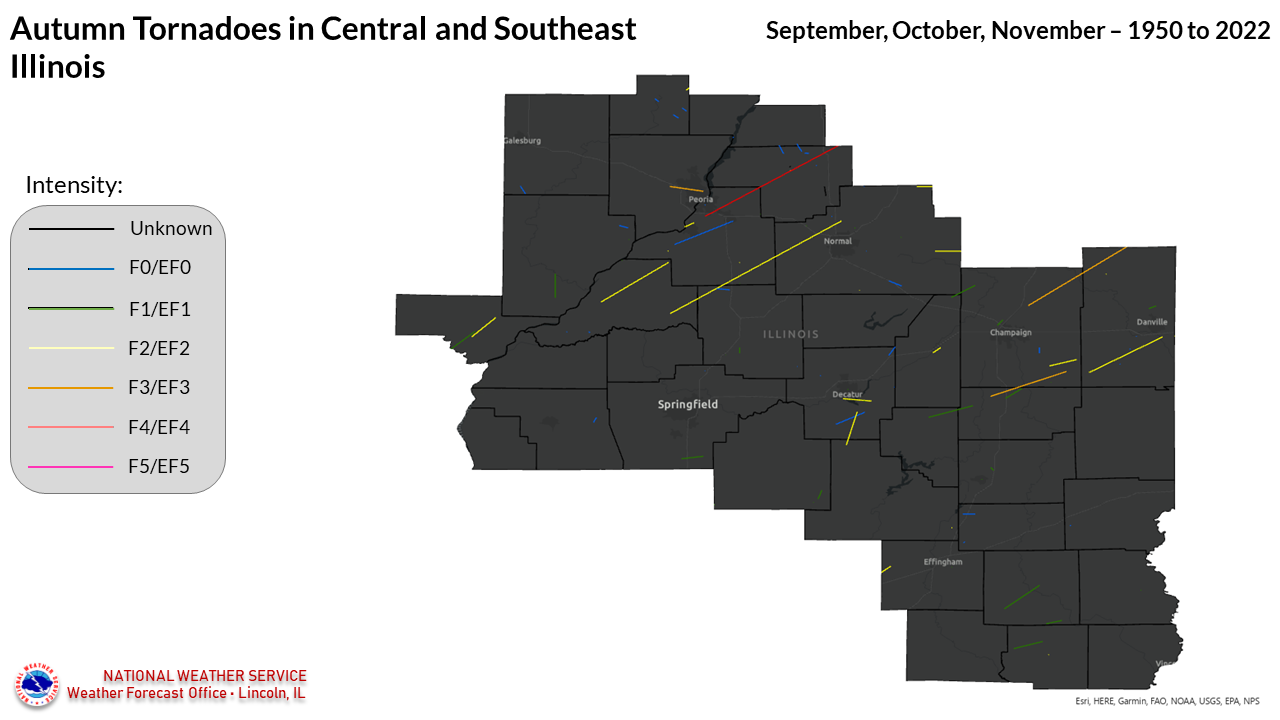
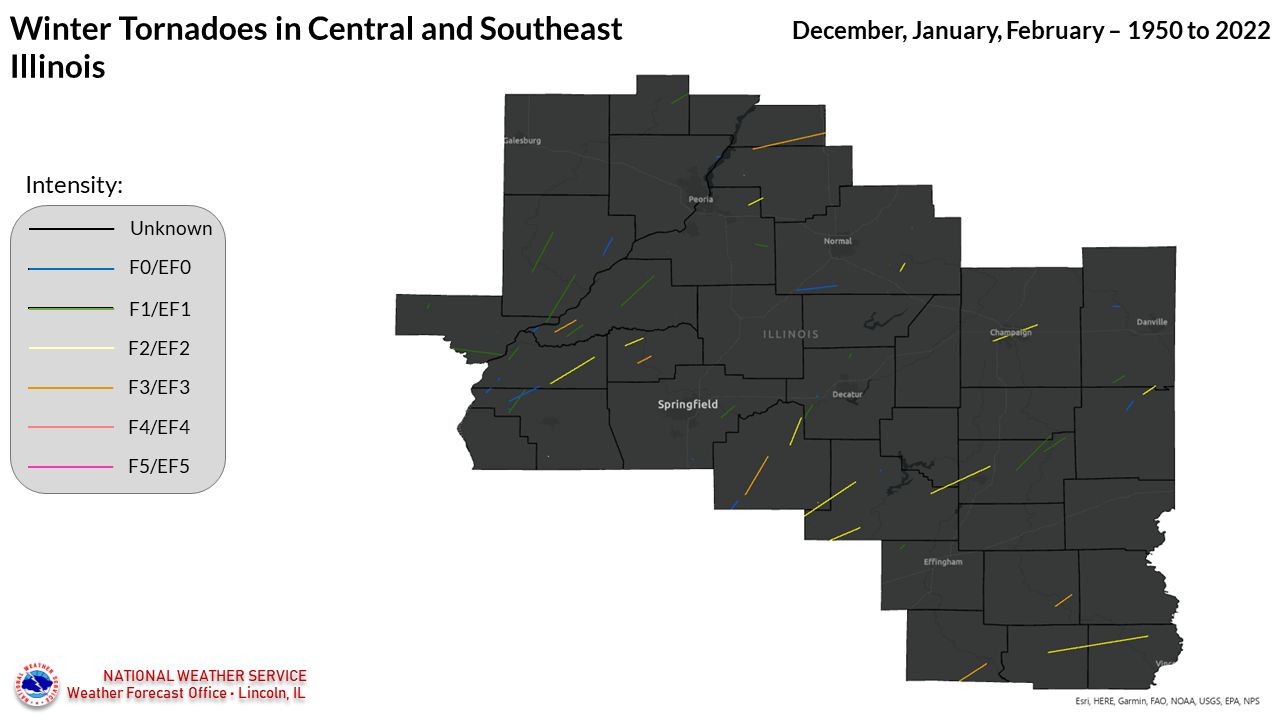
Direction of Tornado Movement:
(click images to enlarge)
|
|
|
|
|
|
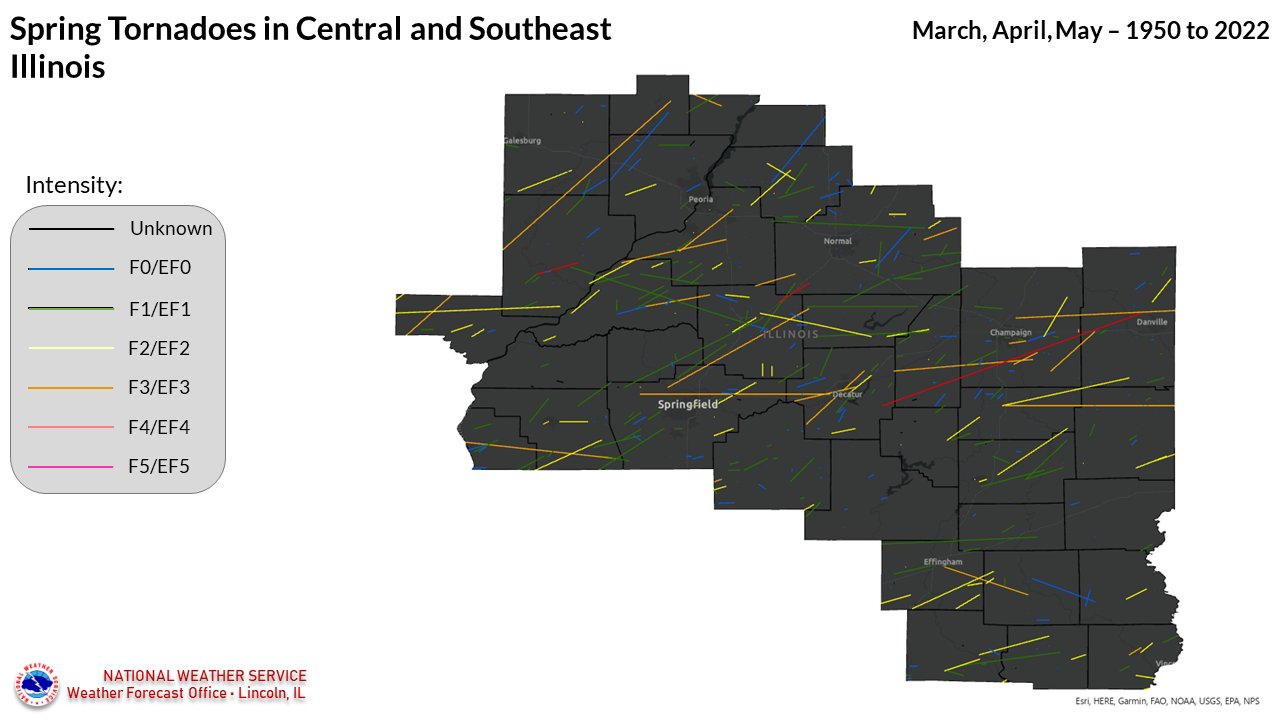
Spring Season |
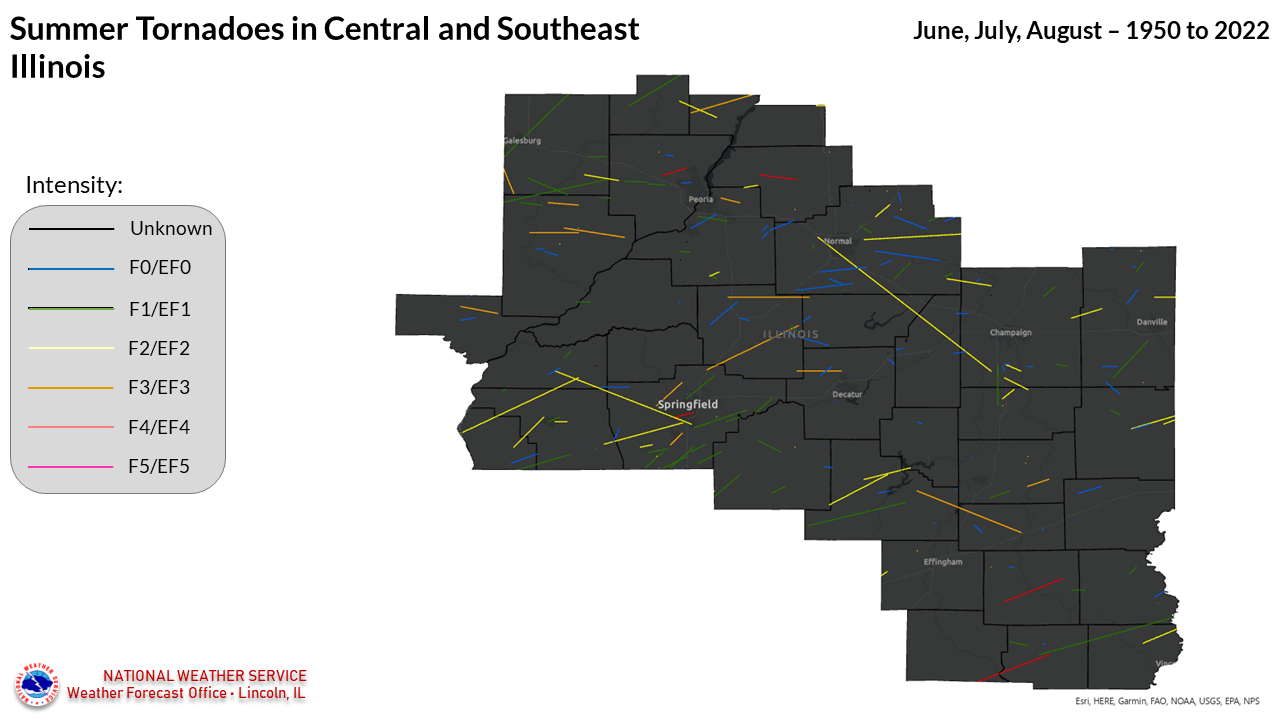
Summer Season |
Autumn Season |
Winter Season |
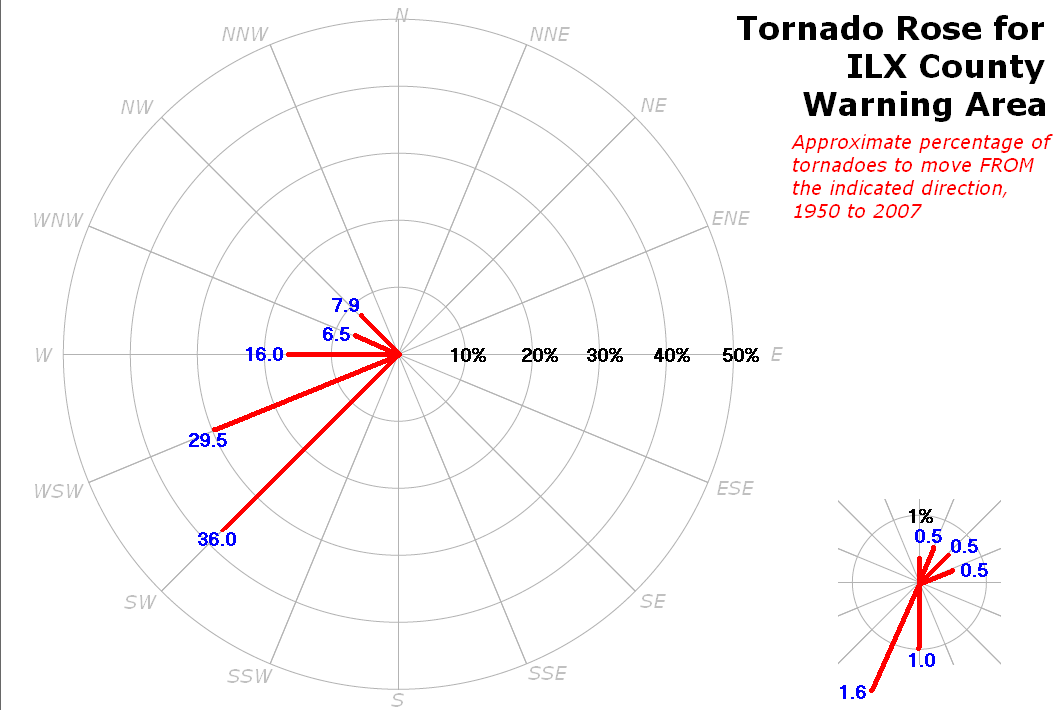 The image at left (click to enlarge) shows the prevailing directions that the tornadoes move from in this area. For example, the 36% along the southwest axis of the graph means that 36% of the tornadoes moved from the southwest to the northeast. Most of the tornadoes in this area moved toward the northeast to east. Fewer tornadoes moved in a southeast direction. Only a handful moved in other directions (shown in the inset at the lower right corner of the image). Click on the image to enlarge.
The database from the National Center for Environmental Information (NCEI) and the Storm Prediction Center (SPC) was used to create these pages. Besides the tornado information, NCEI's Interactive Database can be used to retrieve information regarding hail, winter storms, and other hazards. Also check out NCEI's U.S. Tornado Climatology page, and SPC's GIS-enabled Severe Weather Climatology page. Similar maps for other Illinois counties are available at the Midwest Regional Climate Center's Tornado Tracks Tool web page. We also maintain a separate listing of violent tornadoes (F4/F5 or EF4/EF5 strength) in our coverage area.
Some other items to consider when reviewing these pages:


 Follow us on YouTube