Discussed and shown below will be the upper level pattern and weather charts that were present on March 3, 1966. The charts shown will display a few weather fields that are typically shown on weather charts. These charts will also display the "standard deviation" of each field with "cool" and "warm" colors. This Standard Deviation shows how "rare" or "common" the height pattern, wind speeds or temperatures were from the climatological values for that particular time of year. Click on thumbnails for a larger image.
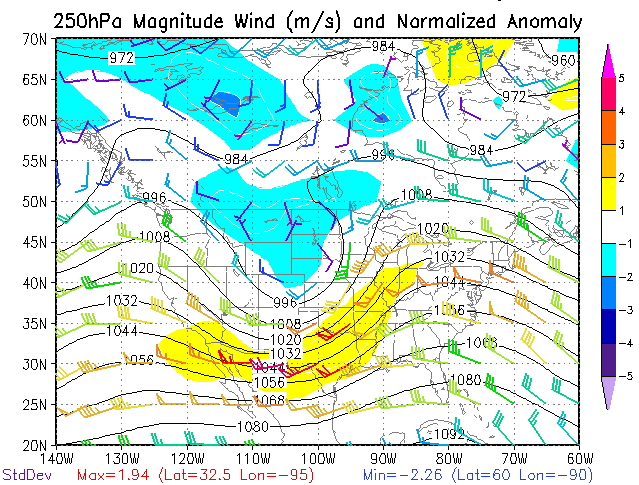
The 250mb level is shown to have a fairly large and pretty anomalous upper trough just E of the Rockies. Heights are some 3-4 standard deviations below normal values for early March.
|
|
As for the winds, a fairly strong "jet stream" is depicted curving out of old Mexico. The flow is strongly diffluent as the core of the jet lifts NE while the rest of the flow turns more toward the E around the upper ridge. The "jet stream", shown in m/s, converts to about 120-130 kts.
 |
The 500 mb pattern is not totally different from the upper levels as it shows a large mid-level closed low with a trough extending into Mexico. The heights are rather low with this large system which is indicated by the area of 4 standard deviations.
 |
The mid-level flow is indicated by a strong mid-level jet extending from TX to MO with a core of about 90 kts! Such a potent type of mid-level jet is somewhat rare, standard deviations are roughly 3.
 |
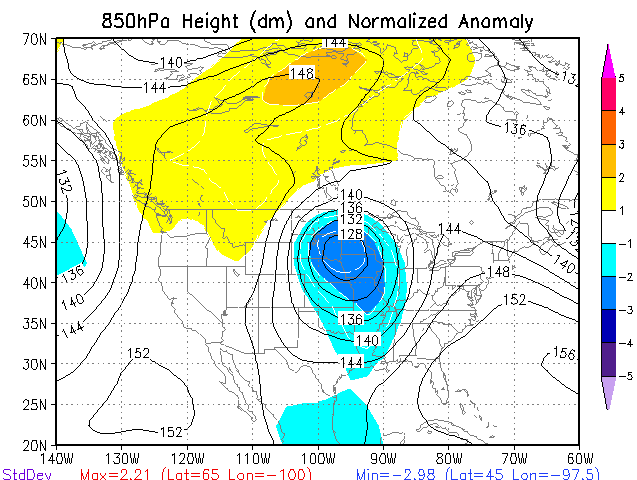
Down in the lower levels, the 850 mb closed low is centered over Sioux Falls, South Dakota. This is usually a bit far to the north for a low center. However, history has shown that some of the strongest and most devistating tornadoes across MS have had the 850 mb and surface low across KS and NB. Similar to the mid and upper levels, this low was large and quite strong and displayed deviations in the 2-3 range.
 |
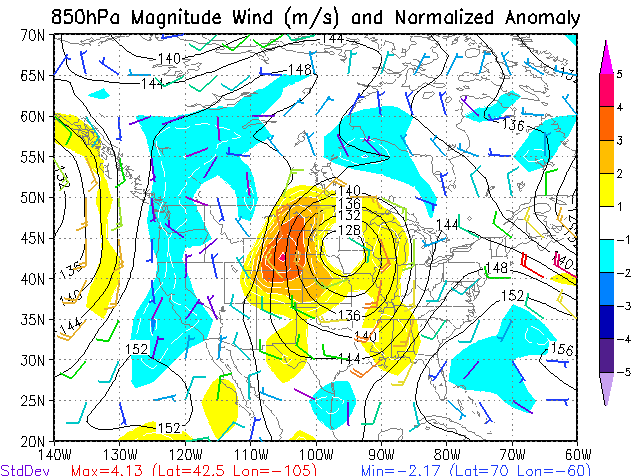
The 850 mb winds were not overly strong and ranged about 40-45 kts. The interesting feature to note is the subtle wind shift associated with the "kink" in the height field. This may not seem overly significant, but as you will see in later (surface) analysis, this was likely the feature that was the "trigger" or driving force to the storm or storms.
 |


 Follow us on YouTube