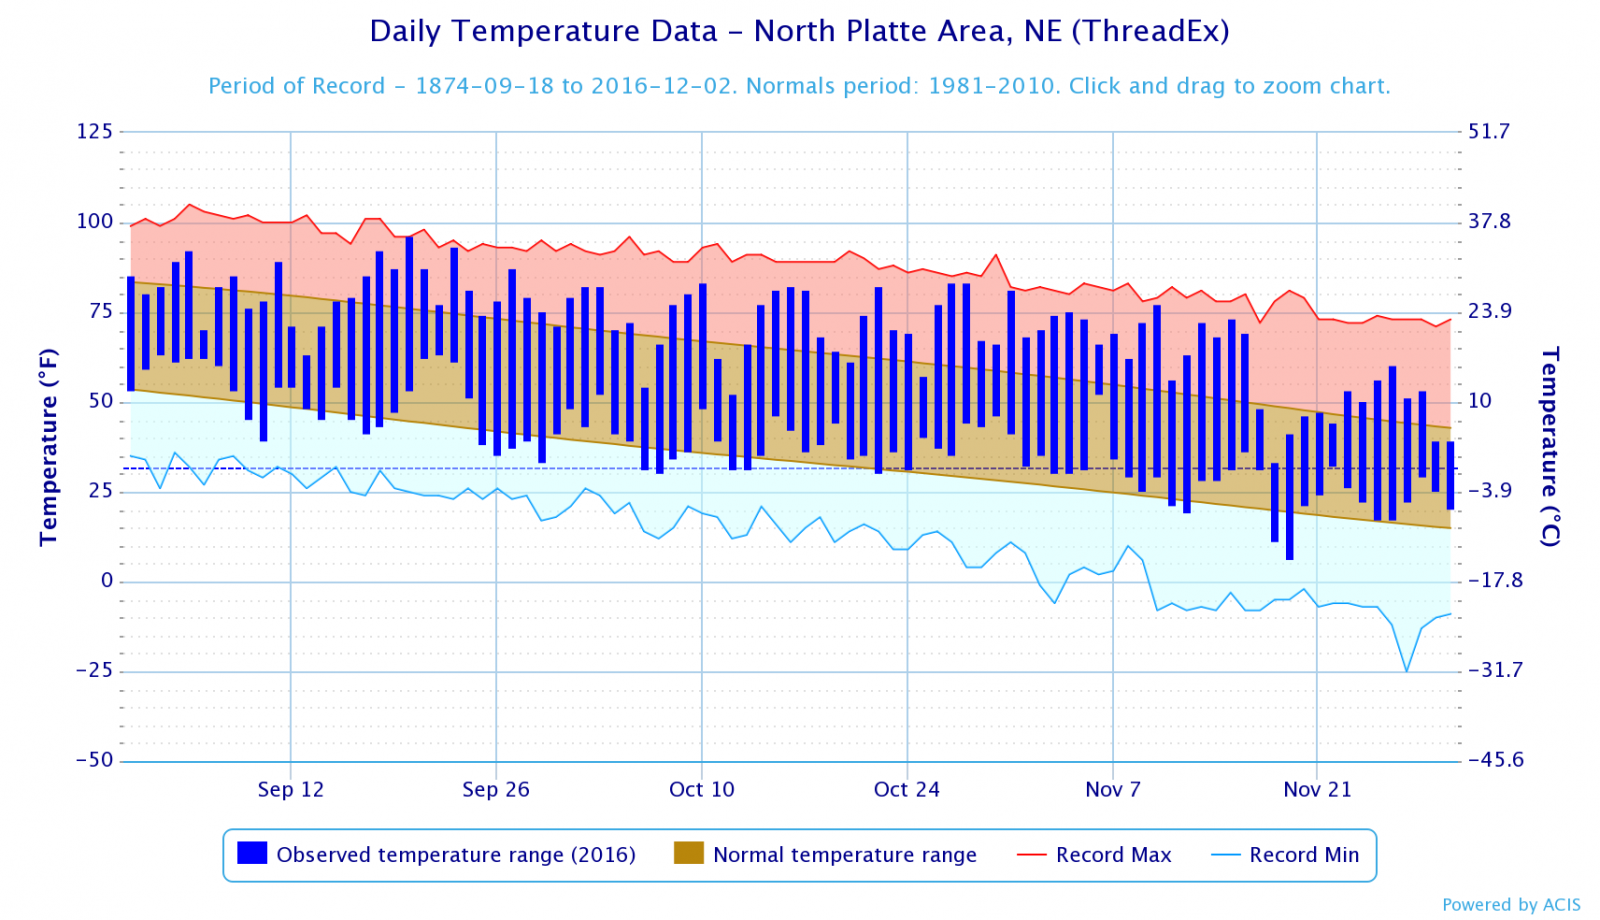
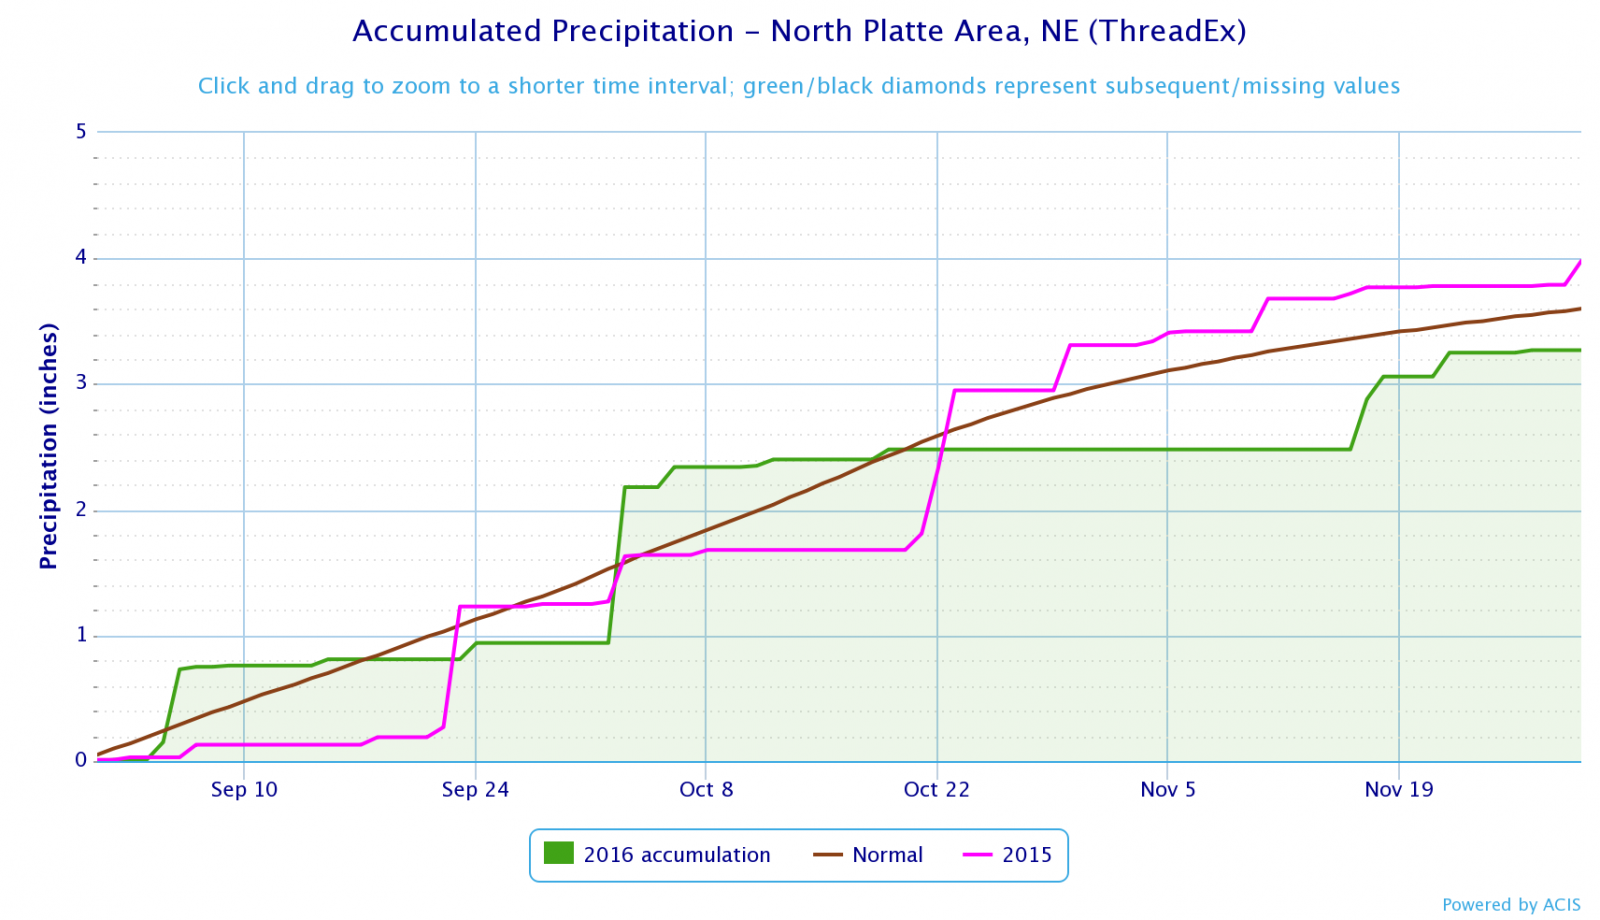
North Platte, NE
Fall Statistics
Facts for the 3 month period of September, October, and November
(including the last 5 years)
| Ave High |
Ave Low |
Ave Temp |
Precip | Snow | Days Lows ≤ 32 |
Days Highs 70+ |
Days Highs 80+ |
|
| Average | 64.7 | 35.7 | 50.2 | 3.22 | 5.1 | 39.1 | 38.6 | 19.0 |
| Max | 70.8 | 40.9 | 55.1 | 9.29 | 30.3 | 55 | 56 | 32 |
| Year | 2016 | 1931 | 1933 | 1946 | 2009 | 1976 | 2016 | 1979 |
| Min | 56.0 | 28.7 | 44.3 | 0.43 | 0 | 23 | 22 | 6 |
| Year | 1985 | 1976 | 1985 | 2012 | 1899 1901 1903 |
1886 | 1883 | 2009 |
| 2012 | 68.0 | 30.9 | 49.4 | 0.43 | 2.7 | 52 | 47 | 22 |
| 2013 | 64.3 | 36.4 | 50.3 | 7.25 | 3.1 | 45 | 30 | 18 |
| 2014 | 65.2 | 33.1 | 49.1 | 2.20 | 0.4 | 41 | 43 | 17 |
| 2015 | 67.8 | 39.6 | 53.7 | 3.98 | 4.6 | 30 | 46 | 25 |
| 2016 | 70.8 | 38.4 | 54.6 | 3.27 | 5.0 | 32 | 56 | 27 |
| Top 10 Finishes for the 2016 Fall (Sep, Oct, Nov) for North Platte | |||||||
| Average High Temp (Warmest) |
Average Temp (Warmest) |
Days Highs 70+ (Most) |
Days Highs 80+ (Most) |
||||
| 1 | 70.8 (2016) | 1 | 55.1 (1933) | 1 | 56 (2016) | 1 | 32 (1979) |
| 2 | 69.9 (1904) | 2 | 54.6 (2016) | 2 | 51 (1953,1938) |
2 | 31 (1897) |
| 3 | 69.5 (1933) | 3 | 54.5 (1931) | 3 | 30 (1953) | ||
| 4 | 69.5 (1939) | 4 | 54.3 (1963) | 4 | 50 (1963) | 4 | 29 (1938,1931) |
| 5 | 69.4 (1914) | 5 | 54.2 (1914) | 5 | 49 (1914) | ||
| 6 | 69.4 (2005) | 6 | 54.2 (1939) | 6 | 48 (2005,1990, 1956,1940, 1931,1921, 1910) |
6 | 28 (2003,1952, 1927,1908) |
| 7 | 69.3 (1963) | 7 | 54.1 (1904) | ||||
| 8 | 69.0 (1990) | 8 | 54.0 (1938) | ||||
| 9 | 68.5 (1922) | 9 | 53.8 (2015) | ||||
| 10 | 68.5 (2007) | 10 | 53.7 (1897) | 10 | 27 (2016,2005, 1956,1947, 1940,1922, 1921,1910) |
||
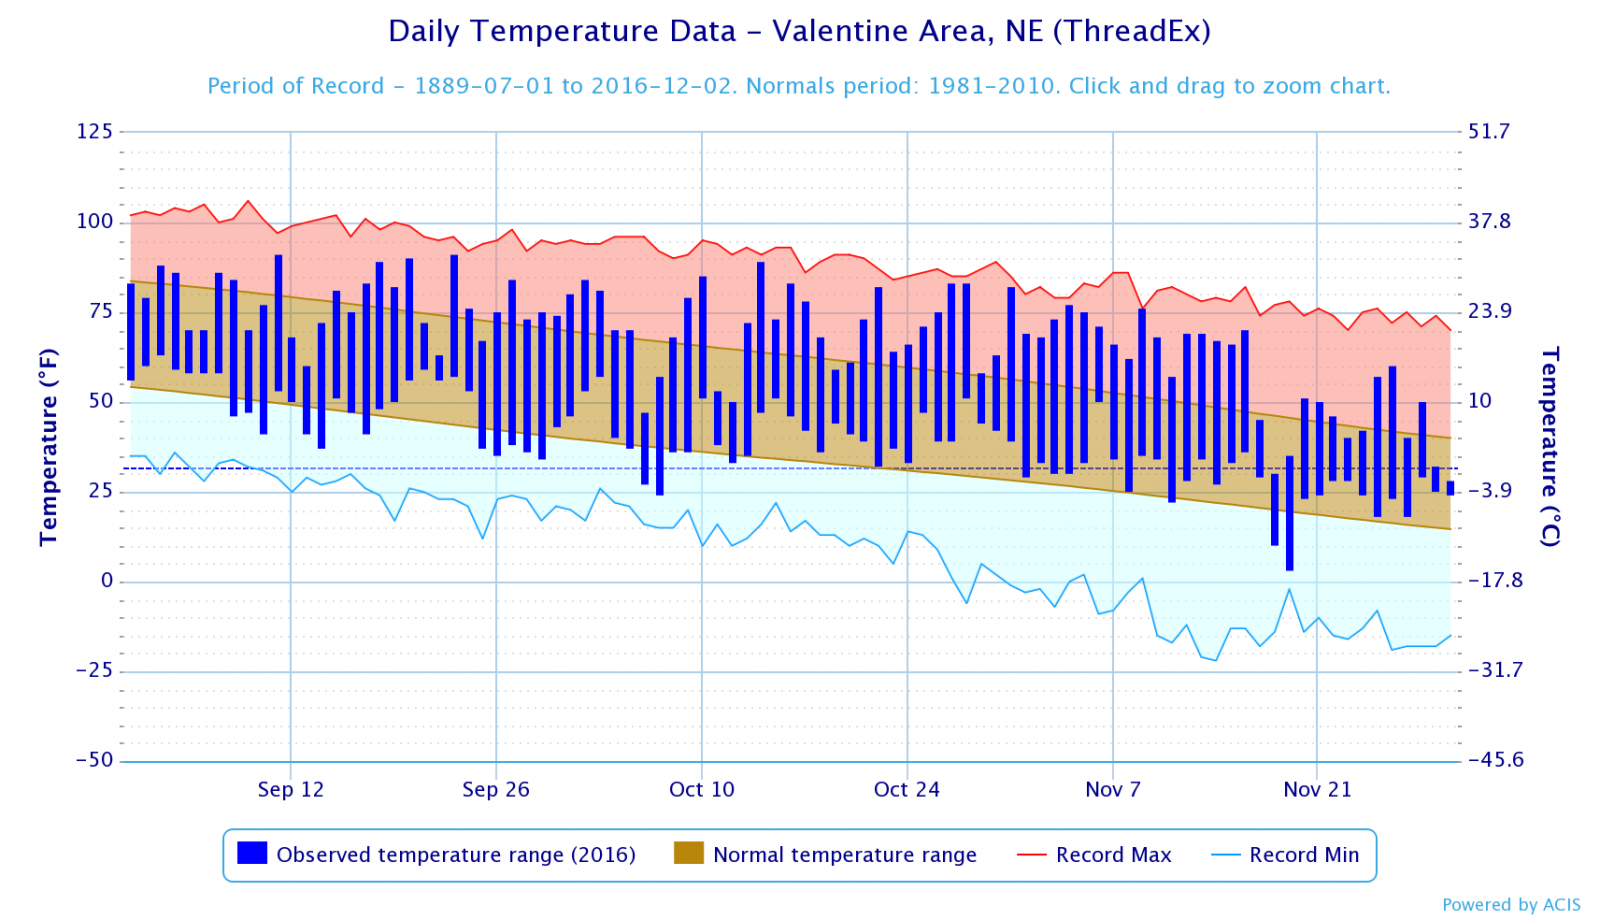
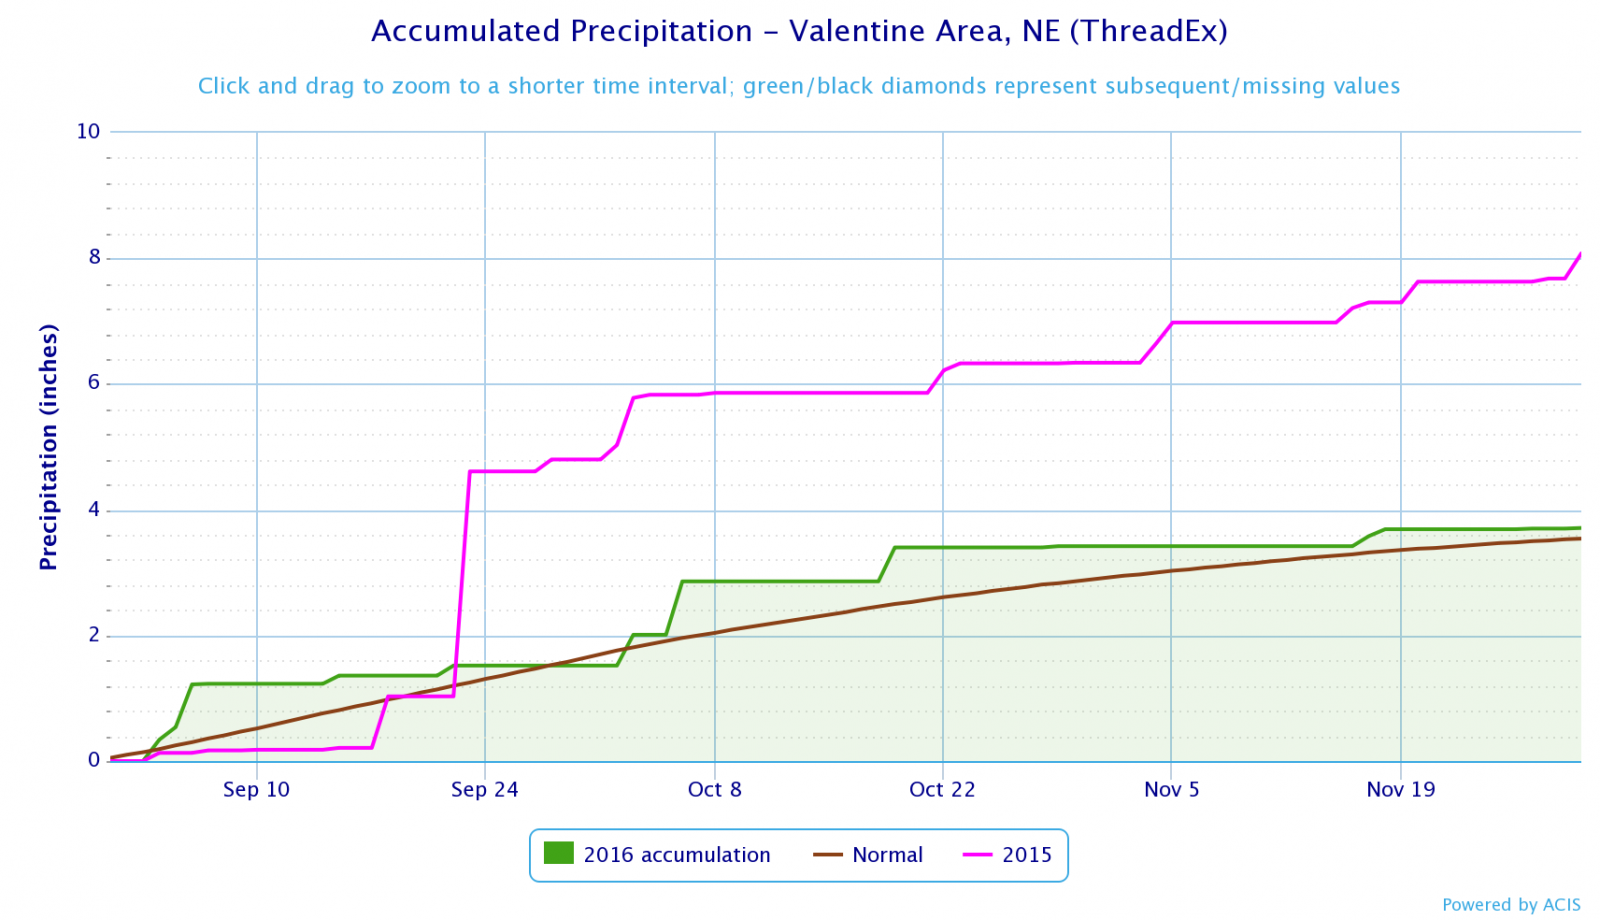
Valentine, NE
Fall Statistics
Facts for the 3 month period of September, October, and November
(including the last 5 years)
| Ave High |
Ave Low |
Ave Temp |
Precip | Snow | Days Lows ≤ 32 |
Days Highs 70+ |
Days Highs 80+ |
|
| Average | 62.6 | 34.9 | 48.8 | 3.12 | 6.4 | 39.8 | 34.5 | 17.4 |
| Max | 68.7 | 39.8 | 54.2 | 8.63 | 52.9 | 54 | 51 | 30 |
| Year | 1963 | 1963 | 1963 | 1973 | 1985 | 1985 | 2016 | 1953 |
| Min | 54.3 | 28.4 | 41.4 | 0.37 | Trace | 24 | 20 | 5 |
| Year | 1985 | 1985 | 1985 | 1958 | 5 times (1912,1913, 1949,1962 2007) |
2016 | 1925 | 1986 |
| 2012 | 65.2 | 33.4 | 49.3 | 1.15 | 10.7 | 44 | 42 | 25 |
| 2013 | 62.8 | 36.2 | 49.5 | 5.26 | 6.8 | 41 | 32 | 20 |
| 2014 | 63.3 | 34.3 | 48.8 | 1.85 | 6.4 | 38 | 39 | 19 |
| 2015 | 65.9 | 37.9 | 51.9 | 8.08 | 10.1 | 31 | 41 | 19 |
| 2016 | 68.2 | 38.8 | 53.5 | 4.11 | 6.3 | 24 | 51 | 23 |
| Top 10 Finishes for the 2016 Fall (Sep, Oct, Nov) for Valentine | |||||||||
| Average High (Warmest) |
Average Low (Warmest) |
Average Temp (Warmest) |
Days ≤32 (Least) |
Days 70+ (Most) |
|||||
| 1 | 68.7 (1963) | 1 | 39.8 (1963) | 1 | 54.2 (1963) | 1 | 24 (2016) | 1 | 51 (2016) |
| 2 | 68.2 (2016) | 2 | 39.5 (1998) | 2 | 53.6 (1953) | 2 | 27 (1953) | 2 | 47 (1963,1953) |
| 3 | 67.8 (1990) | 3 | 39.4 (1953) | 3 | 53.5 (2016) | 3 | 28 (1915,1924, 1963) |
||
| 4 | 67.8 (1953) | 4 | 38.8 (2016) | 4 | 52.6 (1998) | 4 | 46 (1940) | ||
| 5 | 67.2 (2005) | 5 | 38.8 (1940,1931) |
5 | 52.6 (1933) | 5 | 45 (1931) | ||
| 6 | 67.0 (2001) | 6 | 52.1 (1931) | 6 | 29 (1931,1934) |
6 | 44 (2010,1922 1910) |
||
| 7 | 67.0 (1933) | 7 | 38.5 (1954) | 7 | 51.9 (2005) | ||||
| 8 | 66.7 (1999) | 8 | 38.2 (1933) | 8 | 51.9 (2015) | 8 | 30 (1937,1940, 1941,1949, 1950,1954) |
||
| 9 | 66.5 (1904) | 9 | 38.1 (1941) | 9 | 51.9 (1914) | 9 | 43 (1956) | ||
| 10 | 66.4 (1958) | 10 | 38.0 (1924) | 10 | 51.8 (1940) | 10 | 42 (2012,1999 1947,1938) |
||
 |
Page composition by Matthew Masek Update includes 2016 |
 |


 Follow us on YouTube