Valentine Christmas Day Climatology
| Christmas Day is observed nationally on December 25 and observations have been recorded in Valentine on Christmas Day since 1889. Included below is information about a White Christmas in Valentine. |
CHRISTMAS DAY IN VALENTINE
PERIOD OF RECORD 127 YEARS: 1889-2015
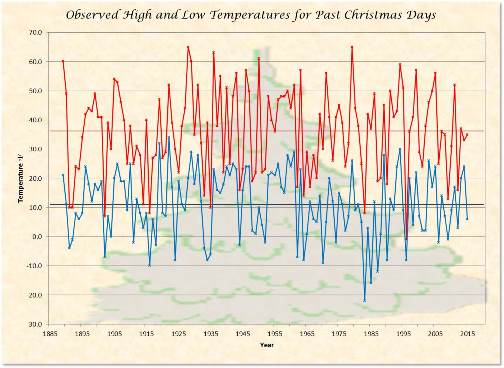
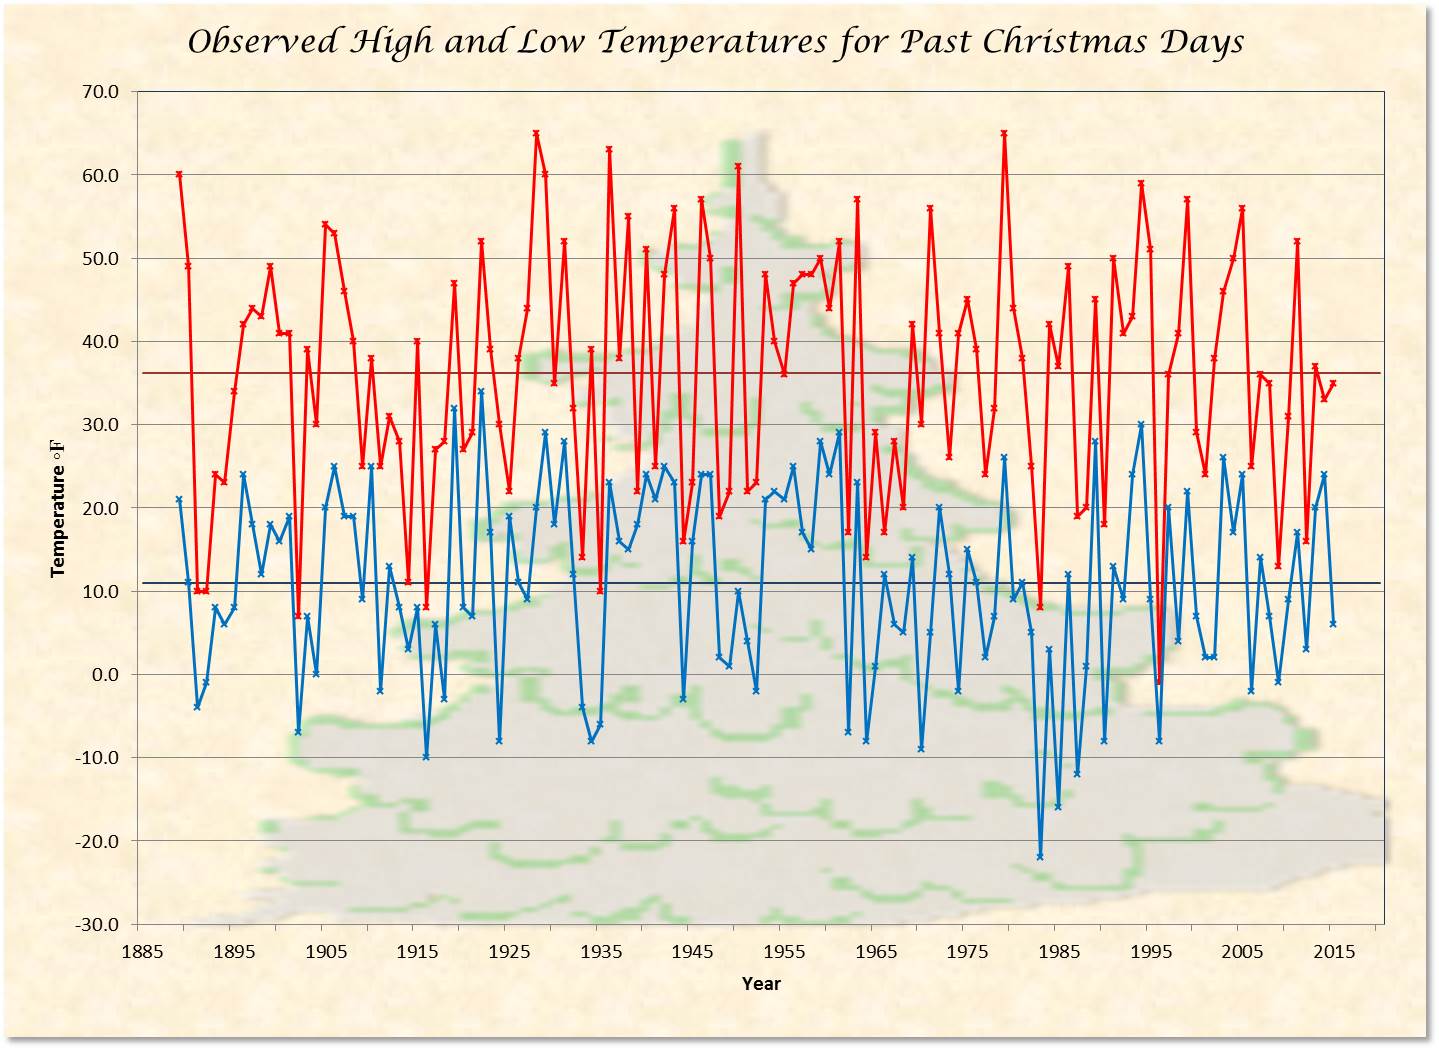
TEMPERATURE DATA
| Highest |
65 degrees (2 times)
(1928 & 1979) |
| Lowest |
-22 degrees (1983) |
| Lowest Maximum |
-1 degrees (1996) |
| Highest Minimum |
34 degrees (1922) |
| Average High |
36.2 degrees |
| Average Low |
11.0 degrees |
| 30 year Normal High |
36 degrees |
| 30 year Normal Low |
10 degrees |
| Average Temperature Range |
25.2 degrees |
Largest Range
between High and Low |
53 degrees
High 37, Low -16 (1985) |
Smallest Range
between High and Low |
3 degrees
High 22, Low 19 (1925) |
|
High Temperature by 10 Degree Ranges
| -0s |
0s |
10s |
20s |
30s |
40s |
50s |
60s |
| 1 |
3 |
14 |
26 |
26 |
31 |
20 |
6 |
| 0.8% |
2.4% |
11.0% |
20.5% |
20.5% |
24.4% |
15.7% |
4.7% |
|
Low Temperature by 10 Degree Ranges
| -20s |
-10s |
-0s |
0s |
10s |
20s |
30s |
| 1 |
3 |
19 |
36 |
32 |
33 |
3 |
| 0.8% |
2.4% |
15.0% |
28.3% |
25.2% |
26.0% |
2.4% |
|
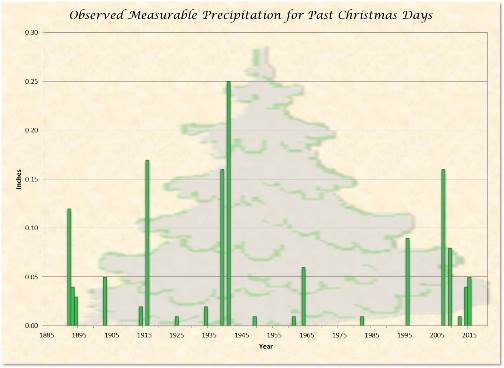
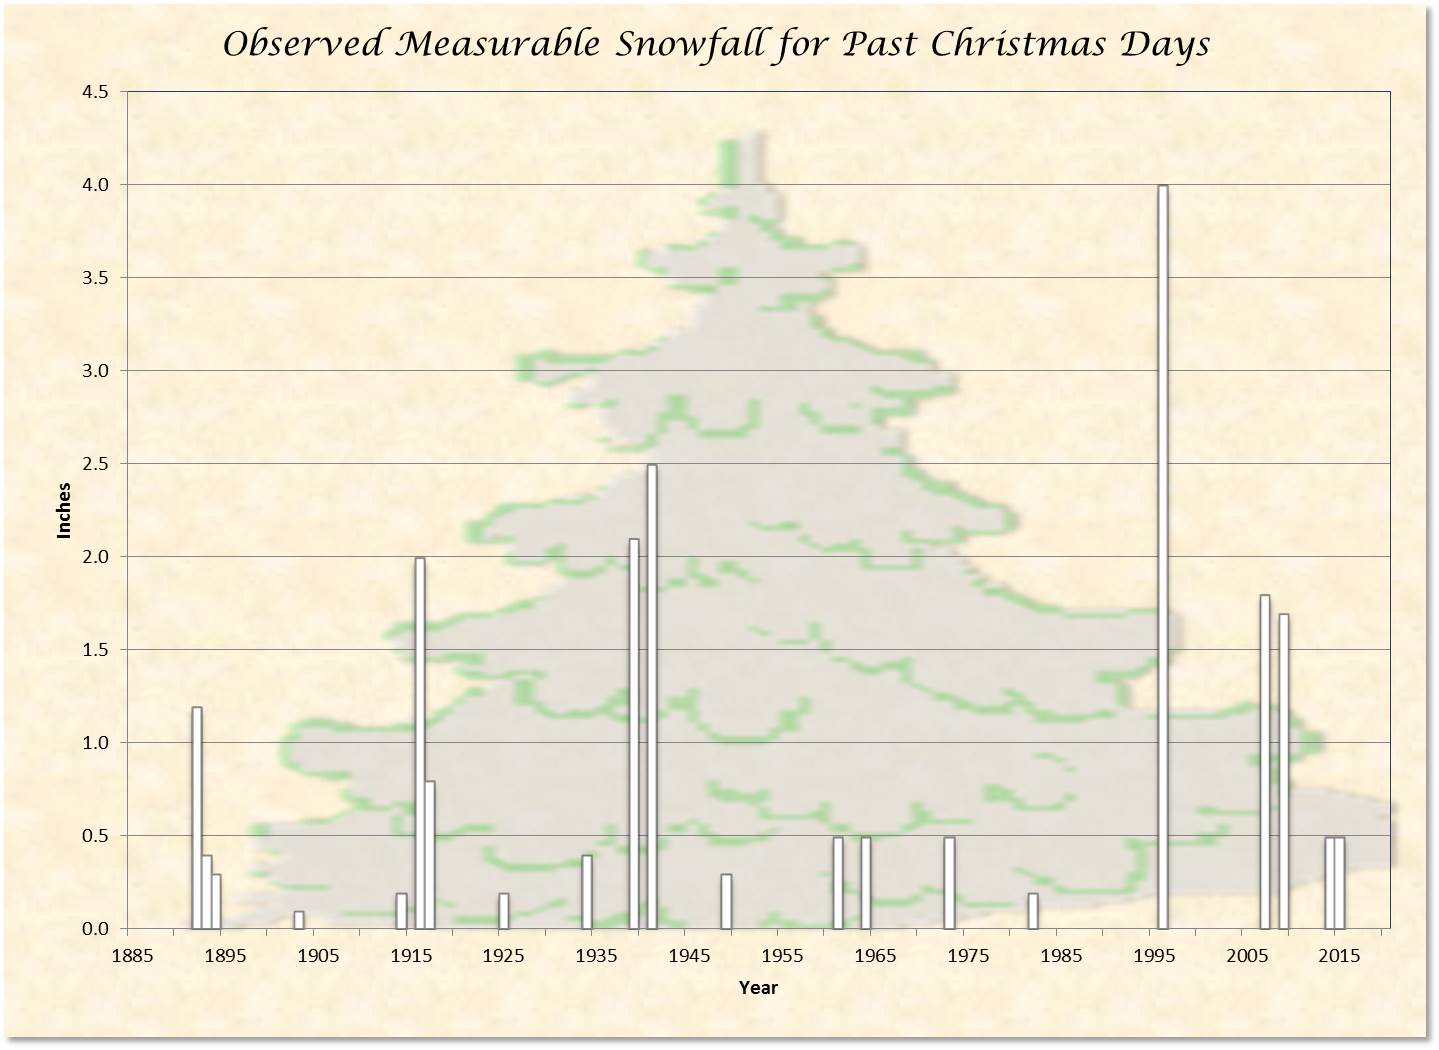
PRECIPITATION DATA
| Maximum Precipitation |
0.25 inches (1941) |
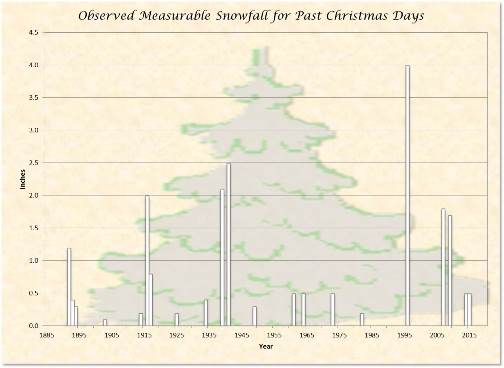
| Maximum Snowfall |
4.0 inches (1996) |
| Number of Times Precipitation |
42 Occurrences or 33.1% |
Number of Times
Measurable Precipitation
(more than a Trace) |
20 Occurrences or 15.7% |
| Number of Times Snowfall |
38 Occurrences or 29.9% |
Number of Times
Measurable Snowfall
(more than a Trace) |
21 Occurrences or 16.5% |
| Number of Times No Precipitation |
85 Occurrences or 66.9% |
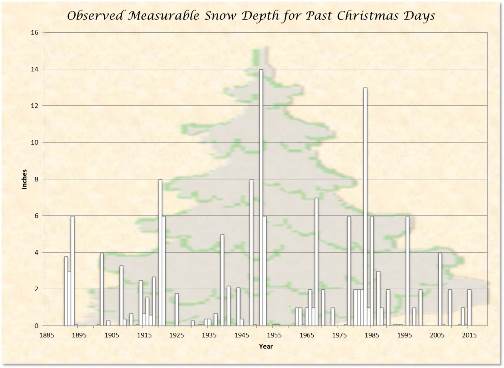
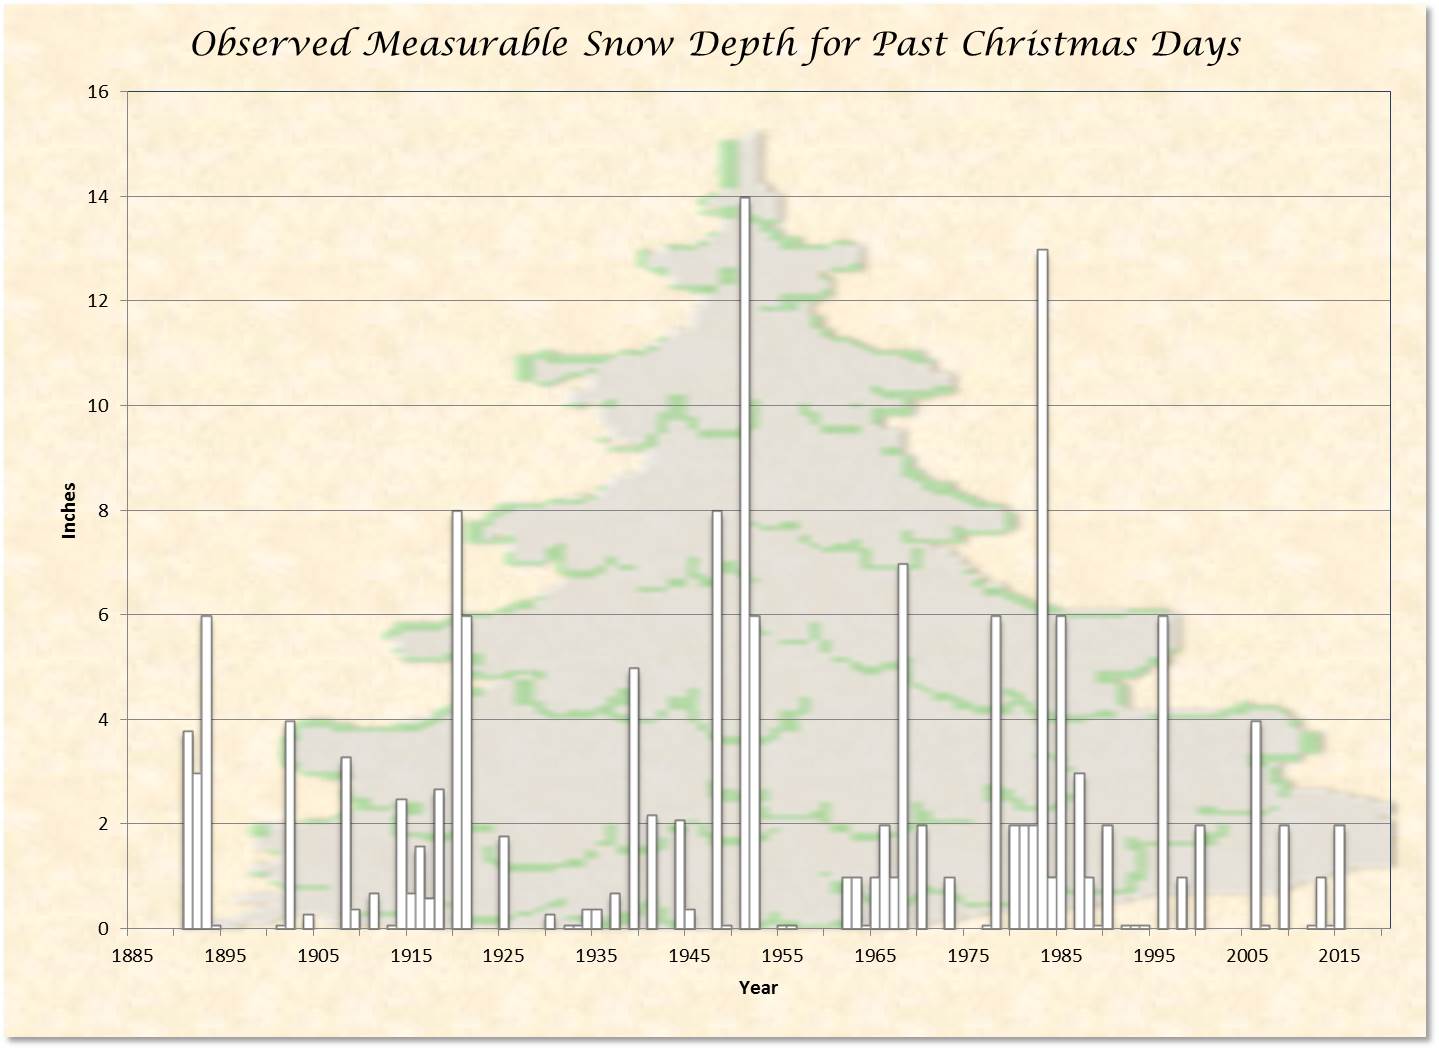
Most Snow on Ground
at Observation Time |
14 inches (1951) |
|
WHITE CHRISTMAS IN VALENTINE
PERIOD OF RECORD 127 YEARS: 1889-2015
White Christmas = 1 inch or more of snow on ground
at observation time on December 25
(snow depth rounded to nearest whole inch or trace if 0.4 inches or less)
Number of Years with a
White Christmas (127 years) |
46 Years (36.2%) |
Number of Years with a
White Christmas (last 25 years) |
7 Years (28.0%) |
Number of Years with a
White Christmas (last 10 years) |
4 Years (40.0%)
2006 - 4 inches
2009 - 2 inches
2013 - 1 inch
2015 - 2 inches |
Number of Years with trace or
more snow on Ground (127 years) |
69 Years (54.3%) |
Number of Years with trace or
more snow on Ground (last 25 years) |
13 Years (52.0%) |
Number of Years with trace or
more snow on Ground (last 10 years) |
7 Years (70.0%) |
Consecutive Years with a
White Christmas |
6 Years (1980 - 1985) |
Consecutive Years without a
White Christmas |
11 Years (1925 - 1936) |
Current Streak Consecutive Years
White Christmas |
1 Year |
|
White Christmas Occurences by Decade
* incomplete decade
| 1890s |
1900s |
1910s |
1920s |
1930s |
1940s |
1950s |
| 3 |
2 |
6 |
3 |
2 |
3 |
2 |
| 1960s |
1970s |
1980s |
1990s |
2000s |
2010s |
| 6 |
3 |
8 |
3 |
3 |
2* |
|
DAILY WEATHER SUMMARIES PAST 5 CHRISTMAS DAYS
| Date |
High |
Low |
Precip |
Snow |
Snow Depth |
Remarks |
| 2011 |
52 |
17 |
0.00 |
0.0 |
0 |
Sunny |
| 2012 |
16 |
3 |
0.01 |
T |
T |
Mostly cloudy, on and off flurries all day |
| 2013 |
37 |
20 |
0.00 |
0.0 |
1 |
Mostly sunny |
| 2014 |
33 |
24 |
0.04 |
0.5 |
T |
Cloudy, light snow most of the day |
| 2015 |
35 |
6 |
0.05 |
0.5 |
2 |
Sunny morning, then cloudy with
evening light snow |
|
YEAR BY YEAR WEATHER FOR PAST CHRISTMAS DAYS
CLICK ON GRAPH FOR LARGER IMAGE
ALSO VISIT NORTH PLATTE CHRISTMAS DAY CLIMATOLOGY
For a climatology including a map of a white Christmas
across the lower 48 states visit White Christmas
For more holiday climate studies see the main menu
Holiday Climate Studies for North Platte and Valentine
 |
Page composition by
Matthew Masek
Update includes 2015 |
 |


 Follow us on YouTube