Cooperative Station Climate Data
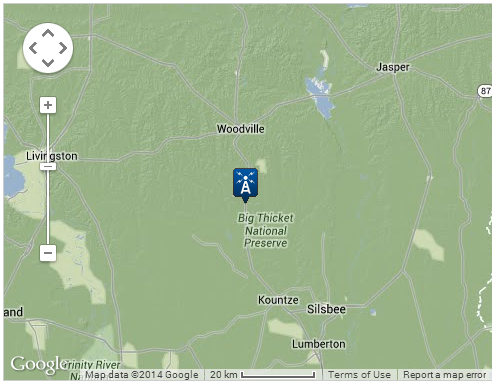
| Station: Warren 2 S State: Texas Parish: Tyler |
| 30 Year Normals (1971-2000) | |||||||||||||||
|---|---|---|---|---|---|---|---|---|---|---|---|---|---|---|---|
| Month | Jan | Feb | Mar | Apr | May | Jun | Jul | Aug | Sep | Oct | Nov | Dec | Year | ||
| N o r m a l |
Temps (°F) |
Max | -- | -- | -- | -- | -- | -- | -- | -- | -- | -- | -- | -- | -- |
| Min | -- | -- | -- | -- | -- | -- | -- | -- | -- | -- | -- | -- | -- | ||
| Precipitation (in.) | 5.32 | 3.78 | 4.38 | 4.31 | 5.94 | 5.87 | 3.50 | 3.49 | 4.53 | 4.59 | 5.05 | 5.99 | 56.75 | ||
| Degree Days |
Heating | -- | -- | -- | -- | -- | -- | -- | -- | -- | -- | -- | -- | -- | |
| Cooling | -- | -- | -- | -- | -- | -- | -- | -- | -- | -- | -- | -- | -- | ||
Note: Sums/averages of monthly values may not equate to yearly sums/averages due to rounding -
click here for more info
 |
Data courtesy of the National Climatic Data Center
Map courtesy of Google - map functions are non-operative


 Follow us on YouTube