Satellite Analysis of the 05-06 June 1998
|
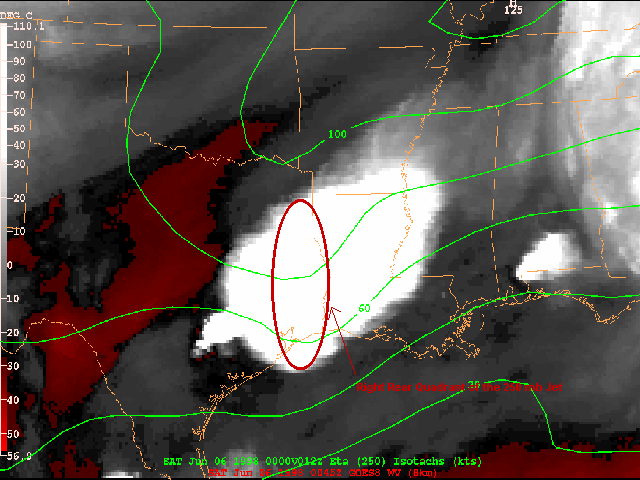 Figure 6. 250 mb ETA model isotachs superimposed on GOES-8 6.7 micron water vapor |
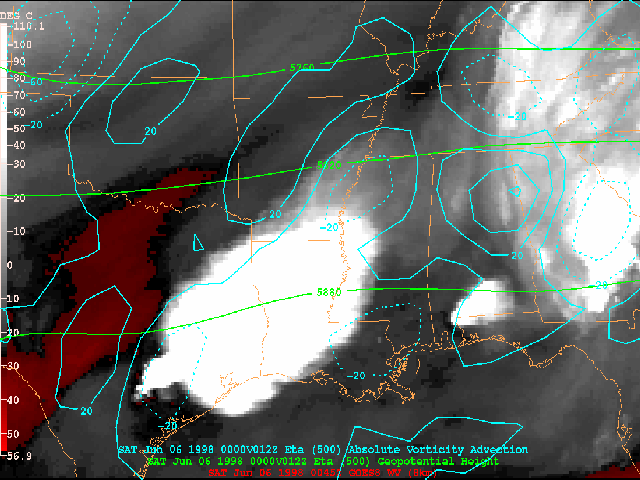 Figure 7. 500 mb heights and absolute vorticity advection superimposed on GOES-8 6.7 micron water vapor |
In addition to the low-level instability, favorable upper-level dynamics contributed to these thunderstorms reaching severe levels and for sustaining the complex for several hours. The ETA model 12-hour forecast, valid at 00:00 UTC, 500 mb absolute vorticity advection and 250 mb winds in isotachs superimposed on the GOES-8 6.7 micron water vapor imagery (Figures 6 and 7) indicated that there was moderate upper level dynamics. Notice the darkening on the water vapor imagery from Central Texas into Southeast Oklahoma. This was a good indicator of the presence of an upper level jet and its subsidence region of the left rear quadrant. The ETA model indicated the forecast area was under the favorable right rear quadrant of the 250 mb jet maximum. Notice in Figure 6 how the right rear quadrant coincides with the thunderstorm cloud tops; indicating this is a region of upward vertical motion. In addition, positive vorticity advection at 500 mb (Figure 7) indicated the presence of mid level lift. The water vapor imagery helped to validate the accuracy of the ETA model, which in this situation was very good.
Conclusion: Through satellite analysis of this event, one could see a correlation between the overshooting tops and severe thunderstorms. While real-time satellite imagery is not yet available to the operational meteorologist, satellite analysis is crucial in assessing the pre-storm environment, validating the accuracy of the forecast models, and monitoring trends in upstream thunderstorm activity. Satellite imagery is best used when integrated into the forecast and warning processes.
A special thanks to the Cooperative Institute for Meteorological Satellite Studies (CIMSS) at the University of Wisconsin for providing GOES-8 Sounder Derived products.
Address any questions or comments to David Wally - NWS Lake Charles Satellite Focal Point*
* Author's Current Affiliation: NWS's National Centers for Environmental Prediction - Hydrometeorological Prediction Center, Camp Springs MD
|
|


 Follow us on YouTube