Storm Reports | Radar | DeKalb Area Storm Survey | Meteorology | Forecasts
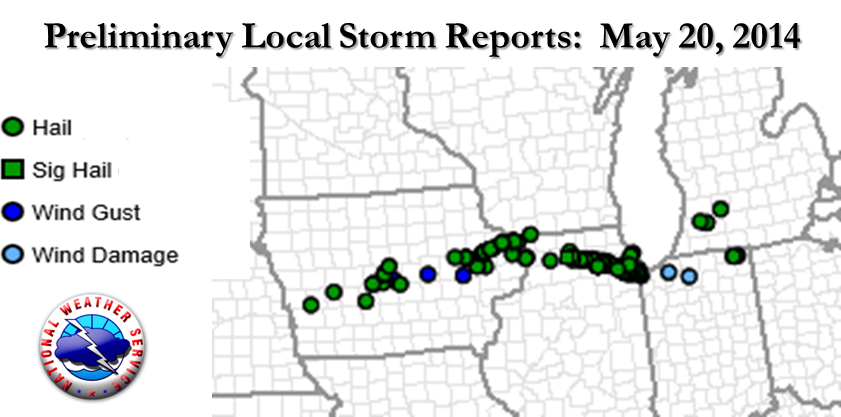
Summary of Local Storm Reports (pdf)
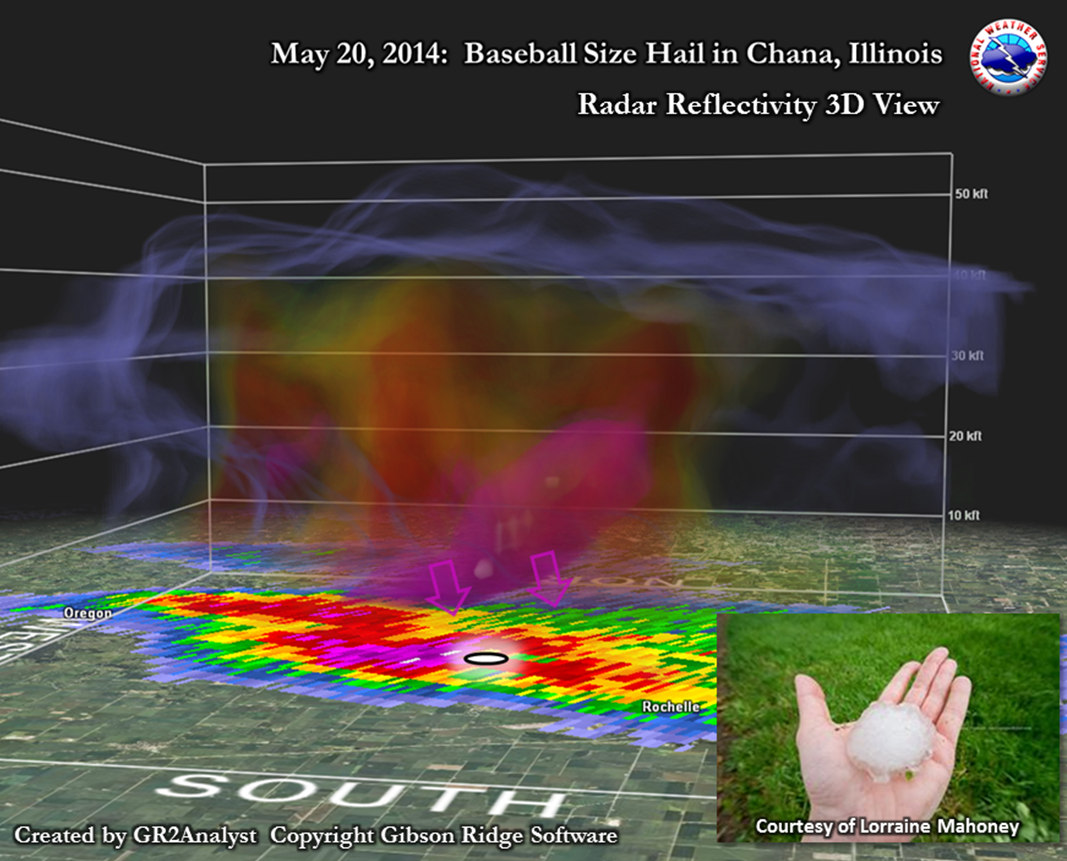
The radar loop (above) shows the development and path of the supercells that developed over Northern Illinois and eventually pushed into Northwest Indiana.
 |
|
For a larger loop, click here. |
Below is a radar loop from the Terminal Doppler Weather Radar (TDWR) near Midway Airport from the evening of May 20th, from 8:18 pm - 9:26 pm (though with a few missing images). It shows reflectivity and storm relative motion data from the 0.3° scan at one minute time intervals. This high temporal resolution can allow for the ability to see the evolution of storm scale features when storms are in close proximity to the radar.
Note in this loop the supercell storm cycling with initial rotation, and then with various outflows and downdrafts during the latter half of the loop.
|
TMDW Terminal Doppler Weather Radar Reflectivity and Storm Relative Motion from 8:18 pm - 9:26 pm |
|
|
|
Click image for full resolution loop |
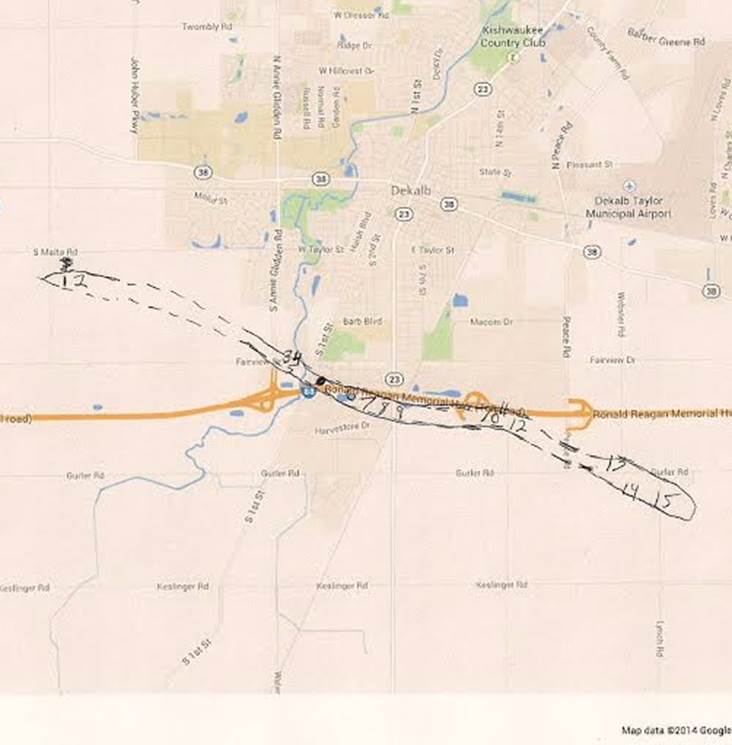
PNSLOT
ILZ003>006-008-010>014-019>023-032-033-039-INZ001-002-010-011-019-
281000-

PUBLIC INFORMATION STATEMENT
NATIONAL WEATHER SERVICE CHICAGO IL
501 PM CDT TUE MAY 27 2014 /601 PM EDT TUE MAY 27 2014/

...DAMAGE SURVEY RESULTS FROM MAY 20TH DEKALB COUNTY STORM...

A POWERFUL SUPERCELL THUNDERSTORM MOVED ACROSS DEKALB COUNTY
DURING THE EARLY EVENING HOURS OF MAY 20TH. A SURVEY OF THE
SUBSEQUENT DAMAGE CAUSED BY THIS INTENSE SUPERCELL REVEALED AN
APPROXIMATELY 7 MILE LONG PATH OF DAMAGE CONSISTENT WITH WIND
SPEEDS OF 60 TO OCCASIONALLY NEAR 100 MPH.

THE SURVEY REVEALED DAMAGE FROM JUST SOUTH OF THE INTERSECTION OF
MALTA ROAD AND NELSON ROAD...EAST SOUTHEAST TO NEAR FAIRVIEW DRIVE
AND ANNIE GLIDDEN ROAD...THEN CONTINUING EAST JUST SOUTH OF THE
INTERSTATE 88 TOLLWAY TO NEAR THE INTERSECTION OF GURLER ROAD AND
PEACE ROAD. THE DAMAGE SURVEY CONCLUDED NEAR LYNCH ROAD JUST SOUTH
OF GURLER ROAD. THE MOST SIGNIFICANT DAMAGE WAS NOTED NEAR
HARVESTORE WAREHOUSE WHERE A PORTION OF THE ROOF WAS TORN OFF...A
WINDOW BROKEN...AND SOME MOBILE HOMES IN THE PARKING LOT ROLLED OR
OVERTURNED.

INDICATIONS FROM THE DAMAGE SURVEY ALONG WITH EYEWITNESS REPORTS
INDICATE THAT SOME ROTATION OR VORTEX WAS PRESENT DURING THE
INTENSE WINDS. AFTER STUDYING RADAR DATA...WITNESS
ACCOUNTS...SURFACE OBSERVATION DATA AND DAMAGE SURVEY RESULTS THE
TEAM HAS CONCLUDED THAT THE DAMAGE WAS LIKELY A RESULT OF A
POWERFUL DOWNDRAFT FROM THE SUPERCELL THUNDERSTORM WHICH LIKELY
SPAWNED ONE OR MORE GUSTNADOES WHICH LIKELY ACCOUNTED FOR THE
EVIDENCE OF ROTATION. A GUSTNADO IS AN INFORMAL TERM FOR STRONG
CIRCULATION WITHIN AN AREA OF STRONG THUNDERSTORM OUTFLOW WINDS.

THE NATIONAL WEATHER SERVICE CHICAGO WISHES TO EXTEND GRATITUDE TO
GILBERT SEBENSTE FROM NORTHERN ILLINOIS UNIVERSITY WEATHER AS WELL
AS JASON LEVERTON FROM THE DEKALB POLICE DEPARTMENT FOR THEIR
EFFORTS IN SURVEYING AND DOCUMENTING THE DAMAGE ACROSS DEKALB
COUNTY.

$$
|
DeKalb Area Survey Map |
|
|
|
Courtesy of Gilbert Sebenste |
|
|
|
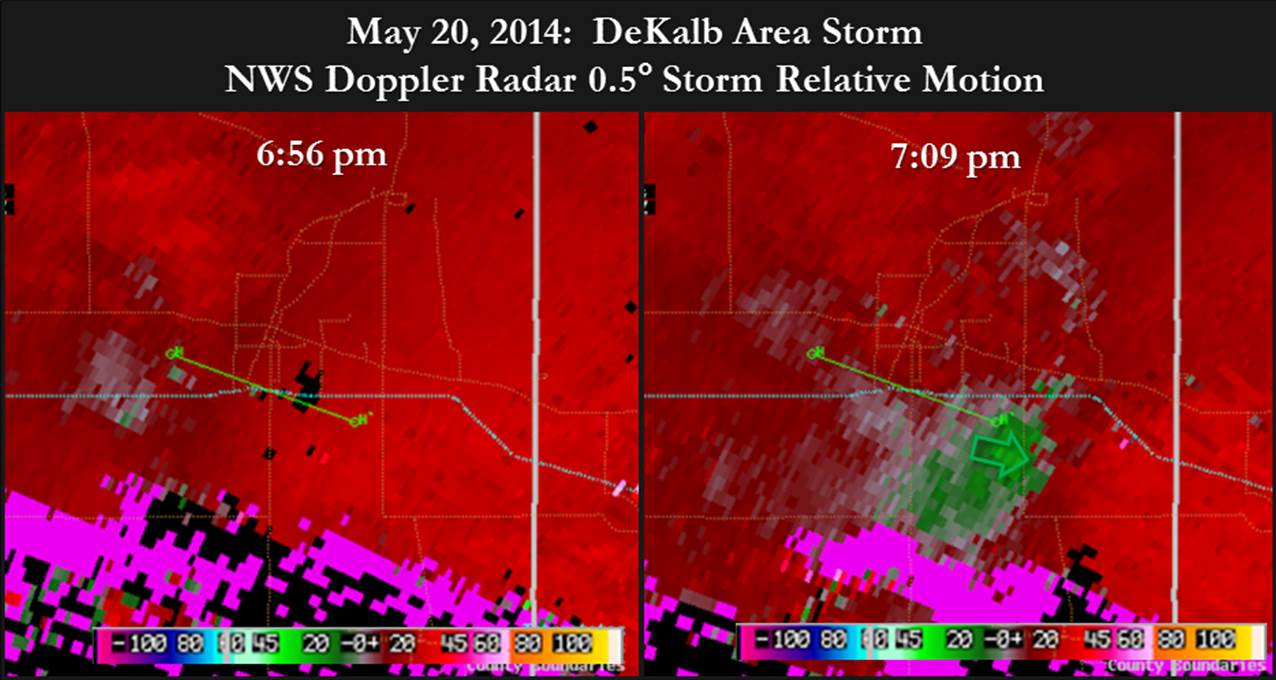
Within a ~13 min span, strong inbound velocities (to the radar site in Romeoville) develop on the far south side of DeKalb. These were mainly associated with a strong rear-flank downdraft, as evidenced by radar reflectivity and velocity signatures at multiple scanning angles. |
During the morning of May 20th 2014, very warm and steadily moistening conditions began to develop over Northern Illinois and Northwest Indiana. Soundings indicated that the atmosphere was capped, an indication of warm air aloft preventing rising air, and had lingered through the first half of the afternoon. As the day progressed, the additional sounding in the afternoon hours at Davenport, IA indicated this capped environment was beginning to erode.
Observation data from across the region at 12Z (7 AM CDT). Dew points in Northern IL/Northwest IN were generally in the middle to upper 50s, with portions of Central IL seeing the low-level moisture beginning to creep North as dew points were hovering around 60 degrees at this time.
As the day progressed, the low-level moisture continued to creep North into Northern IL/Northwest IN. The above image is the observational data from 20Z (3PM CDT), and dew points across the region were generally in the lower 60s at this time. In addition to the high dew points, the full sunshine through early afternoon allowed surface temperatures to soar into the lower to middle 80s.
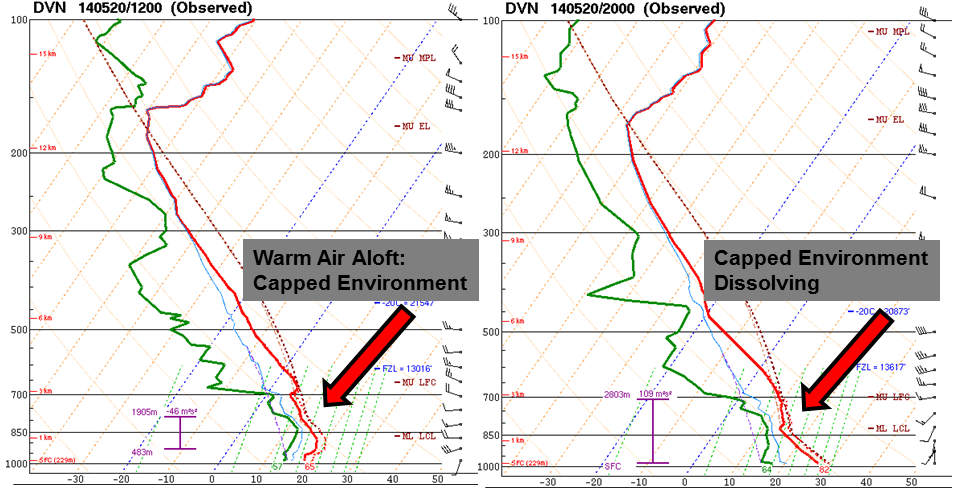
Sounding analysis comparing the 12Z and 20Z data from Davenport, IA. Note the presence of warm air in the lower levels above the surface to start the day, indicating the presence of a capped environment. This type of atmosphere prevents air parcels at the surface from lifting, thus acting like a lid or cap. The 20Z sounding (on the right) indicates that the warm surface conditions have been able to overcome the warm air aloft, indicating that the environment is destabilizing. As a result, the ability for air parcels to freely lift through the unstable environment.
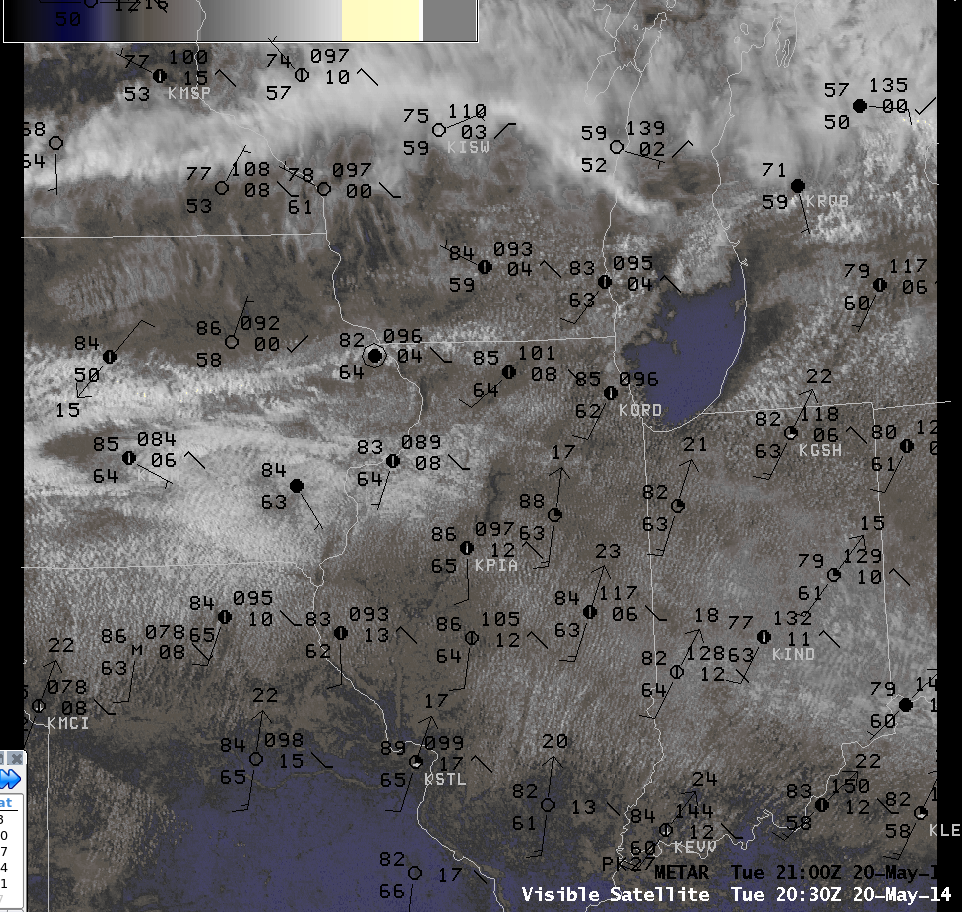
Visible imagery depicted considerable cumulus clouds across the region, with what appeared to be the presence of a boundary over Southwest WI stretching southwest through East Central IA. North of this boundary, surface observations indicated dew points were hovering in the upper 50s while just south of this feature dew points were in the lower 60s.
The 0-6KM bulk shear was increasing, with the highest magnitudes in the afternoon between 50-60kts stretching from Northern IA into Central/Southern WI.
As the convection continued to develop, the 0-6KM Shear vectors continued to increase. By 23Z (6PM CDT) values had increased to between 60-70kts. The high shear values are a good indicator that any supercell storms that develop could easily produce large hail.
Once the capped environment began to dissolve, the atmosphere was already primed. Mesoscale analysis indicated that the mean-layer CAPE had already grown to over 1500J/KG. The image above also indicates that any convection would likely also be able to maintain itself given the lack of inhibition.
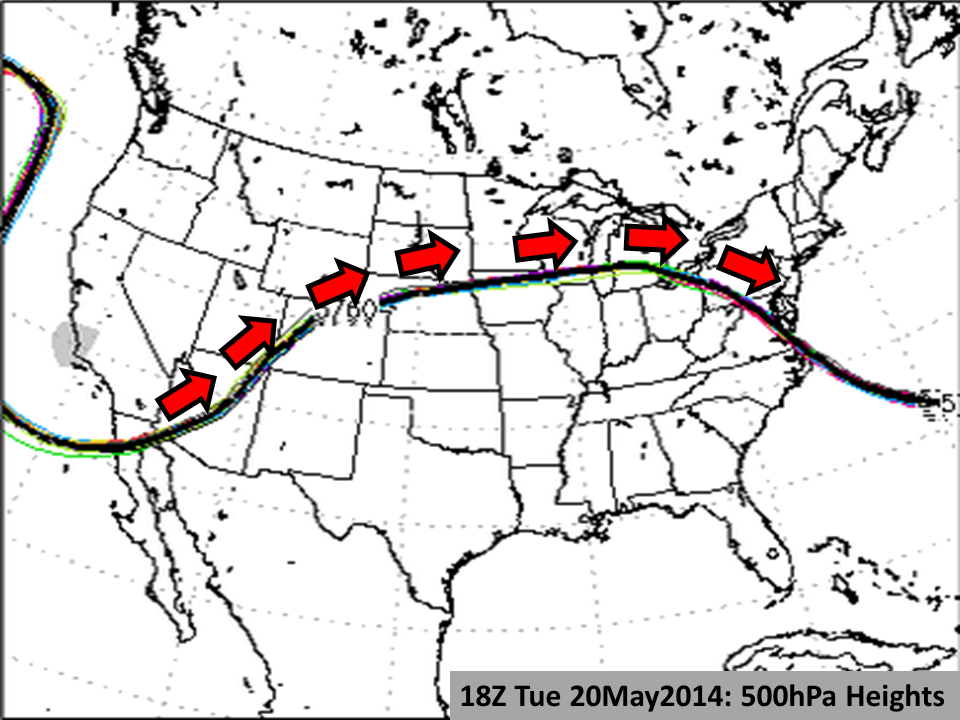
Another item forecasters frequently look at to determine the path of storms, is the 500hPa heights. The red arrows, in the image above, indicate the general path that storms or convective elements will take when there is the presence of a ridge.
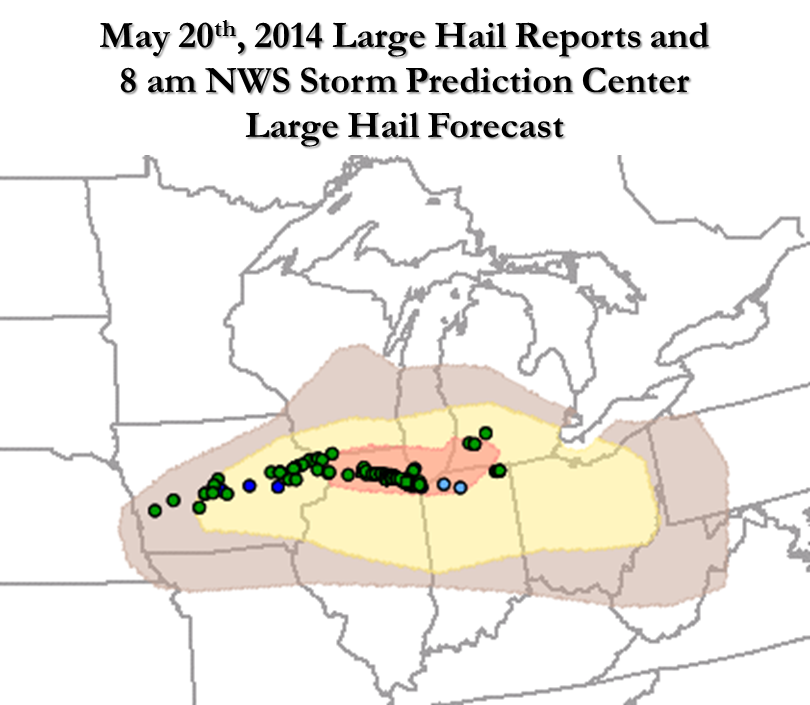
As the environment continued to become unstable, the SPC had issued a discussion highlighting the potential for isolated storms capable of producing large hail and gusty winds.


 Follow us on YouTube